Draw E and V versus r on the same graph for a point charge.
To draw the electric field (E) and electric potential (V) versus distance (r) from a point charge, we will follow these steps:
Step 1: Understand the Formulas
For a point charge Q:
- The electric field E at a distance r from the charge is given by:
E=kQr2
- The electric potential V at a distance r from the charge is given by:
V=kQr
where k is Coulomb's constant.
Step 2: Analyze the Behavior of E and V
- As r approaches 0, E approaches infinity (theoretically), and V also approaches infinity.
- As r increases, E decreases rapidly (proportional to 1r2), while V decreases more slowly (proportional to 1r).
- At r=1 (assuming kQ=1 for simplicity), both E and V can be equal since:
E=Vwhen1r2=1r
This simplifies to r=1.
Step 3: Draw the Graph
1. Set up the axes: Draw a horizontal axis (x-axis) for r and a vertical axis (y-axis) for both E and V.
2. Plot E vs. r:
- Start from a high value when r is close to 0.
- The curve will drop steeply as r increases, approaching 0 but never touching it.
3. Plot V vs. r:
- Start from a high value when r is close to 0.
- The curve will decrease more gradually compared to E and will also approach 0 as r increases.
Step 4: Identify Key Points
- Mark the point where r=1 on the graph. At this point, both curves intersect.
- For r<1, E is greater than V.
- For r>1, V is greater than E.
Step 5: Label the Curves
- Label the curve for electric field E and the curve for electric potential V.
Final Graph
Your graph should show:
- A steep curve for E starting from infinity and decreasing rapidly.
- A less steep curve for V starting from infinity and decreasing gradually.
- Both curves intersect at r=1.
For a point charge Q:
- The electric field E at a distance r from the charge is given by:
E=kQr2
- The electric potential V at a distance r from the charge is given by:
V=kQr
where k is Coulomb's constant.
- As r approaches 0, E approaches infinity (theoretically), and V also approaches infinity.
- As r increases, E decreases rapidly (proportional to 1r2), while V decreases more slowly (proportional to 1r).
- At r=1 (assuming kQ=1 for simplicity), both E and V can be equal since:
E=Vwhen1r2=1r
This simplifies to r=1.
1. Set up the axes: Draw a horizontal axis (x-axis) for r and a vertical axis (y-axis) for both E and V.
2. Plot E vs. r:
- Start from a high value when r is close to 0.
- The curve will drop steeply as r increases, approaching 0 but never touching it.
3. Plot V vs. r:
- Start from a high value when r is close to 0.
- The curve will decrease more gradually compared to E and will also approach 0 as r increases.
- Mark the point where r=1 on the graph. At this point, both curves intersect.
- For r<1, E is greater than V.
- For r>1, V is greater than E.
- Label the curve for electric field E and the curve for electric potential V.
Your graph should show:
- A steep curve for E starting from infinity and decreasing rapidly.
- A less steep curve for V starting from infinity and decreasing gradually.
- Both curves intersect at r=1.
Topper's Solved these Questions
- BOOK - CBSE COMPLEMENTARY MATERIALCHAPTER - ELECTROSTATICS AND CURRENT ELECTRICITY EXERCISE - SHORT ANSWER QUESTIONS (3 MARKS )23videos
ELECTROSTATICS AND CURRENT ELECTRICITY
- BOOK - CBSE COMPLEMENTARY MATERIALCHAPTER - ELECTROSTATICS AND CURRENT ELECTRICITY EXERCISE - LONG ANSWER QUESTIONS6videos
ELECTROSTATICS AND CURRENT ELECTRICITY
- BOOK - CBSE COMPLEMENTARY MATERIALCHAPTER - ELECTROSTATICS AND CURRENT ELECTRICITY EXERCISE - NUMERICALS49videos
ELECTROSTATICS AND CURRENT ELECTRICITY
- BOOK - CBSE COMPLEMENTARY MATERIALCHAPTER - ELECTRONIC DEVICES EXERCISE - NUMERICALS7videos
ELECTRONIC DEVICES
- BOOK - CBSE COMPLEMENTARY MATERIALCHAPTER - SAMPLE QUESTION PAPER 2019EXERCISE - Section C19videos
SAMPLE QUESTION PAPER 2019
Similar Questions
Draw E−r and V−r graphs due to two point charges +q and −2q kept at some along the line joining these two charges.
View SolutionDraw a velocity versus time graph of a stone thrown vertically upwards and then coming downwards after attaining the maximum height .
View SolutionDefine the terms stress and strain and also state their SI units. Draw the stress versus strain graph for a metallic wire, when stretched upto the breaking point.
View SolutionDraw the Cartesian plane on a graph paper and plot the given points.
E(0,−5/2)View SolutionDraw a plot showing the variation of (i) electric field E, and (ii) electric potential V with distance 'r' due to a point charge Q.
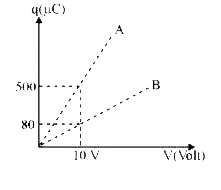
View SolutionFigure shows charge (q) versus voltage (V) graph for series and parallel combination to two given capacitors. The capacitances are:
 View Solution
Two points masses 'm' and 2m are kept at certain distance as shows in figure. Draw E−r and V−r graphs along the line joining them corresponding to given mass system.
 View Solution
Plot a graph comparing the variation of potential ‘V’ and electric field ‘E’ due to a point charge ‘Q’ as a function of distance r from point charge
(ii) Find the ratio of the potential differences that must be applied across the parallel and the series combination of two identical capacitors so that the energy stored, in the two cases, becomes the same.View SolutionDraw the graphs of y=x and y=−x in the same graph. Also, find the coordinates of the point where the two lines intersect.
View SolutionDraw g' versus dandg' versus h graph. Here, 'd' is depth below the surface of earth and h is the height from the surface of earth.
View Solution

