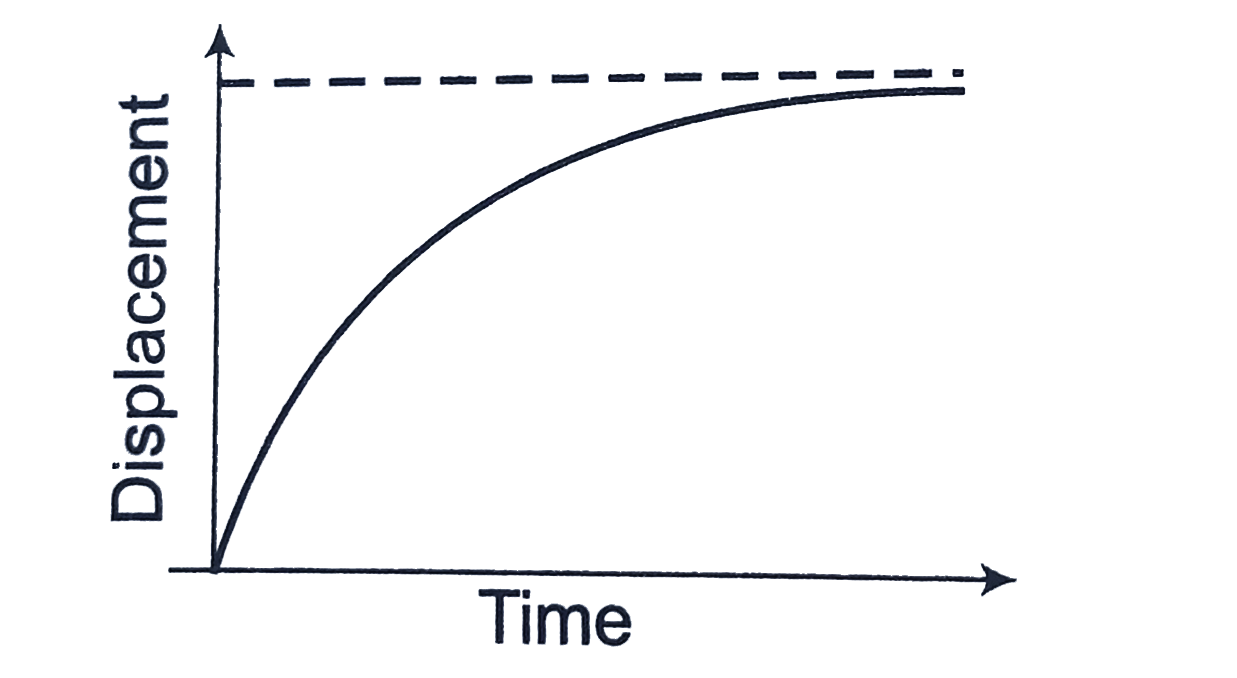
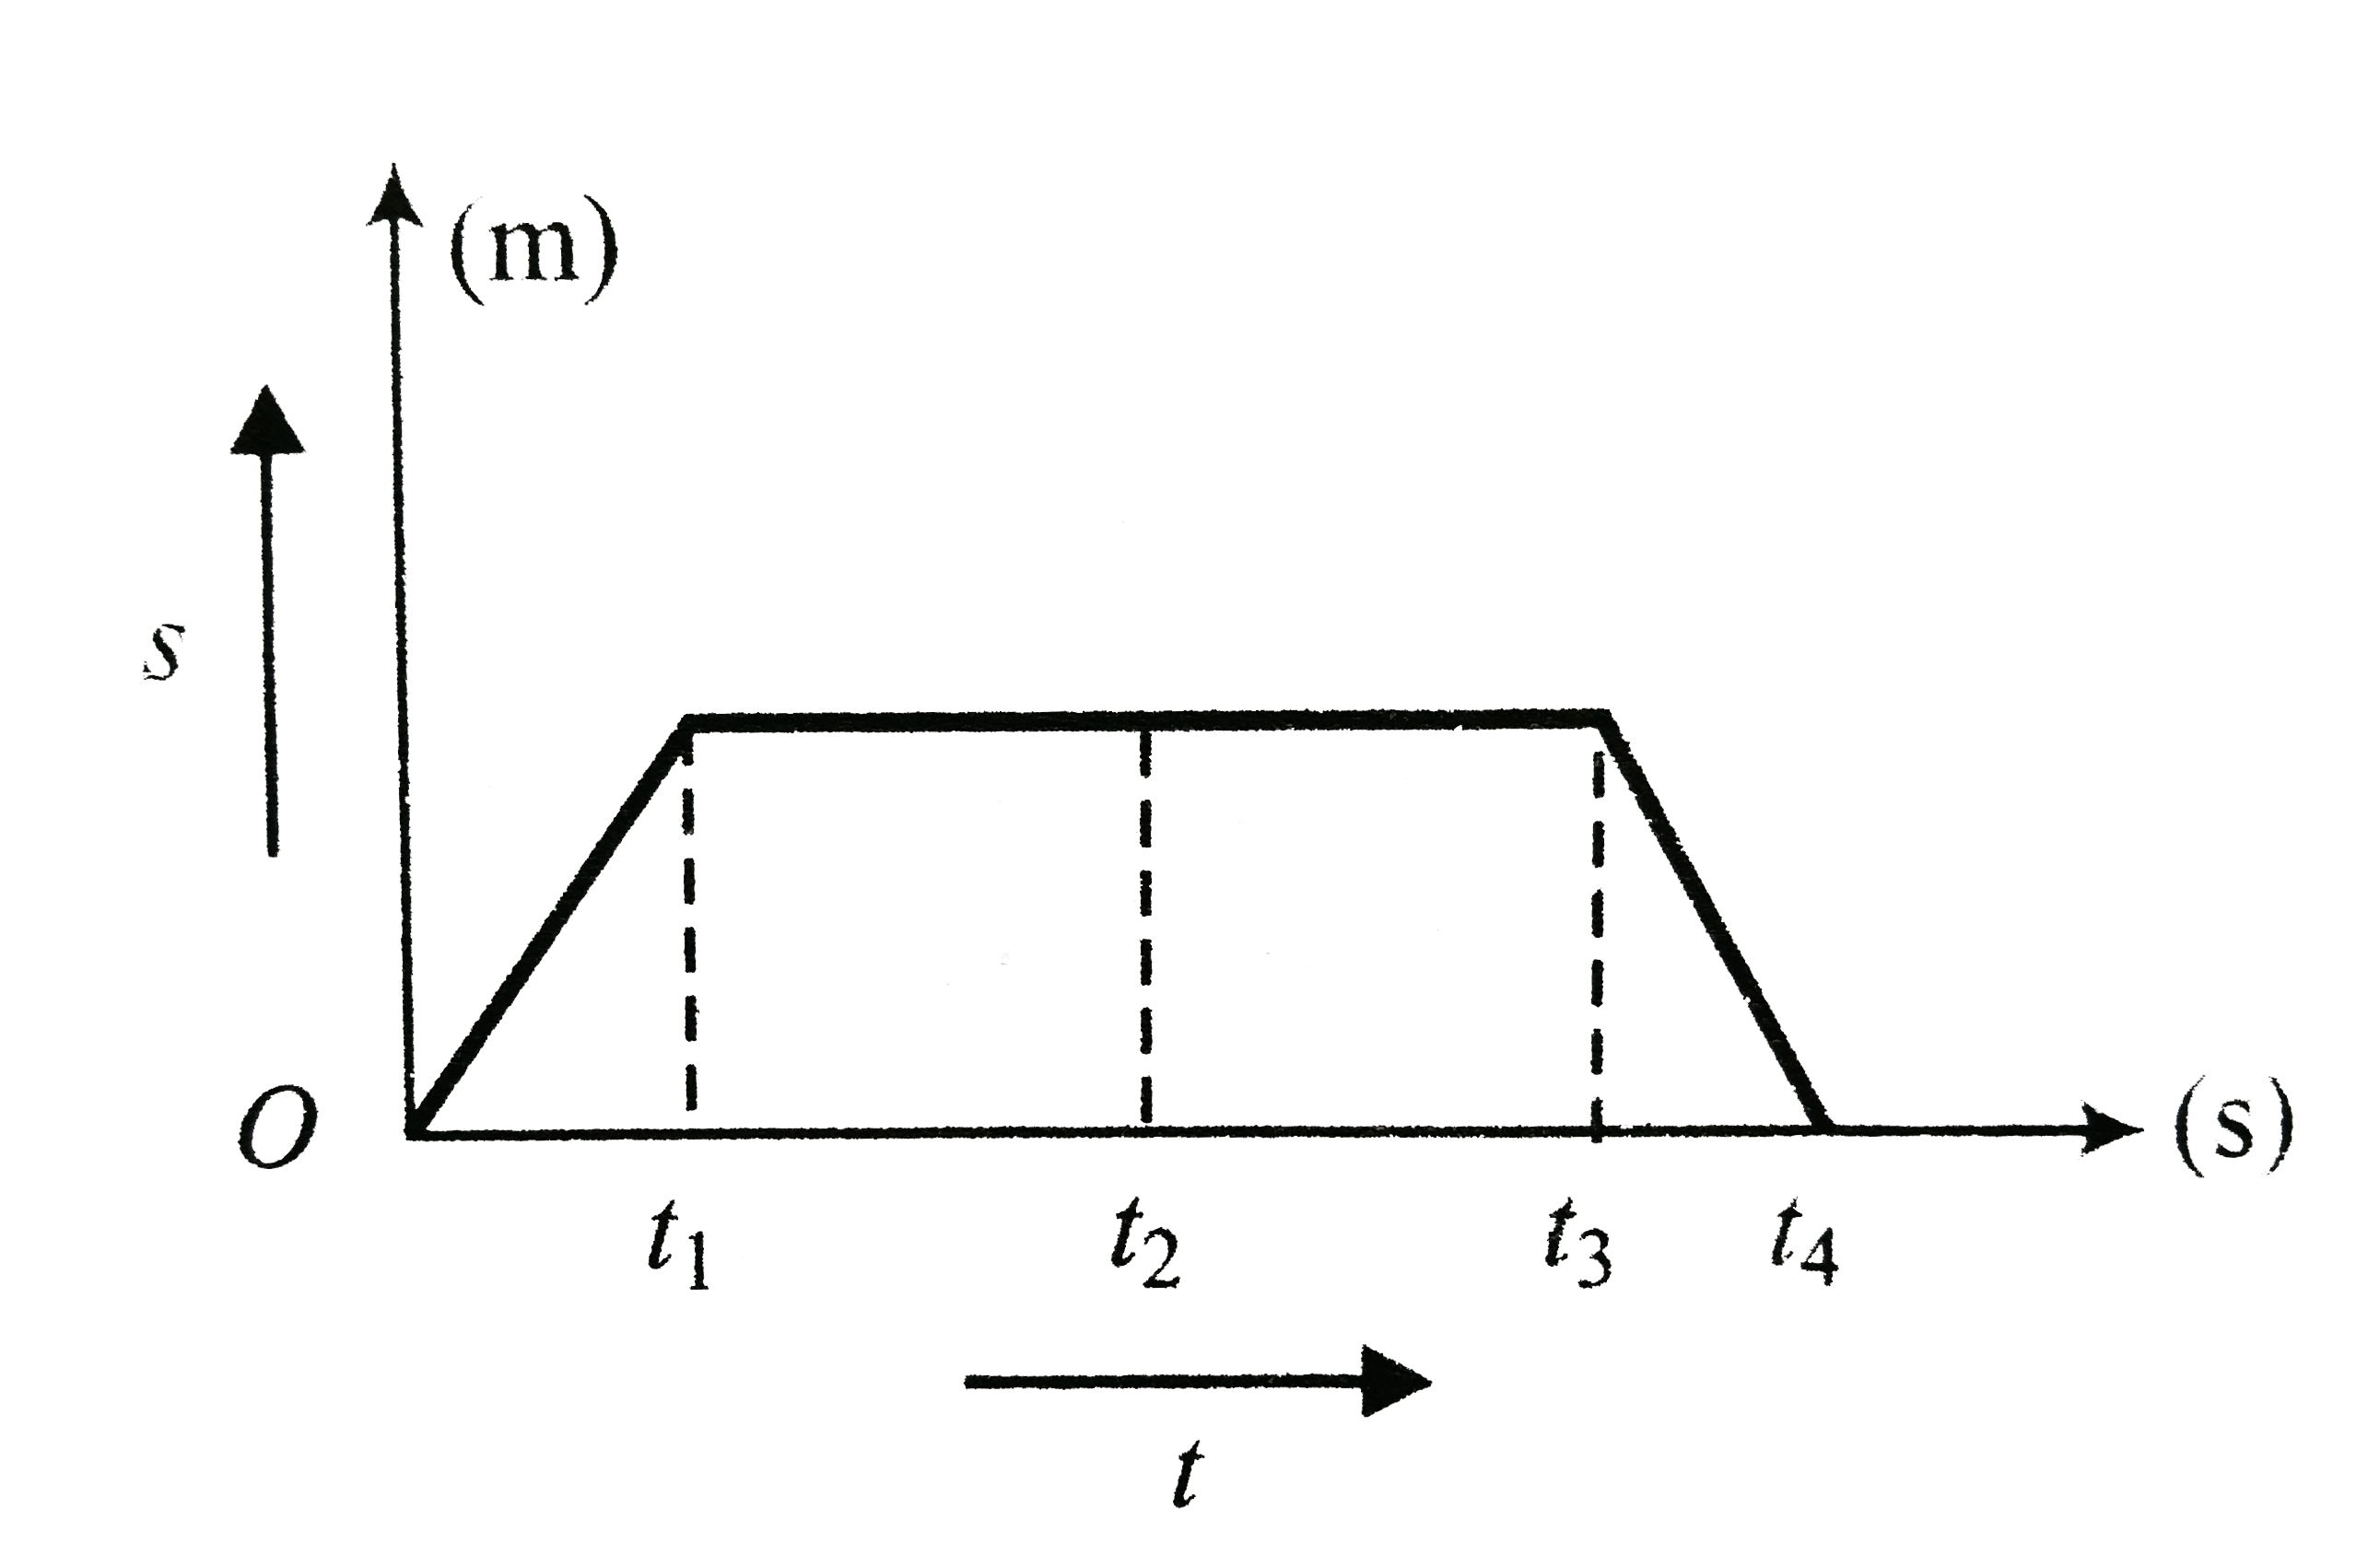
Draw the displacement-time graph of a longitudial wave. On the diagram mark the region of compression and region of rarefaction.
To draw the displacement-time graph of a longitudinal wave and mark the regions of compression and rarefaction, follow these steps:
1. Understand the Characteristics of Longitudinal Waves:
- Longitudinal waves consist of compressions and rarefactions. In a compression, particles are close together, while in a rarefaction, they are spread apart.
2. Set Up the Axes:
- Draw a horizontal axis (x-axis) to represent time (t).
- Draw a vertical axis (y-axis) to represent displacement (y).
3. Draw the Sine Wave:
- The displacement-time graph for a longitudinal wave resembles a sine wave. Start at the origin (0,0).
- As time progresses, the displacement will oscillate above and below the horizontal axis, creating a wave-like pattern.
4. Mark the Regions of Compression and Rarefaction:
- Identify the peaks of the sine wave. These points represent the regions of maximum displacement, which correspond to the regions of rarefaction (where particles are spread apart).
- Identify the troughs of the sine wave. These points represent the regions of minimum displacement, which correspond to the regions of compression (where particles are close together).
- Label the peaks as "Rarefaction" and the troughs as "Compression" on your graph.
5. Final Touches:
- Ensure that the graph is clear and labeled correctly. You may also want to indicate the amplitude of the wave, which is the maximum displacement from the rest position.
- Longitudinal waves consist of compressions and rarefactions. In a compression, particles are close together, while in a rarefaction, they are spread apart.
- Draw a horizontal axis (x-axis) to represent time (t).
- Draw a vertical axis (y-axis) to represent displacement (y).
- The displacement-time graph for a longitudinal wave resembles a sine wave. Start at the origin (0,0).
- As time progresses, the displacement will oscillate above and below the horizontal axis, creating a wave-like pattern.
- Identify the peaks of the sine wave. These points represent the regions of maximum displacement, which correspond to the regions of rarefaction (where particles are spread apart).
- Identify the troughs of the sine wave. These points represent the regions of minimum displacement, which correspond to the regions of compression (where particles are close together).
- Label the peaks as "Rarefaction" and the troughs as "Compression" on your graph.
- Ensure that the graph is clear and labeled correctly. You may also want to indicate the amplitude of the wave, which is the maximum displacement from the rest position.
Topper's Solved these Questions
- BOOK - ICSECHAPTER - WAVESEXERCISE - Superposition Of Waves, Beats, Stationary Waves55videos
WAVES
- BOOK - ICSECHAPTER - WAVESEXERCISE - Doppler Effect, Musical, Sound, Noise26videos
WAVES
- BOOK - ICSECHAPTER - WAVESEXERCISE - Long Answer Questions16videos
WAVES
- BOOK - ICSECHAPTER - VECTORS SCALARS ELEMENTARY CALCULUS EXERCISE - UNSOLVED PROBLEMS79videos
VECTORS SCALARS ELEMENTARY CALCULUS
Similar Questions
Draw the velocity-displacement graph of a body executing shm.
View SolutionDraw displacement-time graph of a wave and show on it the amplitude and time period of wave.
View SolutionDraw a longitudinal wave and mark its compressions and rarefactions.
View SolutionOne compression and one rarefaction makes two waves.
View SolutionThe displacement-time graph of a particle is as shown below. It indicates that
 View Solution
Draw the position-time graph of a stationary object.
View SolutionName the regions marked A,B and C
 View Solution
Draw a displacement-time graph for a boy going to school with a uniform velocity.
View SolutionThe displacement-time graph of a body is shown in.
 .
.
The velocity-time graph of the motion of the body will be .View SolutionDraw areal velocity time graph for Mars.
View Solution

