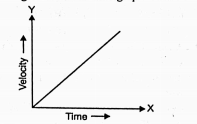
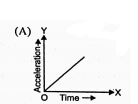
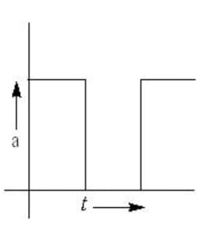
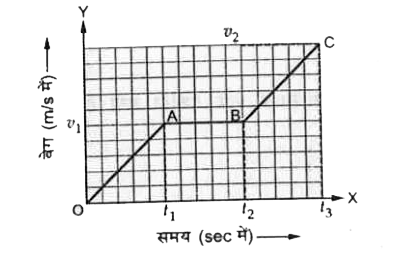
Figure below shows the velocity-time graph of a car moving on a straight road.The corresponding acceleration-=time graph will be:
 .Solution in Punjabi
 .
.
 .
.
 .
.
 .
.
Step by step video & image solution for Figure below shows the velocity-time graph of a car moving on a straight road.The corresponding acceleration-=time graph will be:. by Physics experts to help you in doubts & scoring excellent marks in Class 11 exams.
Updated on:21/07/2023Topper's Solved these Questions
Similar Questions
Is it possible that the velocity of an object be in a direction other than the direction of acceleration?
View SolutionA body is taken from the centre of the earth to the top of the mountain ,how does its weight change?
View SolutionGive one example each of
position depedent force
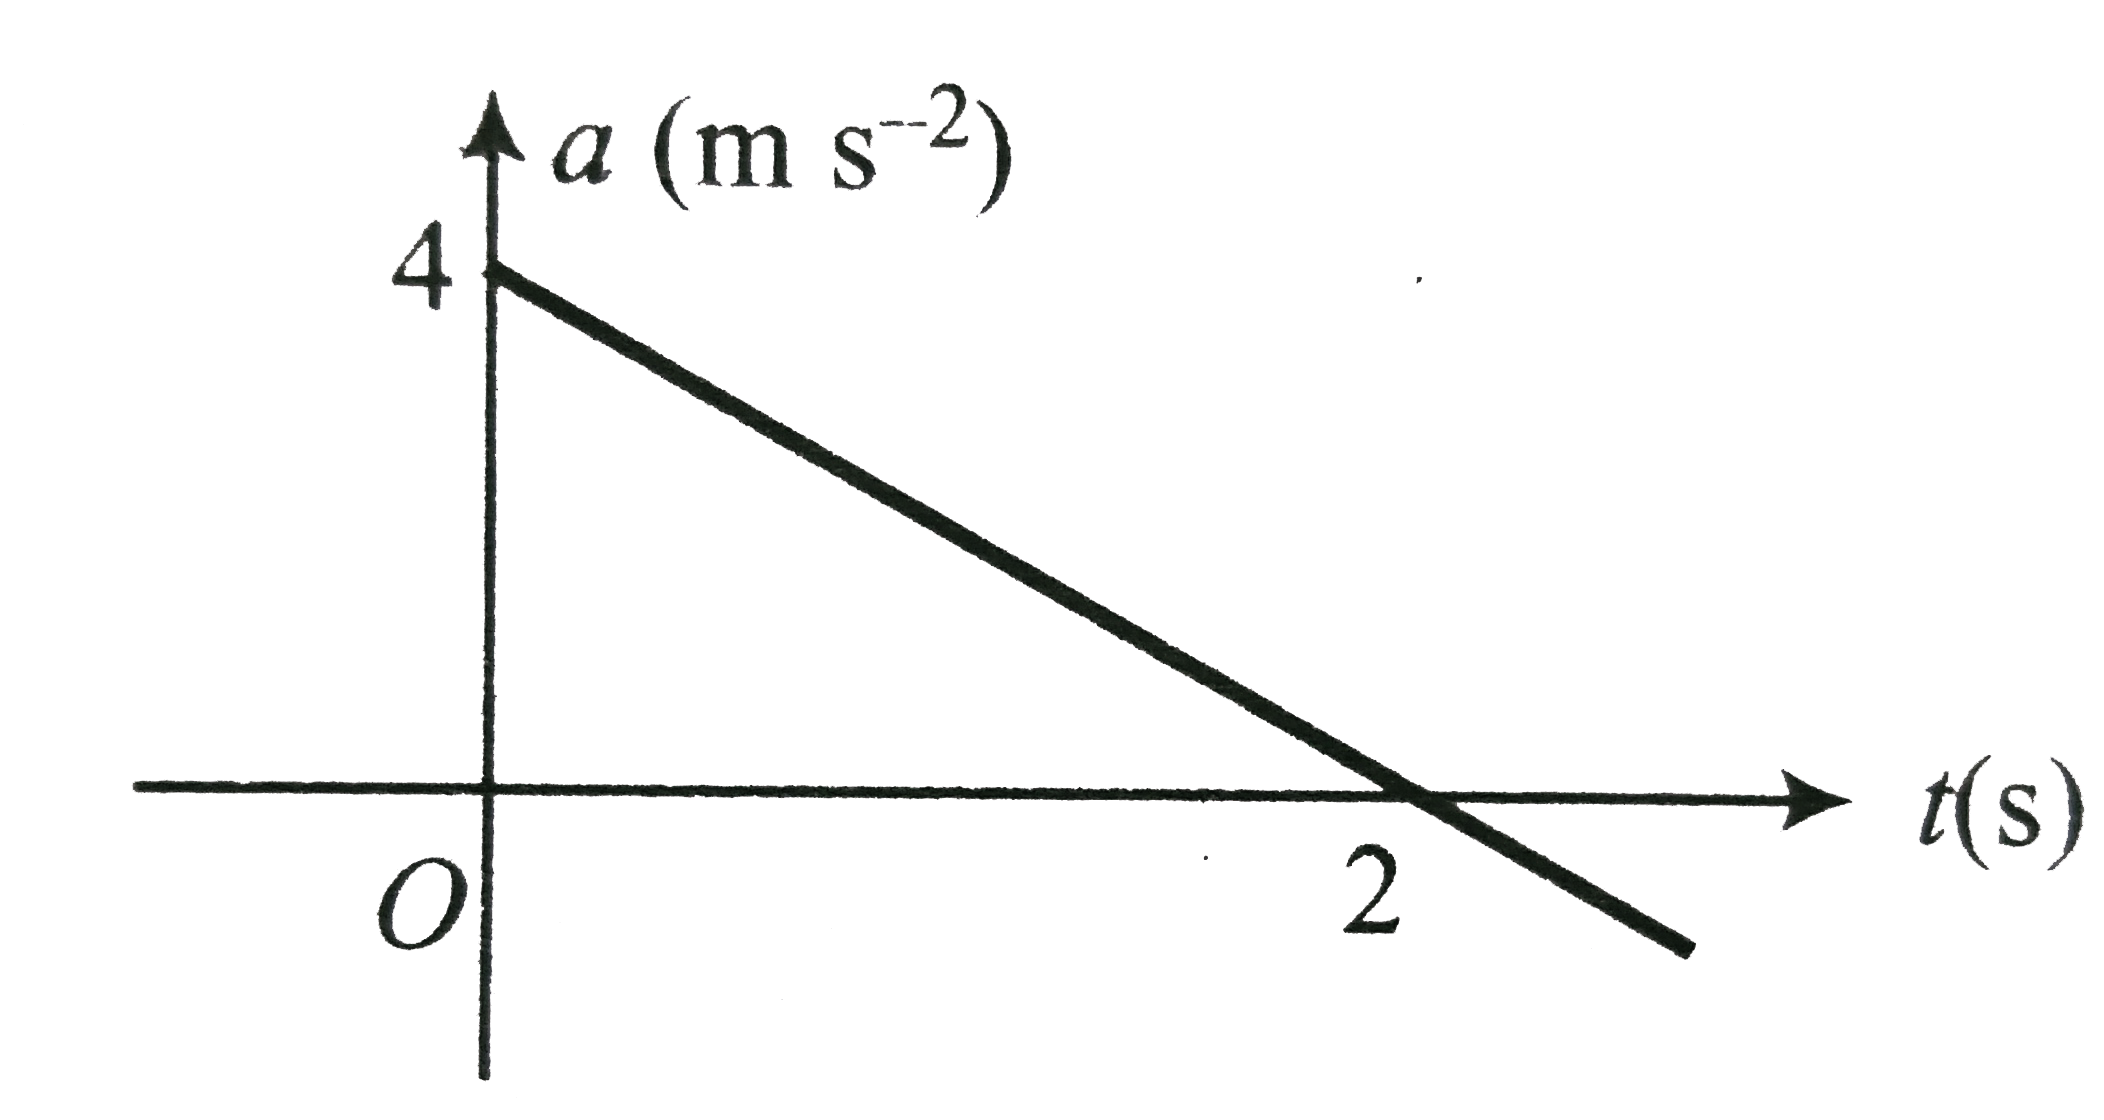
View SolutionThe acceleration versus time graph of a particle moving in a straight line is show in figure. The velocity-time graph of the particle would be
 .
.
View SolutionThe velocity-time graph of a car moving along a straight road is shown in figure. The average velocity of the car is first 25 seconds is
View SolutionThe velocity- time graph of car moving on a straight track is given below. The car weight 1000kg.
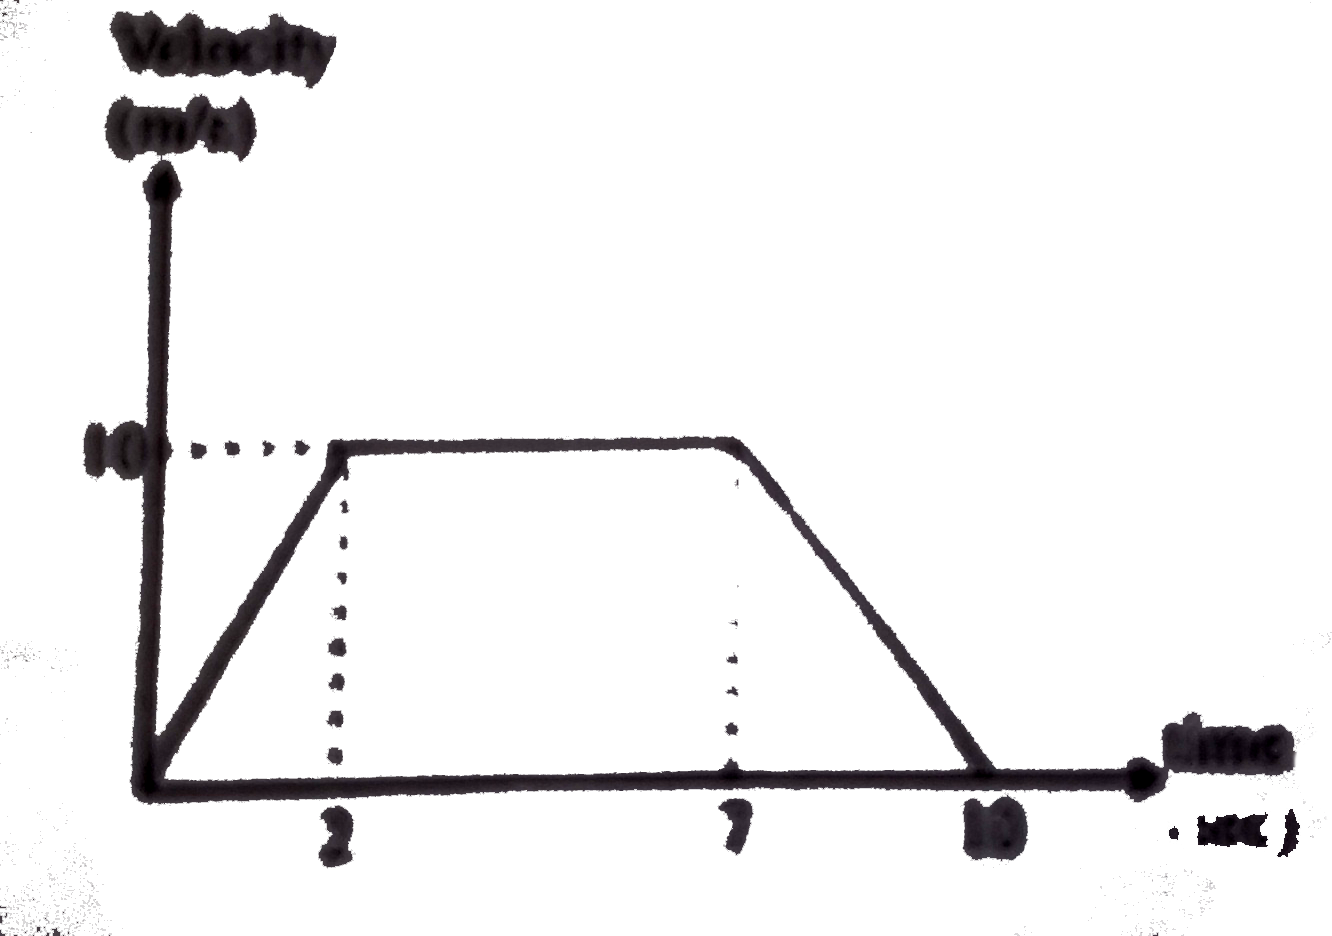 correct acceleration-time graph representing the motion of car is:
View SolutionThe velocity-time graph of a car moving along a straight road is shown in figure. The average velocity of the car in first 25 seconds is
View SolutionAcceleration versus velocity graph of a particle moving in a straight line starting form rest is as shown in figure. The corresponding velocity-time graph would be :
View SolutionFigure shows the acceleration-time graphs of a particle. Which of the following represents the corresponding velocity -time graph?
View Solutionएक सीधी सड़क पर जाती हुई कार के लिए वेग समय ग्राफ दिया गया है। इस दिए गए ग्राफ के संगत त्वरण - समय ग्राफ खींचे।
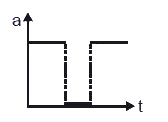
View SolutionFigure shows the acceleration time graph of a particle. Which of the following represents the corresponding velocity-time graph ?
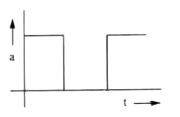
View Solutionकिसी वस्तु के लिये त्वरण-समय ग्राफ चित्र में दिखाया गया है। तो संगत वेग-समय ग्राफ होगा :
View SolutionAcceleration-time graph of a moving object is shown in figure. Draw the velocity- time graph and displacement-time graph corresponding to this type of motion. .
View Solution(a) The figure shows the position time graph of a body moving along a straight line.
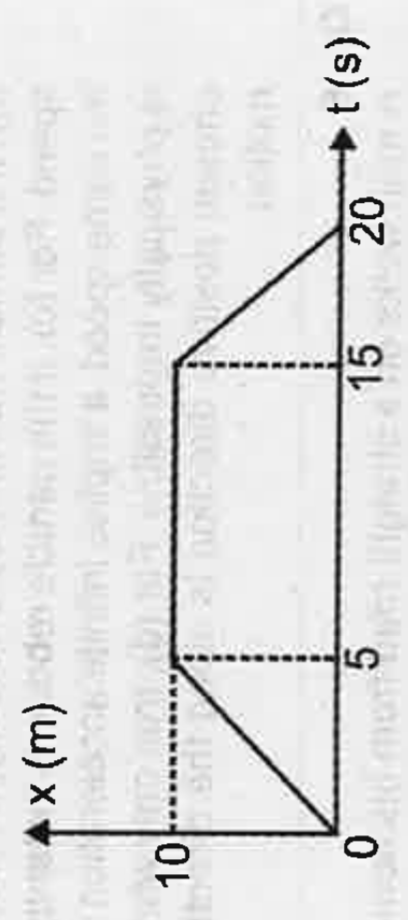
i) Draw the velocity - time graph of the body.
View SolutionThe figure below shows the velocity-time graph of a body moving in a straight line. Find the time interval in which the body is moving with zero acceleration
View SolutionThe acceleration versus time graph of a particle moving in a straight line is show in. The velocity-time graph of the particle would be
 .
.
View Solution
