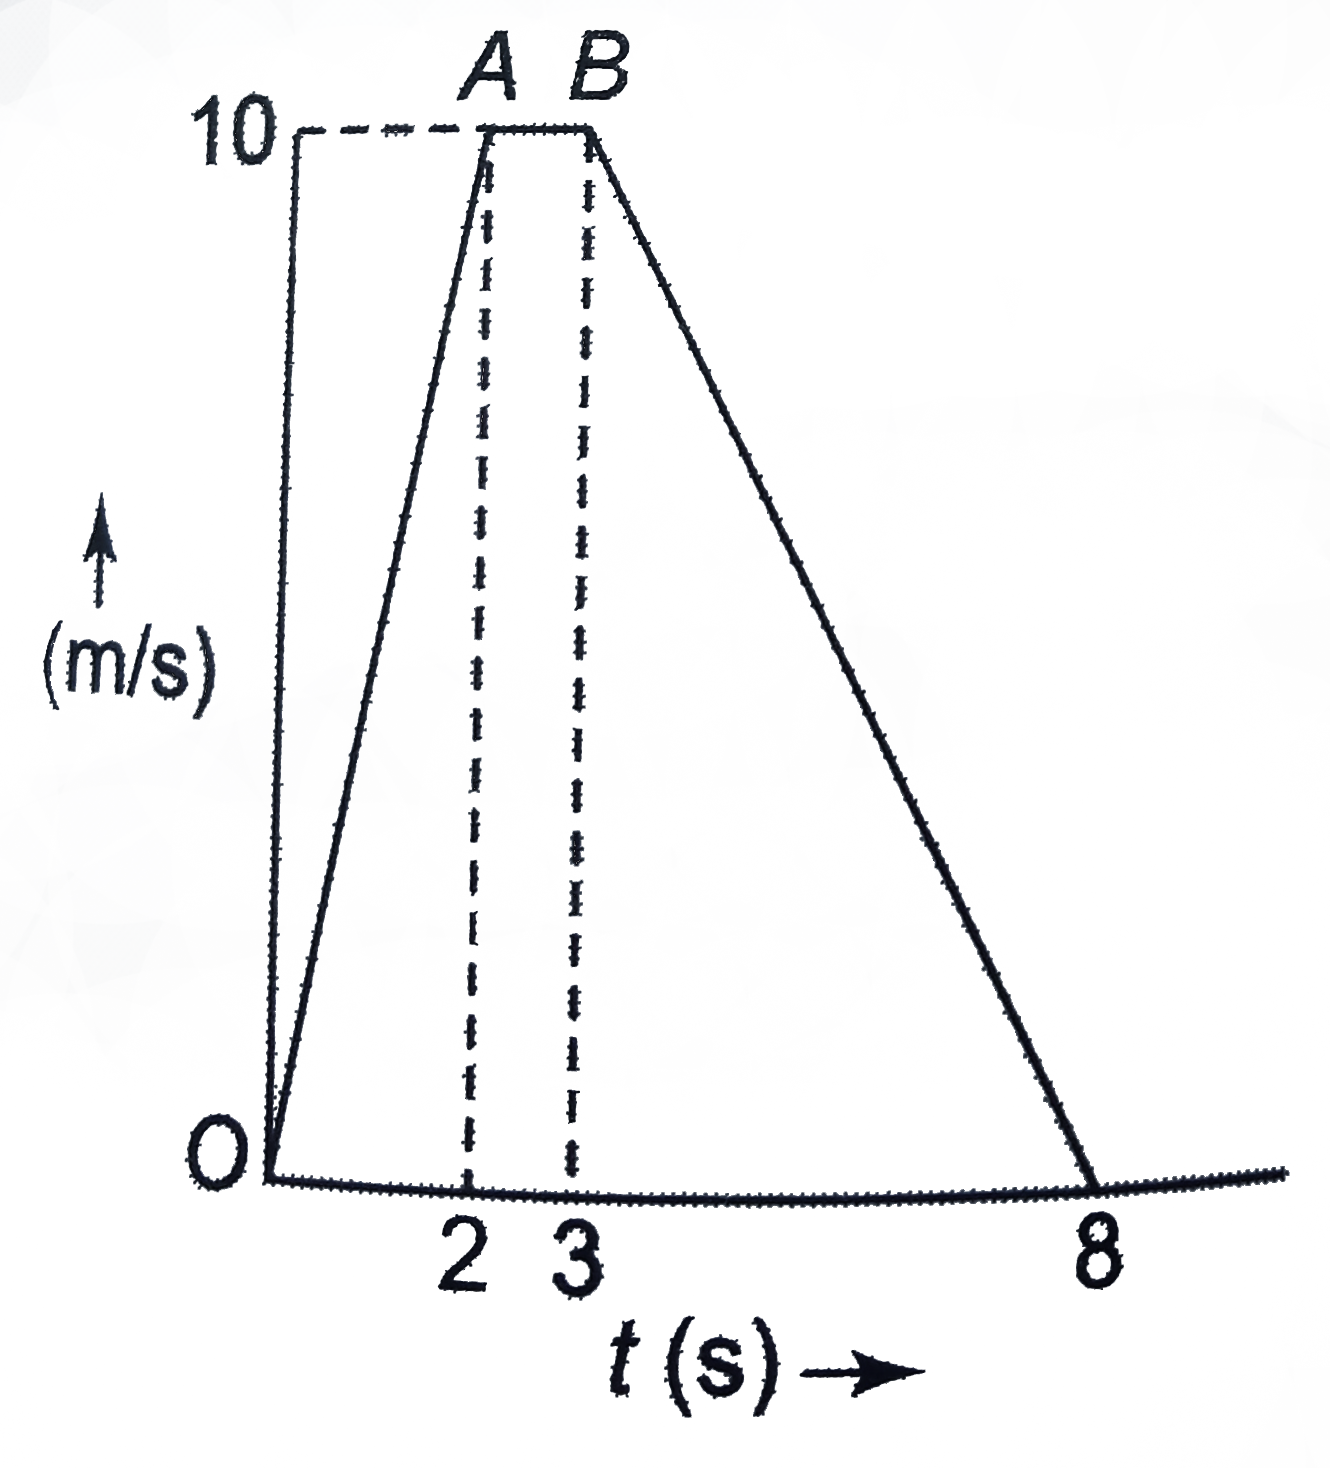
For an object traveling in a straight line, its velocity (v, in m/s) as a function of time (t, in s) is given by the following graph.

Q. Which graph best depicts the object's momentum?


The correct Answer is:A
Momentum in mass times velocity. Since of the object is just a positive constant, the graph of momentum should have the same shape as the graph of the velocity.
Topper's Solved these Questions
Similar Questions
A particle moving along straight line has velocity v=μs where s is in the displacement . If s=s0 then which of the following graph best represent s versus t
View Solution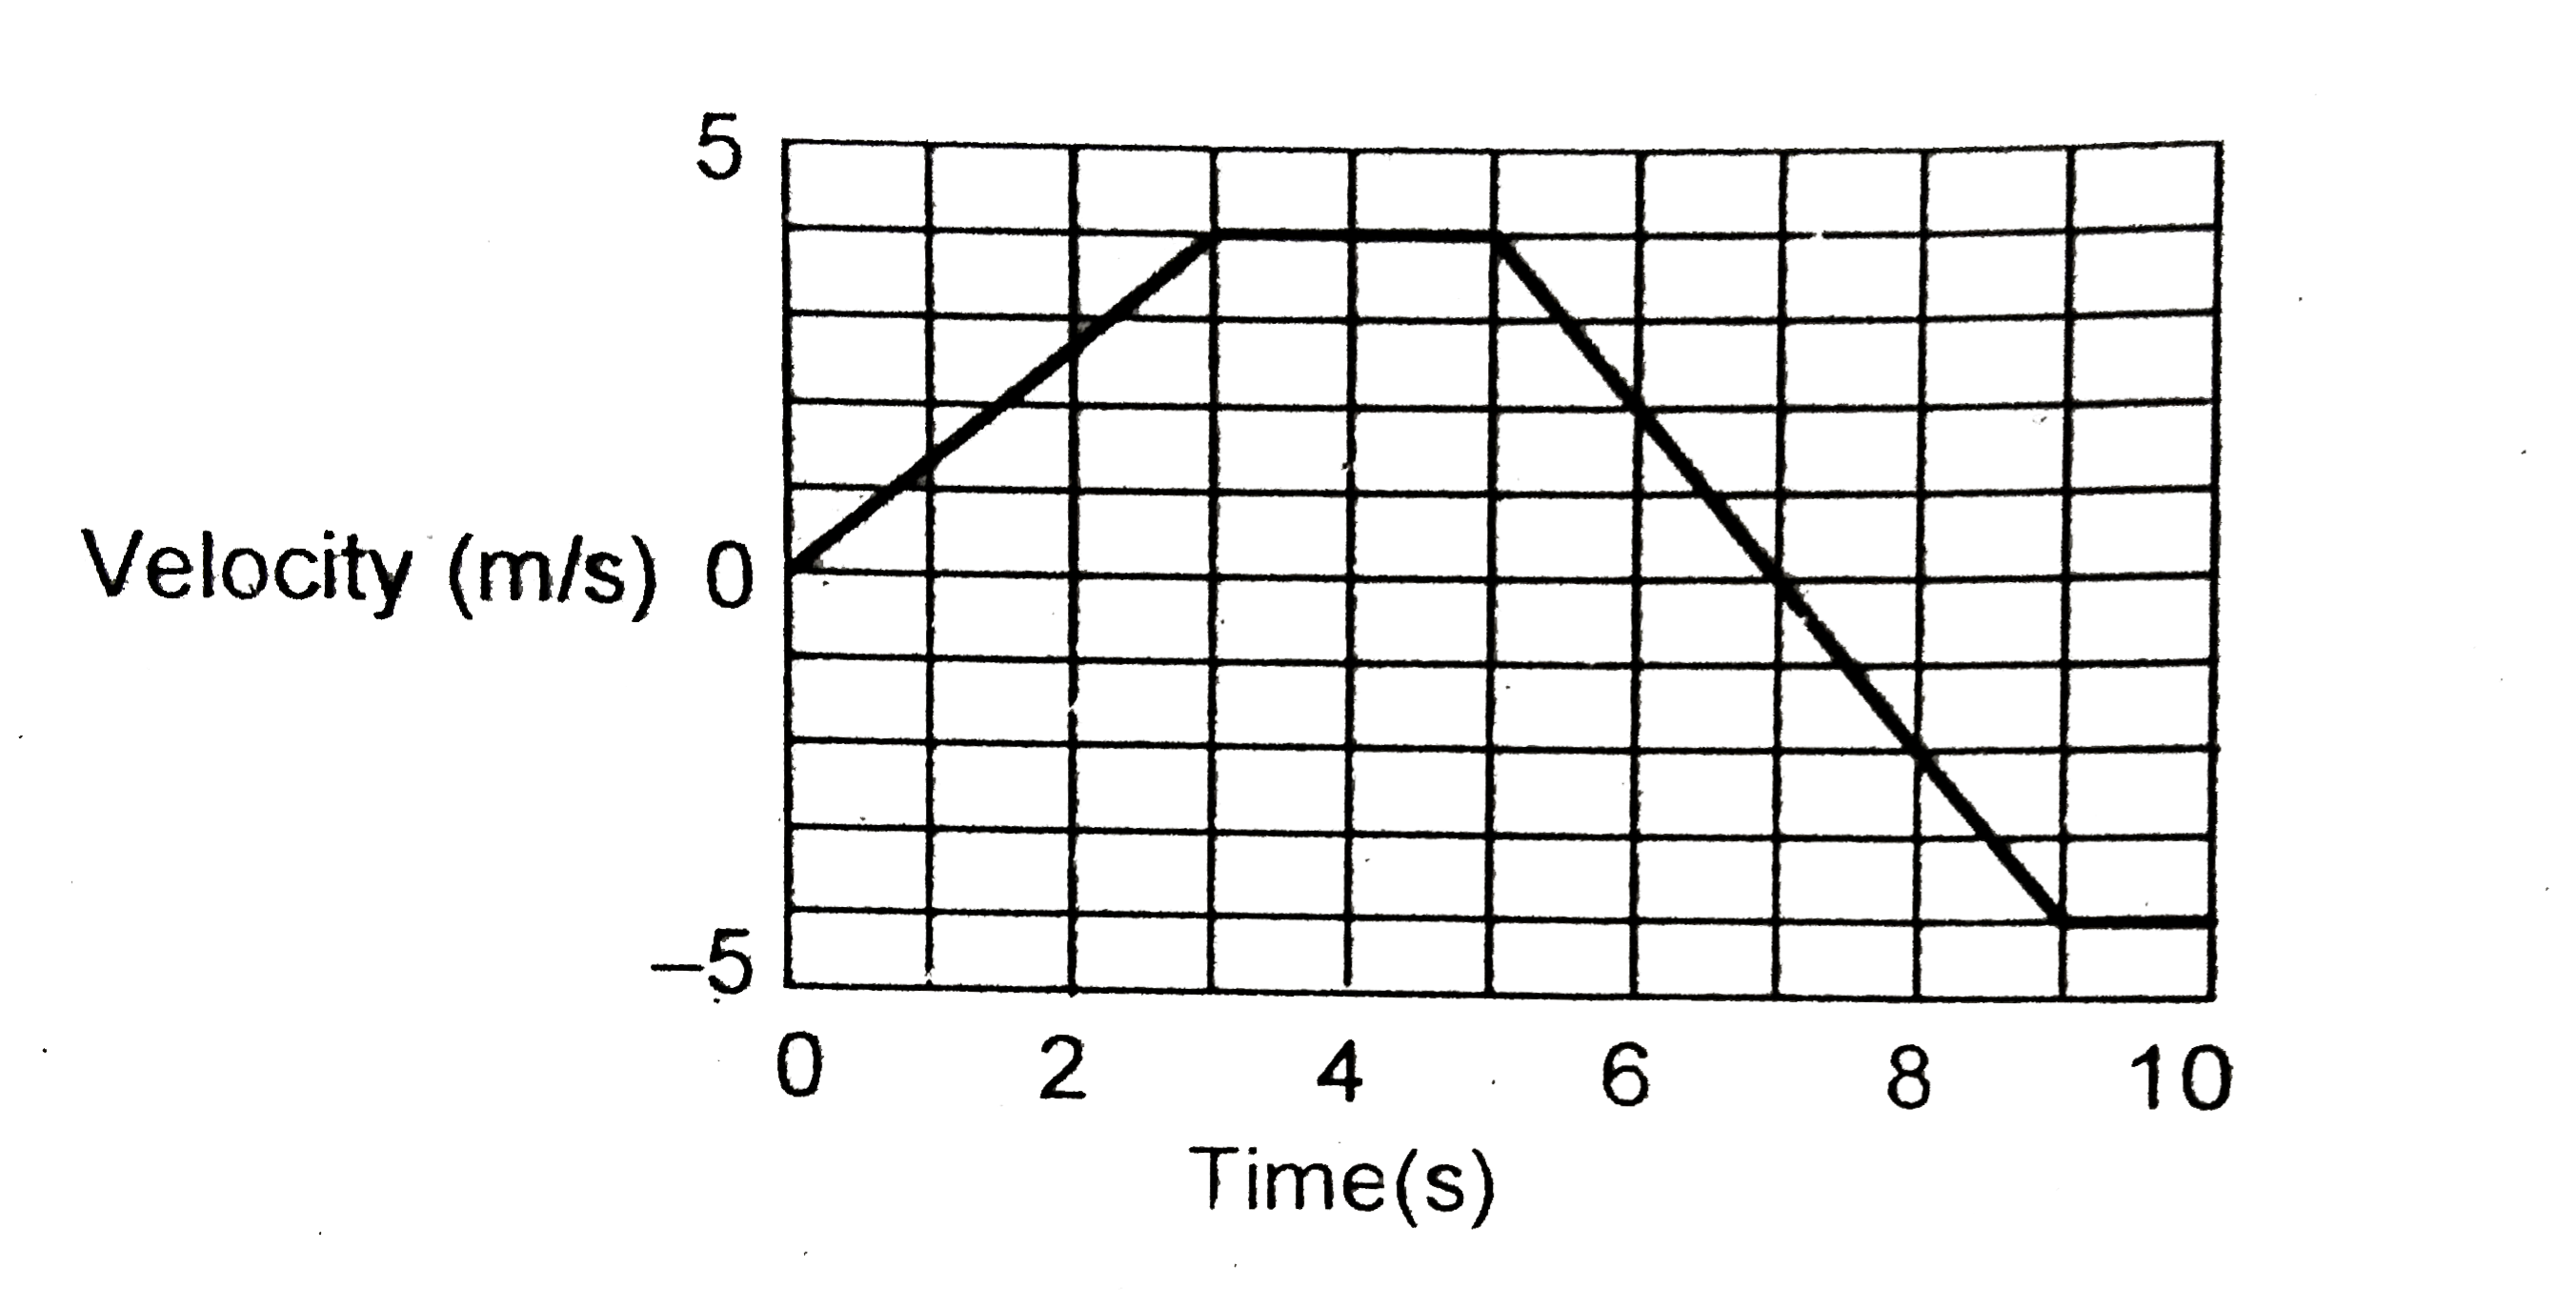
An object starts at the origin in a straight line. Its velocity versus time graph is shown in the figure. Which one of the following choices best gives the proper intervals (s) of time for which the object is moving away from the origin?
View Solution
Knowledge Check

An object starts at the origin in a straight line. Its velocity versus time graph is shown in the figure. Which one of the following choices best gives the proper intervals (s) of time for which the object is moving away from the origin?AOnly for times 0s<t<3sBOnly for times 0s<t<5sConly for times 3s<t<5sDOnly for times 0s<t<7sIf an object travels in a straight line and its velocity increases or decreases by equal amounts in equal intervals of time, then the acceleration of the object is said to be ______________.
AlinearBuniformCtranslationalDnon-uniformIn S.H.M. which one of the following graphs is a straight line ?
AP.E. against displacementBacceleration against timeqCtotal energy against displacementDvelocity against displacement
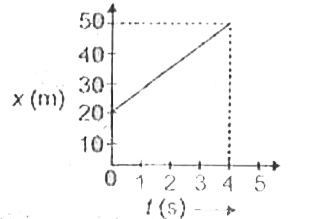
The position - time graph of an object is given below. What is the velocity of the object?
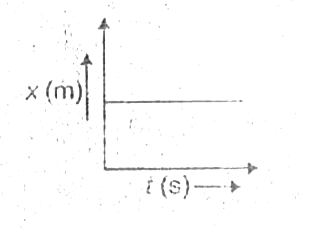
View SolutionThe position - time graph of an object is given below. What is the velocity of the object?
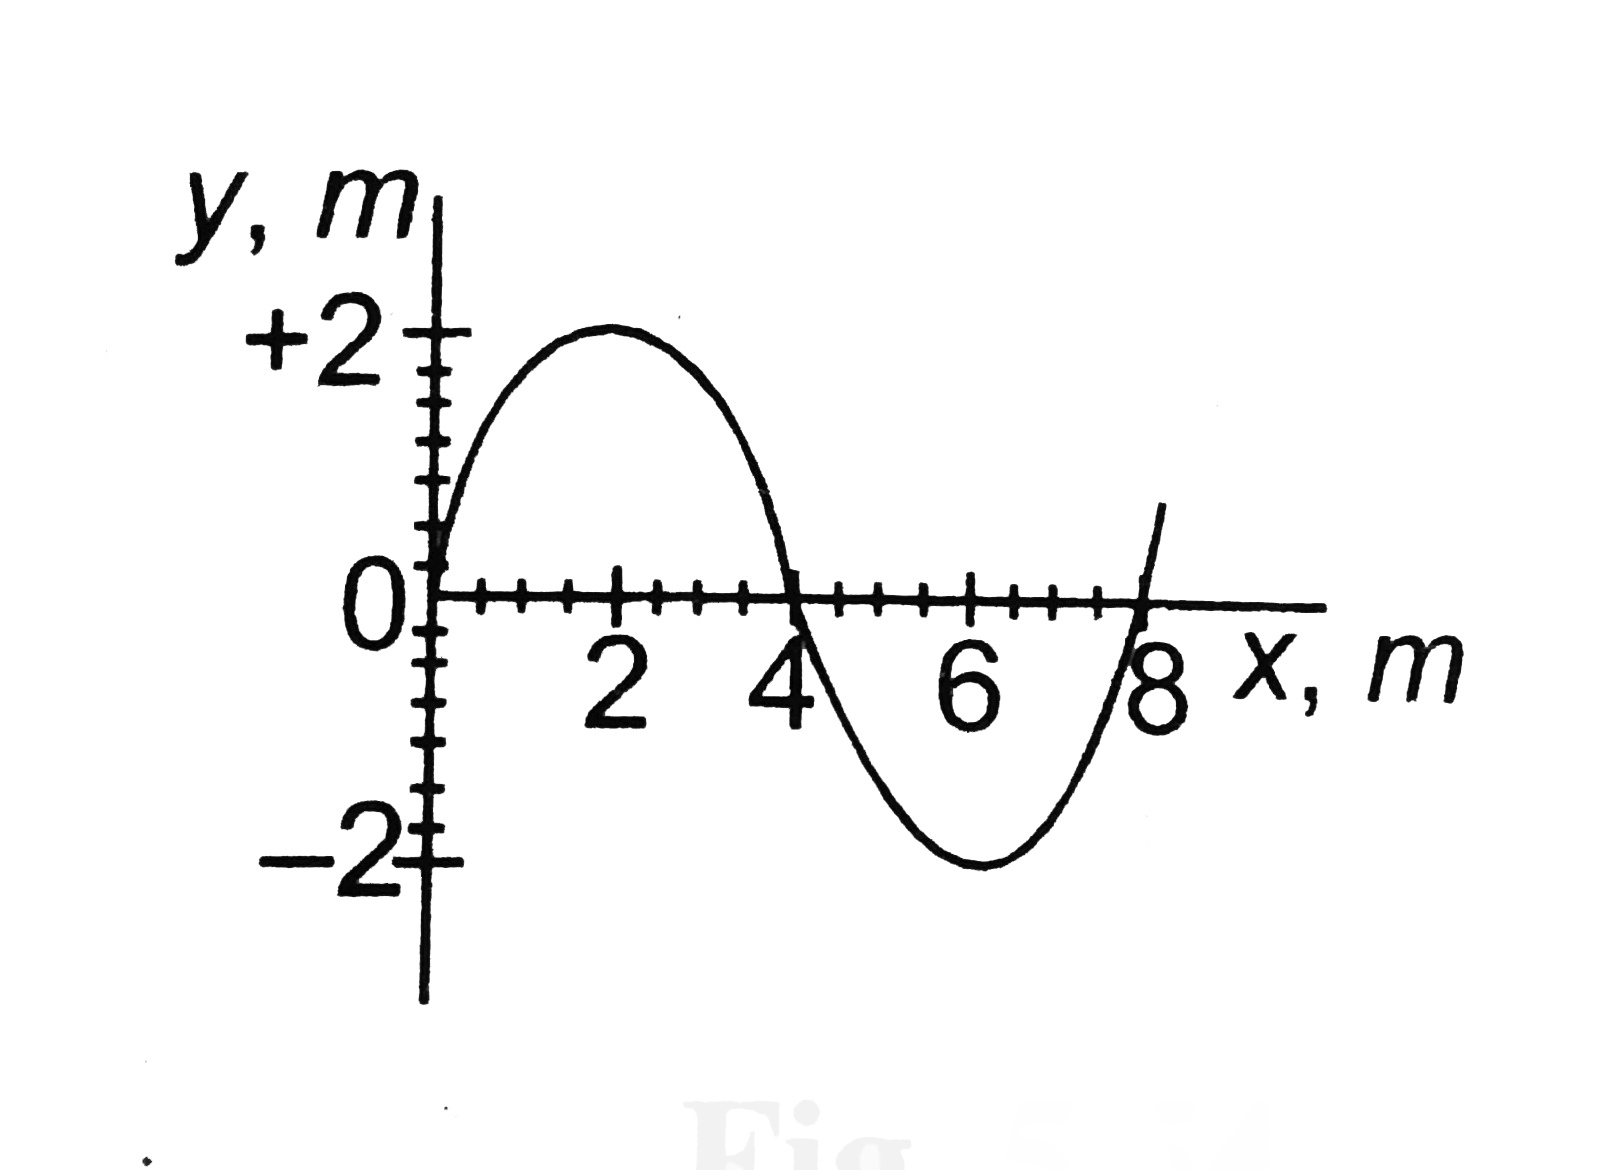
View SolutionThe graph shows a wave at t=0 travelling to the right with a velocity of 4m/s. The equation that best represents the wave is
View SolutionFor a particle moving in a straight line, the velocity-time graph is as shown in the figure. Find the acceleration at time t=1s2.5s and 5s. Sketch the acceleration time graph.
View SolutionThe graph shows a wave at t=0 travelling to the right with a velocity of 4m/s. The equation that best represents the wave is

View Solution
