For an object traveling in a straight line, its velocity (v, in m/s) as a function of time (t, in s) is given by the following graph.

Q. Which graph best illustrates the object's distance from its starting point?


The correct Answer is:D
Since the given graph of v versus t is always above the t-axis, that means v is never negative. From this we can conclude that he object never change direction (because the velocity would change from positive to negative if this were true). If the object is always traveling in the same direction, its distance from the starting point must always increase. this behavior is only illustrated by the graph in (D).
Topper's Solved these Questions
Similar Questions
A person standing on a horizontal floor feels two forces : the downward pull of gravity and the upward supporting force from the floor. These two forces
02:46View SolutionA block of mass m slides with constant speed down a ramp whose incline angle is θ. If F1 is the magnitude of the gravitational force acting parallel to the ramp and F2 is the magnitude of the normal force acting on the block, what is the value of F1/F2?
03:15View SolutionThe velocity-time graph of a particle in straight line motion is veloity-time graph of a particle in straight line motion is shown in. The particle starts its motion from origin. . The distance of the particle from the origin after 8 s is .
02:33View SolutionAn object starts at the origin in a straight line. Its velocity versus time graph is shown in the figure. Which one of the following choices best gives the proper intervals (s) of time for which the object is moving away from the origin?
02:43View SolutionThe graph shown the variation with times t of the velocity v of an object . Which one of the following graphs best represents the variation of acceleration a of the object with time t ?
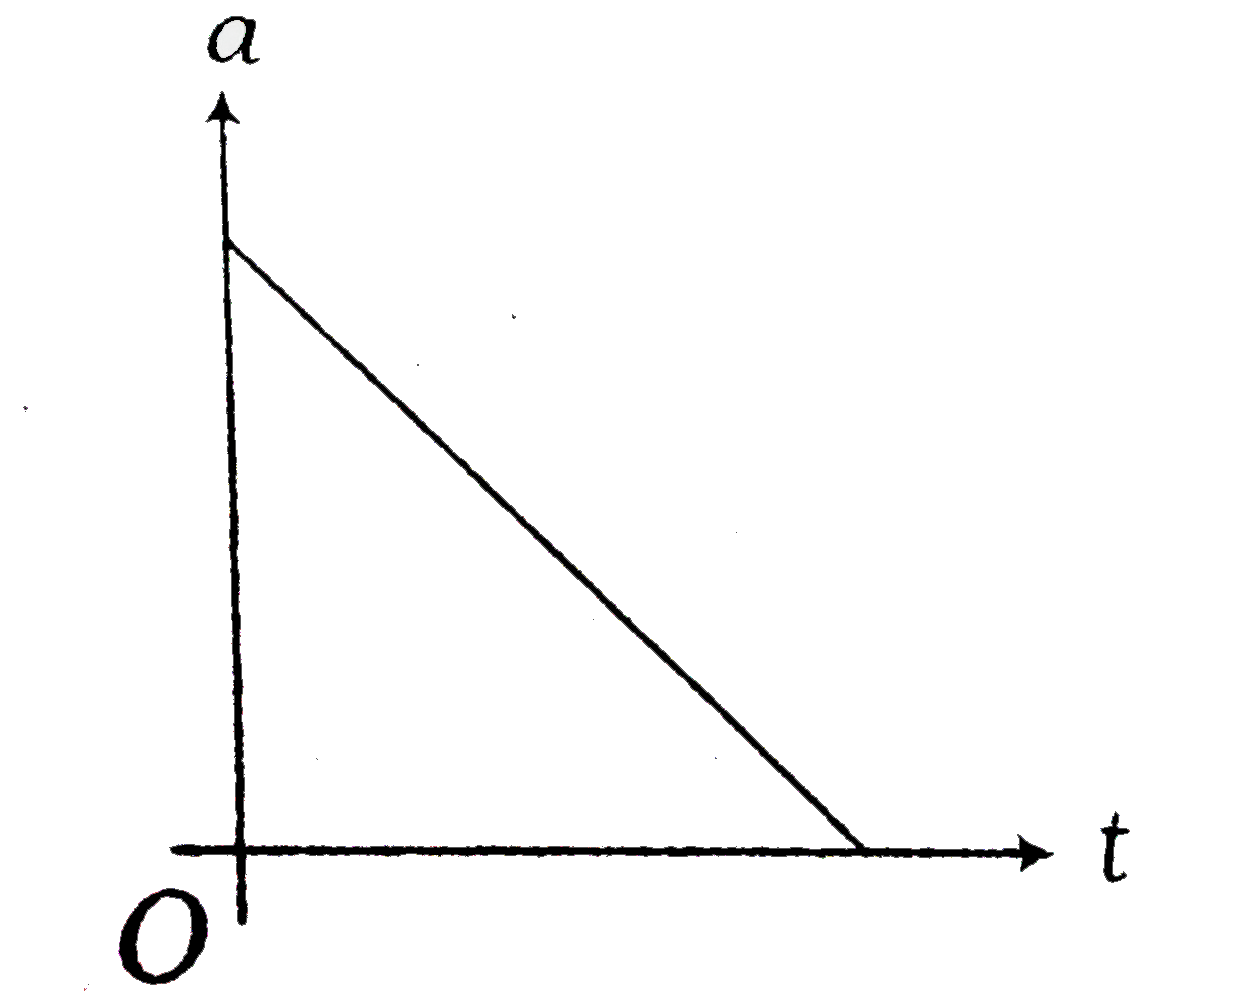
03:07View SolutionThe acceleration (a)-time(t) graph for a particle moving along a straight from rest is shown in figur. Which of the following graph is the best representation of its velocity (v) with time (t) ?
 06:41View Solution
एक वस्तु एक सरल रेखा में एकसमान त्वरण से चल रही है । इसका वेग-समय ग्राफ होगा :
02:27View SolutionA particle starting from rest moves in a straight line with acceleration as shown in the a-t graph. Find the distance (in m) travelled by the particle in the first four seconds from start of its motion. Q
09:01View SolutionAn object is moving along a straight line in the positive x direction. The graph shows its position from the starting point as a function of time. Various segments of the graph are identified by the letters A, B, C, and D. Which segment(s) of the graph represent(s) a constant velocity of +1.0 m/s ?
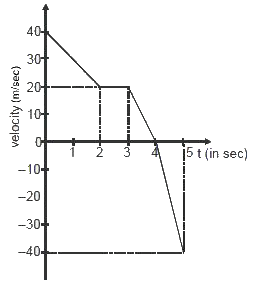
06:17View Solutionकिसी वस्तु के लिये दर्शाए गये वेग-समय ग्रॉफ से 5 s में वस्तु द्वारा तय की गई दूरी तथा इसका विस्थापन मीटर में होगा : -
 02:45View Solution
4 sets of graphs one given. Each set consists of a displacement-time(s-t), velocity-time(v-t) & acceleration time (a-t) graph. Which set correctly illustrates all 3 graphs.
03:34View SolutionThe acceleration (a)-time(t) graph for a particle moving along a straight from rest is shown in figur. Which of the following graph is the best representation of its velocity (v) with time (t) ?
 02:21View Solution
The velocity-time graph of a particle in straight line motion is velocity-time graph of a particle in straight line motion is shown in. The particle starts its motion from origin. . The distance of the particle from the origin after 8 s is .
03:52View SolutionThe acceleration (a)-time(t) graph for a particle moving along a straight from rest is shown in figure. Which of the following graph is the best representation of its velocity (v) with time (t) ?
 03:26View Solution
The graph shown the variation with times t of the velocity v of an object . Which one of the following graphs best represents the variation of acceleration a of the object with time t ?
01:39View SolutionThe graph shown the variation with times t of the velocity v of an object . Which one of the following graphs best represents the variation of acceleration a of the object with time t ?
02:39View Solution

