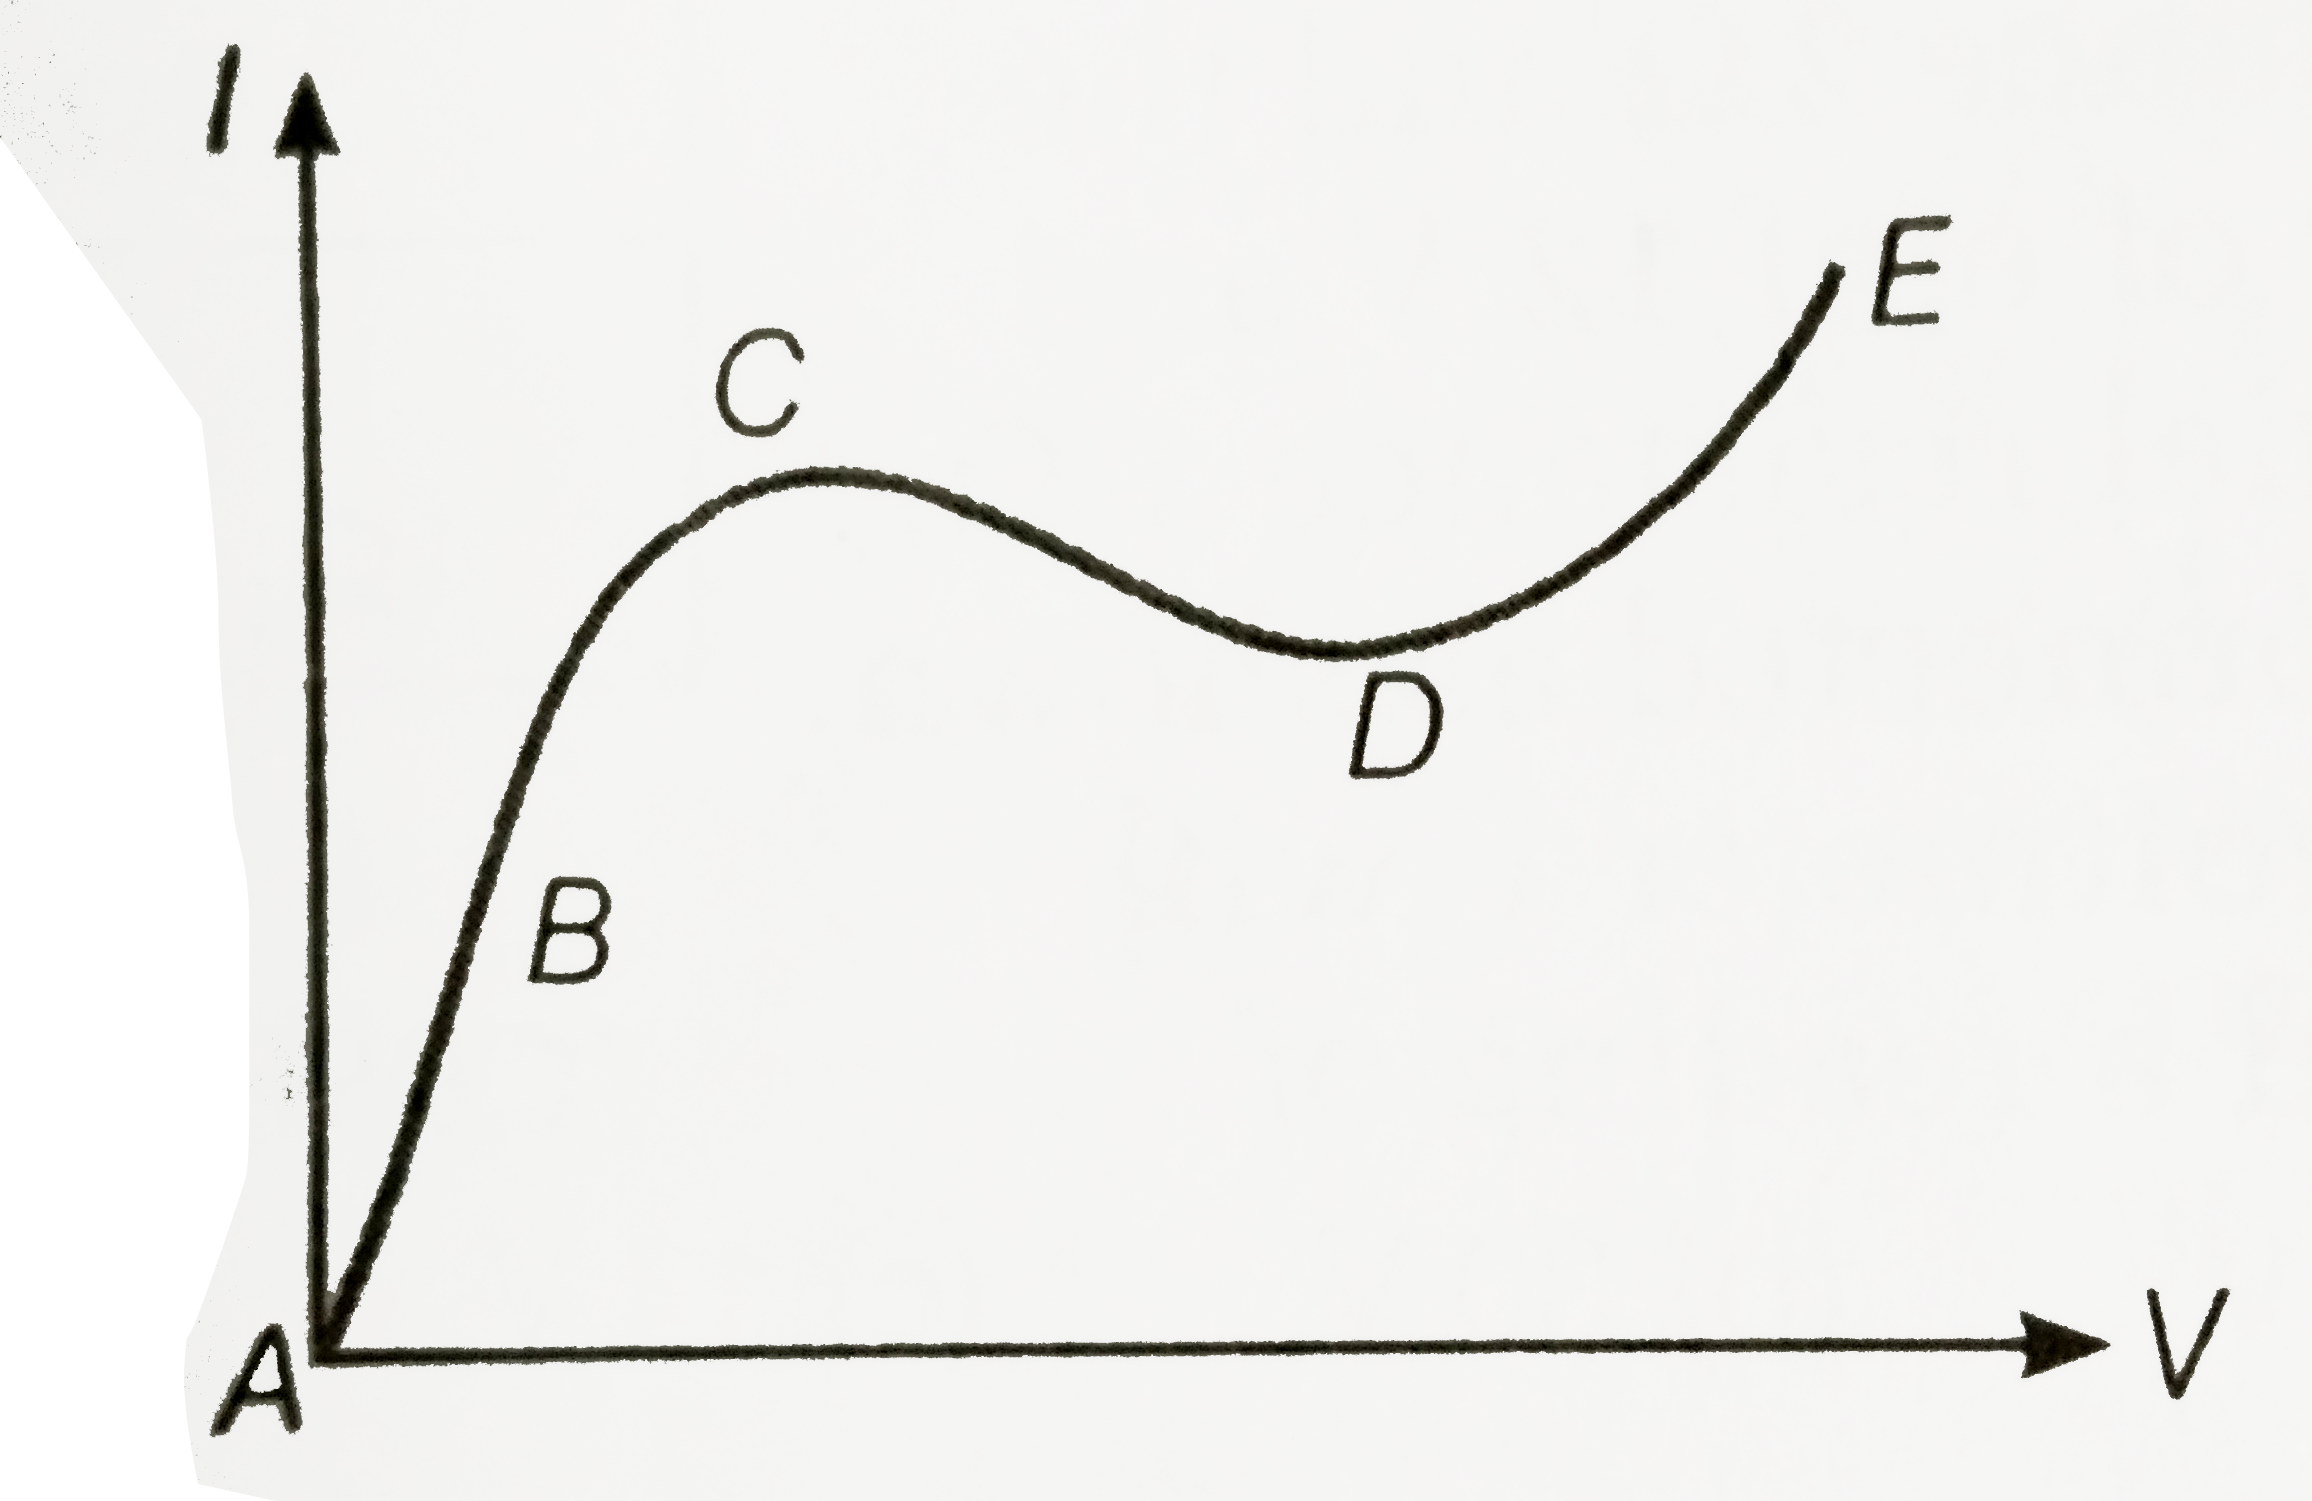
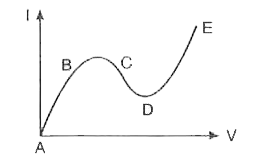
From the graph between current (I) and voltage (V) as shown in the figure, identify the portion correspoindgin to negative resistance
 Solution in Punjabi
AB
BC
CD
DE
Step by step video & image solution for From the graph between current (I) and voltage (V) as shown in the figure, identify the portion correspoindgin to negative resistance by Physics experts to help you in doubts & scoring excellent marks in Class 12 exams.
Topper's Solved these Questions
Similar Questions
For current entering at A, the electric field E(r at a distance r form A
02:39View SolutionDefine atomic number.
01:14View SolutionA charge q is placed at the centre of line joining two equal charges Q. Show that the system of three charges will be in equilibrium if q = -Q/4
03:00View SolutionThe current-voltage graph of a device is shown in figure. The resistance is negative in region.
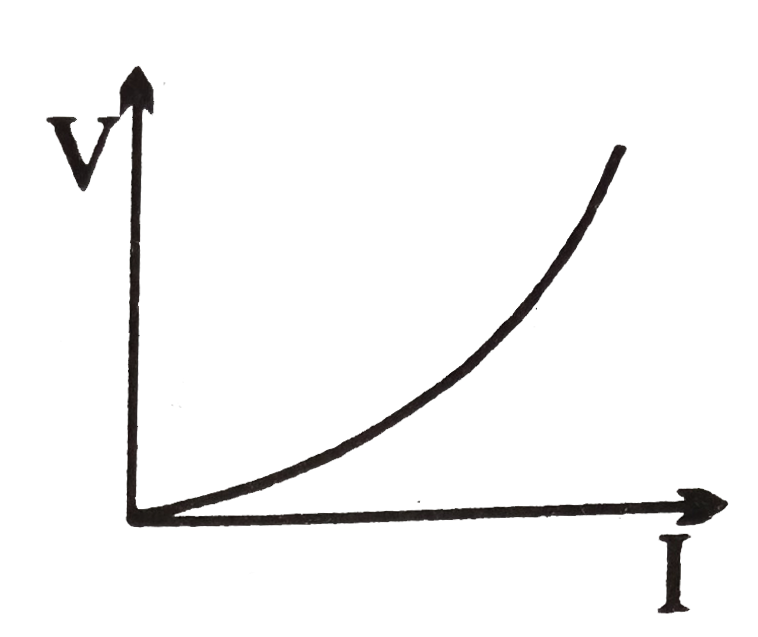
02:28View SolutionThe variation of current (I) and voltage (V) is as shown in figure A. The variation of power P with current I is best shown by which of the following graph
 View Solution
Graph showing the variation of current versus voltage for a material GaAs is shown in figure. Identify the region of (i) negative resistance (ii) where Ohm's law is obeyed.
07:25View SolutionFrom the given between current I and voltage V shown in figure , indentify the portion corresponding to negative resistance
 03:46View Solution
From the graph between current I and voltage V shown below, identify the portion corresponding to negative resistanc
03:49View Solution(a) Draw graph showing the variation of current versus voltage in an electroyte when an external resistance is also connceted.
(b) (i) The graph between resistance (R ) and temperature (T) for Hg is shown in the figure (a). Explain the behaviour of Hg near 4k.
(ii) In which region of the graph shown in the figure (b) is the resistance negative and why?
 03:00View Solution
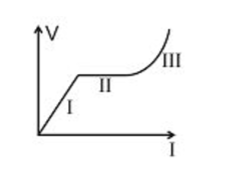
Voltage V v/s I graph is shown in the figure.
 02:07View Solution
दिया गया आरेख किसी अर्धचालक के लिए विघुत धारा तथा वोलटता के बीच ग्राफ को दर्शाता है| उस क्षेत्र की (यदि पहचान कीजिए जिसमे इस अर्धचालक का प्रतिरोध ऋणात्मक है|
 03:42View Solution
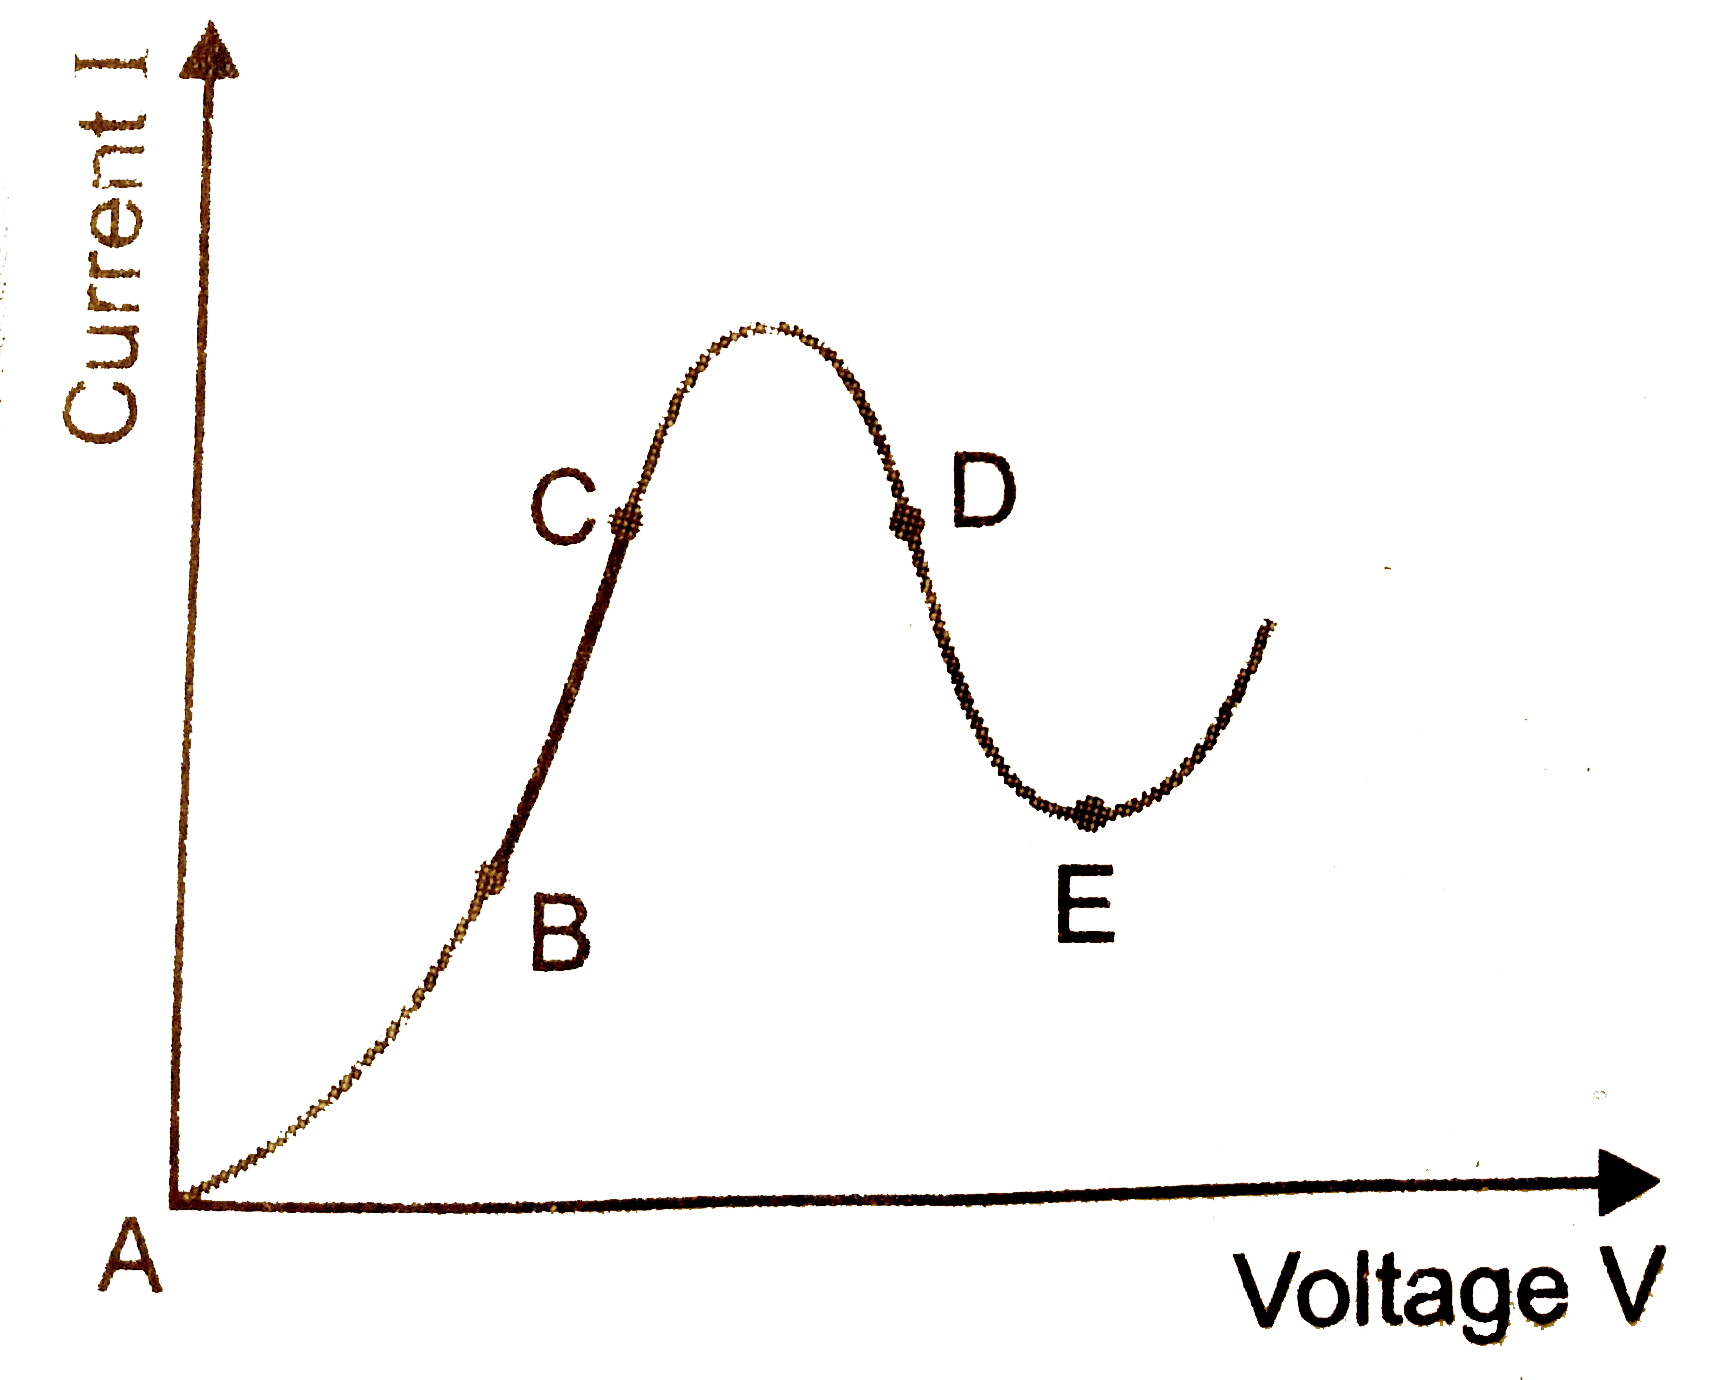
Graph showing the variation of current versus voltage for a material GaAs is shown in figure. Identify the region of (i) negative resistance (ii) where Ohm's law is obeyed.
 02:08View Solution
चित्र II.1 में दिखाए गये धारा I और वोल्टता V के बीच ग्राफ में ऋणात्मक प्रतिरोध वाला भाग पहचानें
 04:54View Solution
Graph shown in figure is the relation between photo current (i) versus incident voltage (V). Maximum energy of electron emitted will be …
 01:48View Solution
The graph shown in the figure represents a plot of current versus voltage for a given semi-conductor. Identify the region, if any, over which the semicondutor has a negative resistance.
03:33View Solution(a) Draw graph showing the variation of current versus voltage in an electroyte when an external resistance is also connceted.
(b) (i) The graph between resistance (R ) and temperature (T) for Hg is shown in the figure (a). Explain the behaviour of Hg near 4k.
(ii) In which region of the graph shown in the figure (b) is the resistance negative and why?
 02:12View Solution

