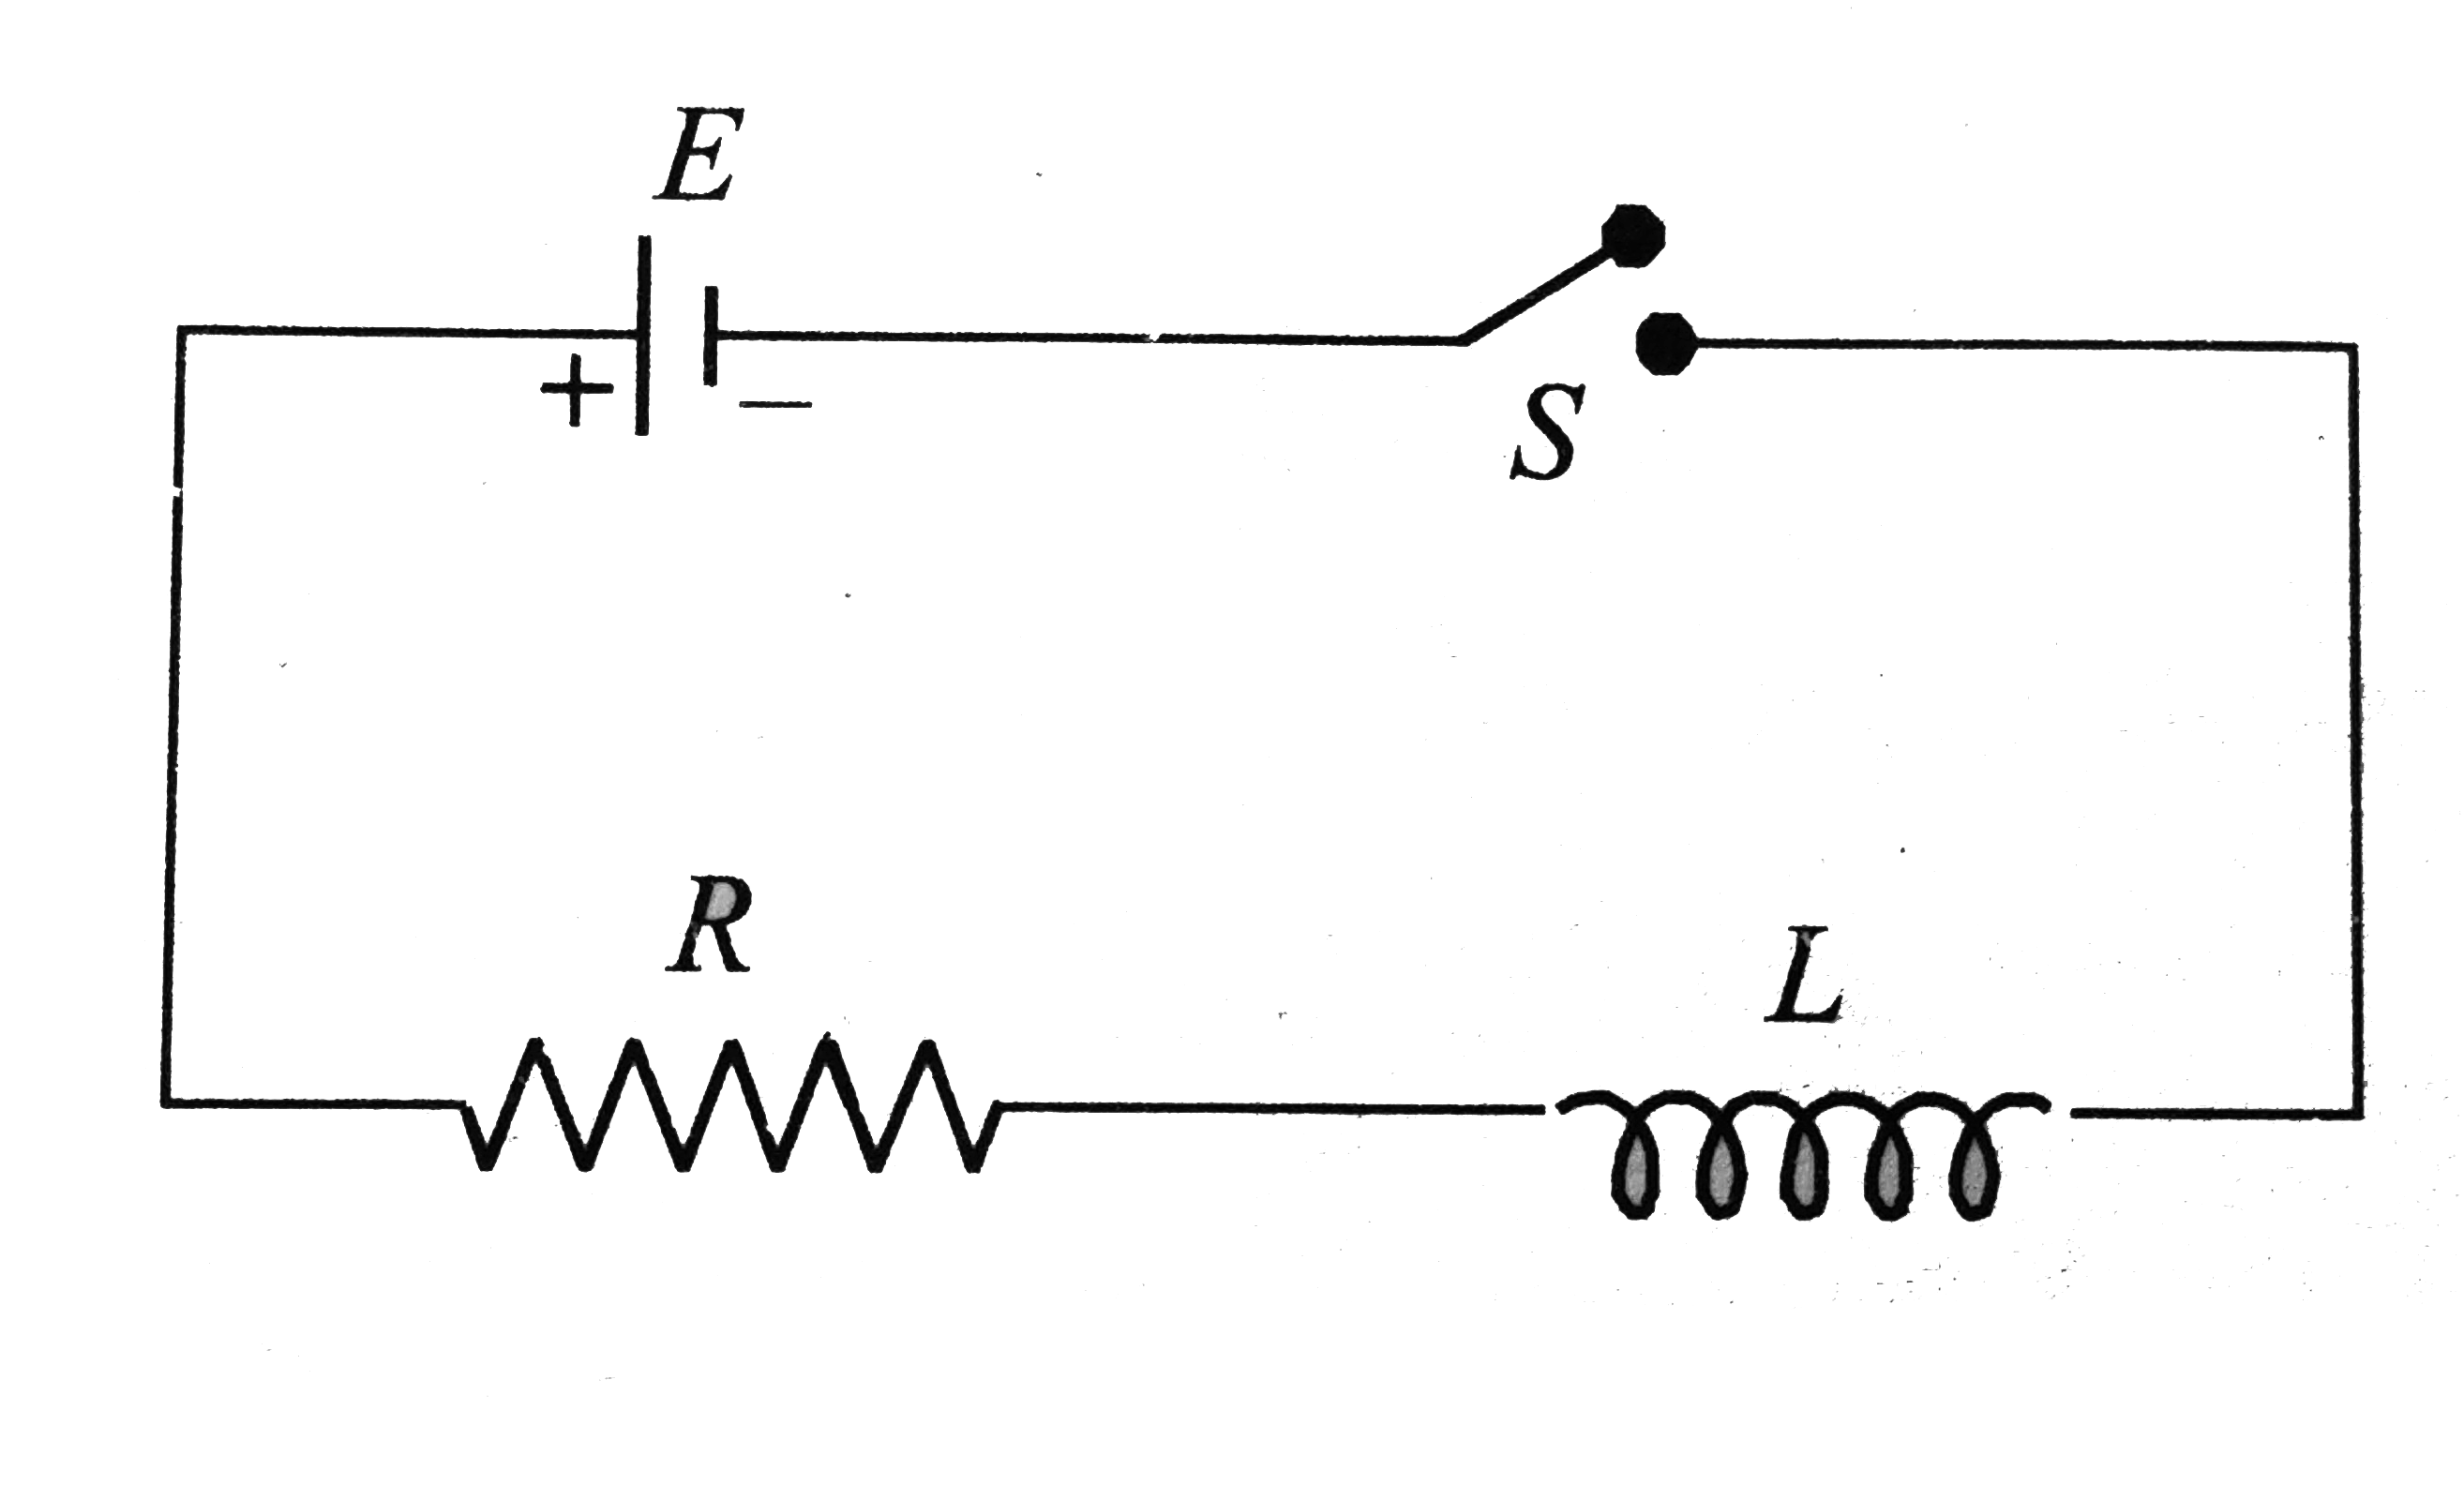
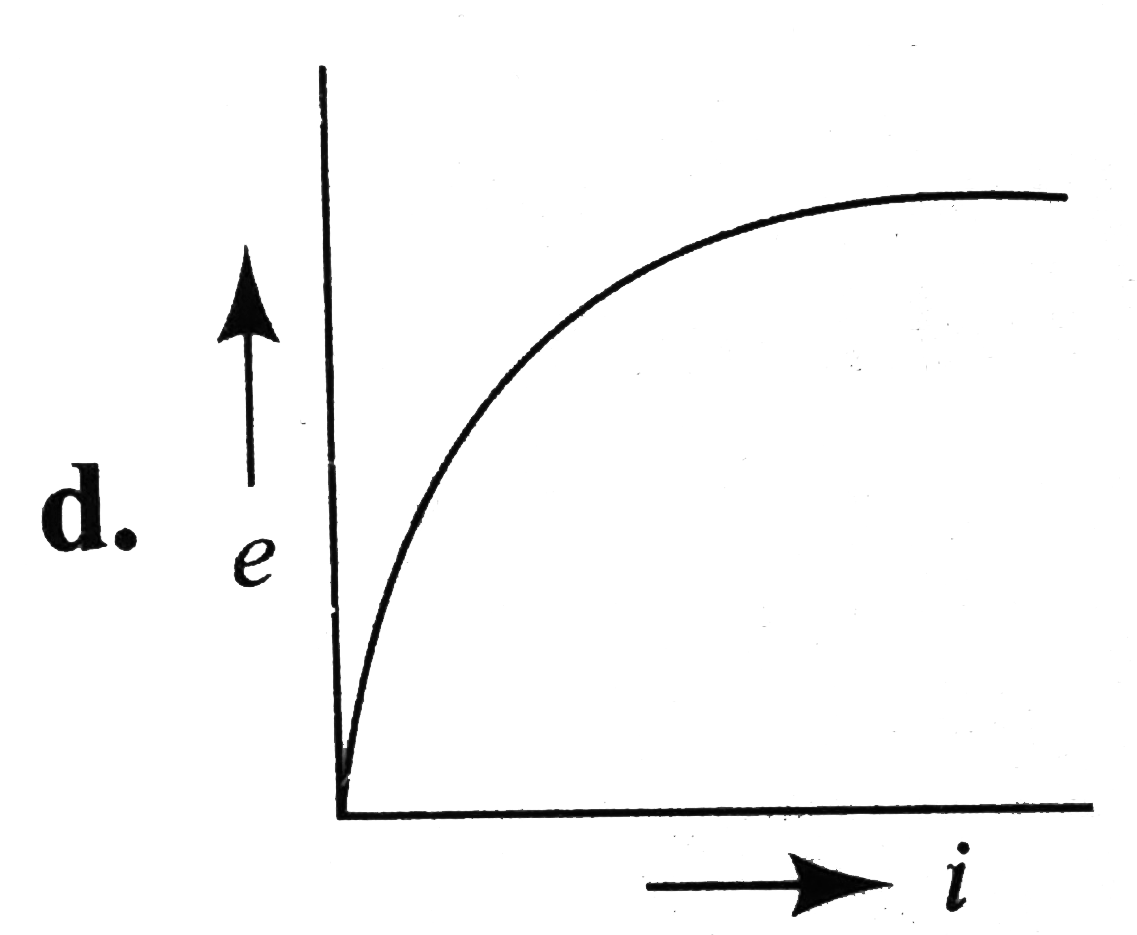
Switch S of the circuit shows in Fig. is closed at t=0. If e denotes the induced emf in L and i the current flowing through the circuit at time t, then which of the following graphs correctly represents the variation of e with i?
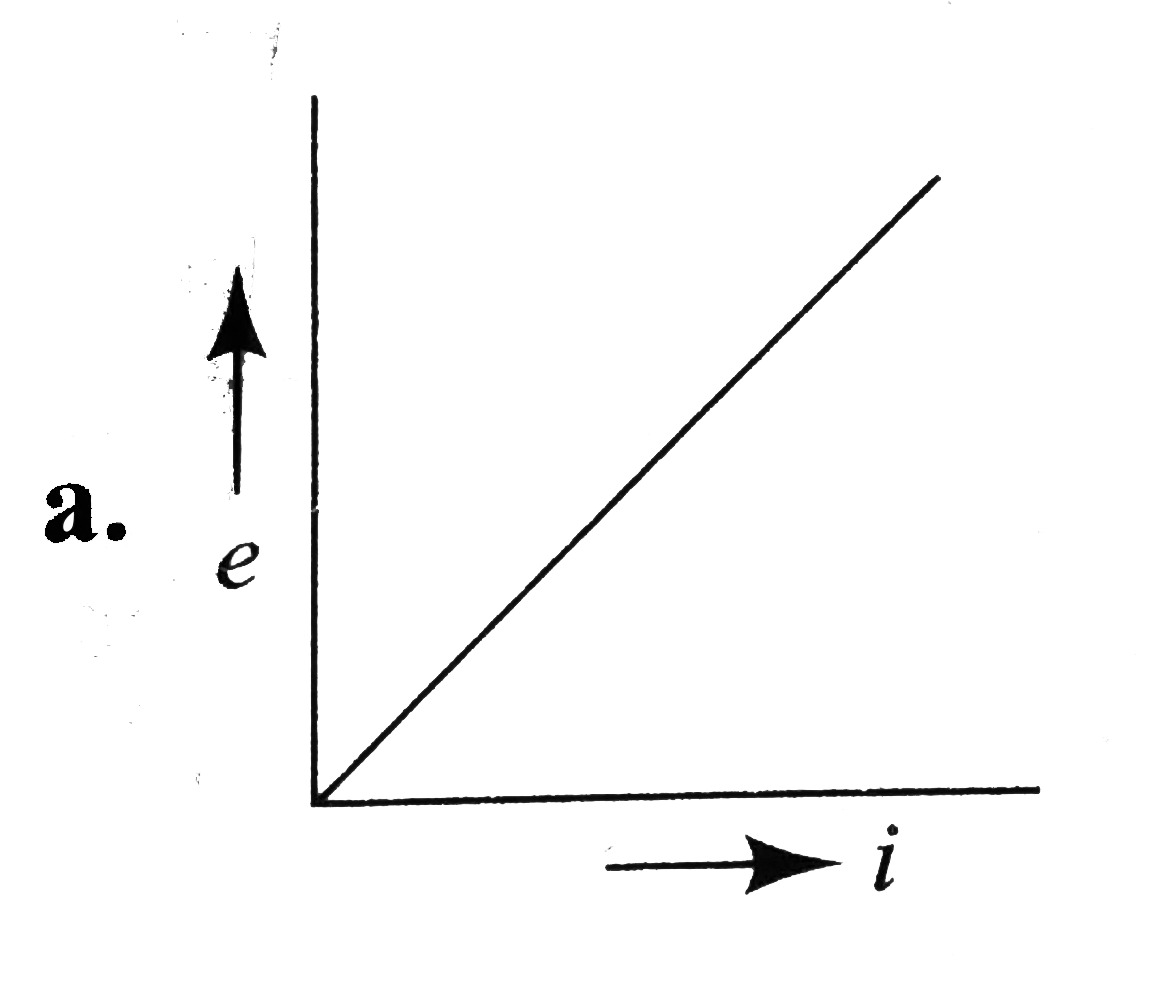
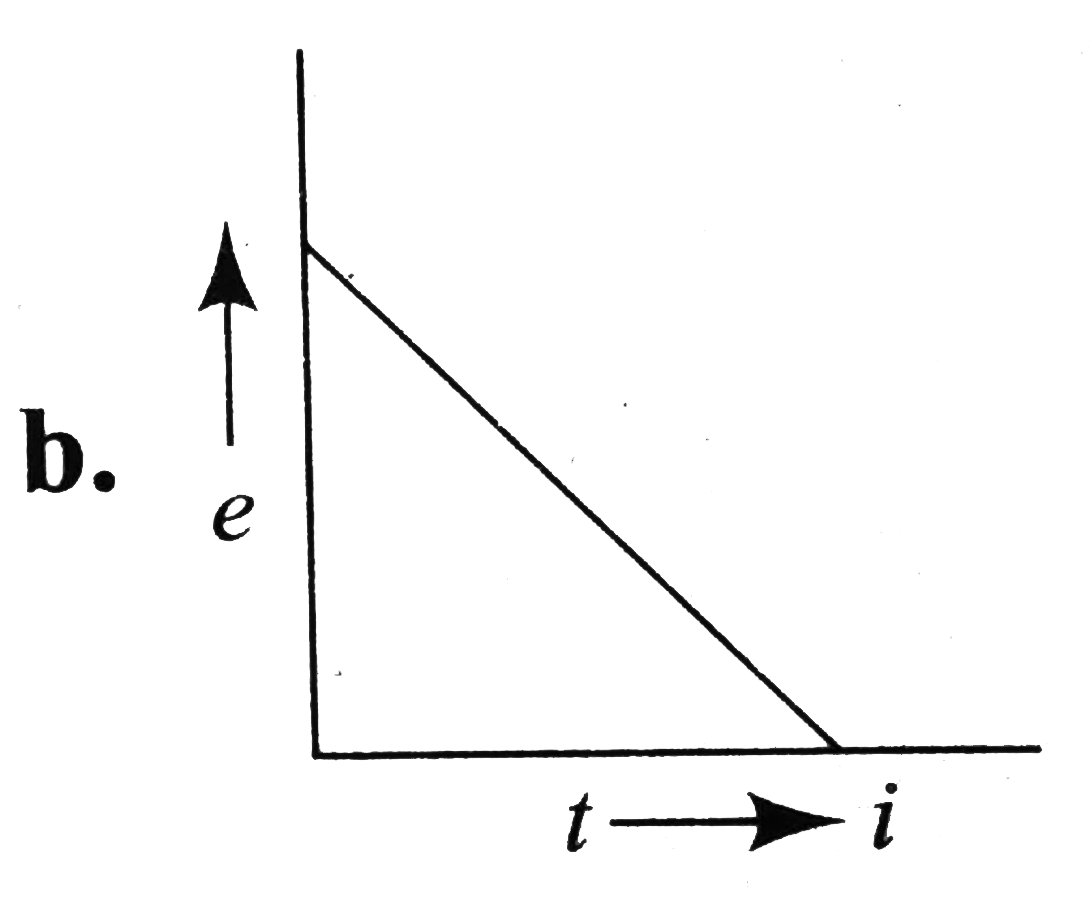
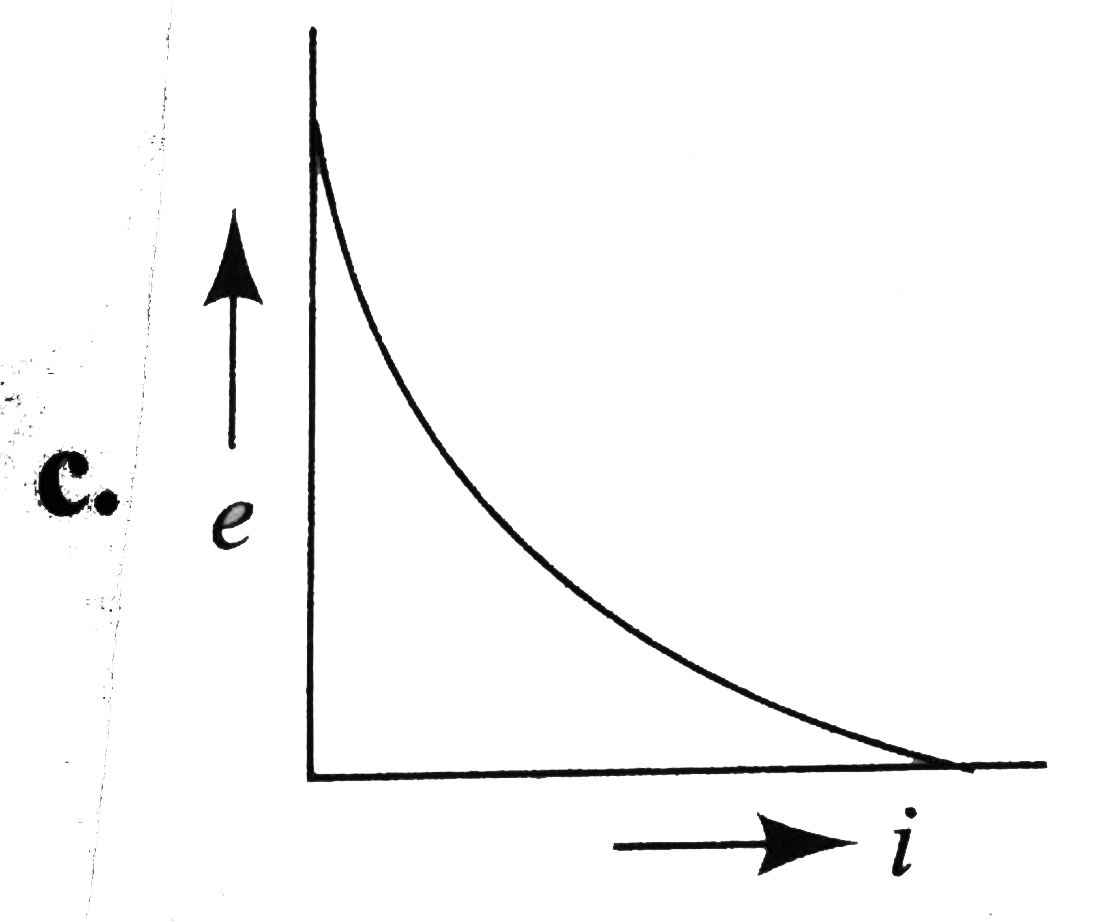
The correct Answer is:B
e=E−iR
Clearly, the graph is a straight line with negative slope.
Topper's Solved these Questions
- BOOK - CENGAGE PHYSICS ENGLISHCHAPTER - INDUCTANCEEXERCISE - Exercises (multiple Correct )7videos
INDUCTANCE
- BOOK - CENGAGE PHYSICS ENGLISHCHAPTER - INDUCTANCEEXERCISE - Exercises (assertion-reasoning)2videos
INDUCTANCE
- BOOK - CENGAGE PHYSICS ENGLISHCHAPTER - INDUCTANCEEXERCISE - Exercises (subjective)7videos
INDUCTANCE
- BOOK - CENGAGE PHYSICS ENGLISHCHAPTER - HEATING EFFECT OF CURRENTEXERCISE - Thermal Power in Resistance Connected in Circuit27videos
HEATING EFFECT OF CURRENT
- BOOK - CENGAGE PHYSICS ENGLISHCHAPTER - MAGNETIC FIELD AND MAGNETIC FORCESEXERCISE - Multiple Correct Answer type2videos
MAGNETIC FIELD AND MAGNETIC FORCES
Similar Questions
Switch S of the circuit shows in Fig is closed at t=0. If e denotes the induced emf in L and I is the current flowing through the circuit at time t, which of the following graphs is//are correct?
 View Solution
In an L-R circuit connected to a battery of constant emf E, switch is closed at time t=0. If e denotes the induced emf across inductor and I the current in the circuit at any time t. Then which of the following graphs shown the variation of e with i?
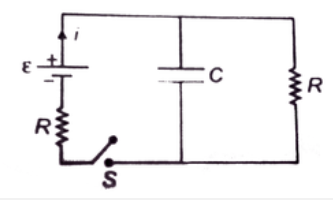
View SolutionIn the circuit shown, the switch is closed at t=0. Select the correct alternative(s)
 View Solution
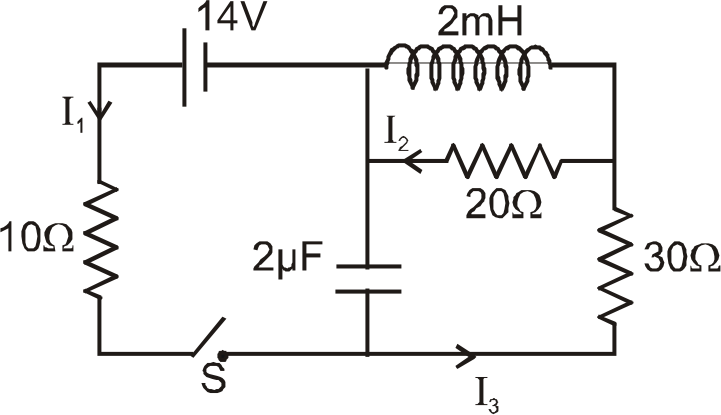
In the circuit shown, the switch is closed at t=0, the currents I1,I2 and I3 are
 View Solution
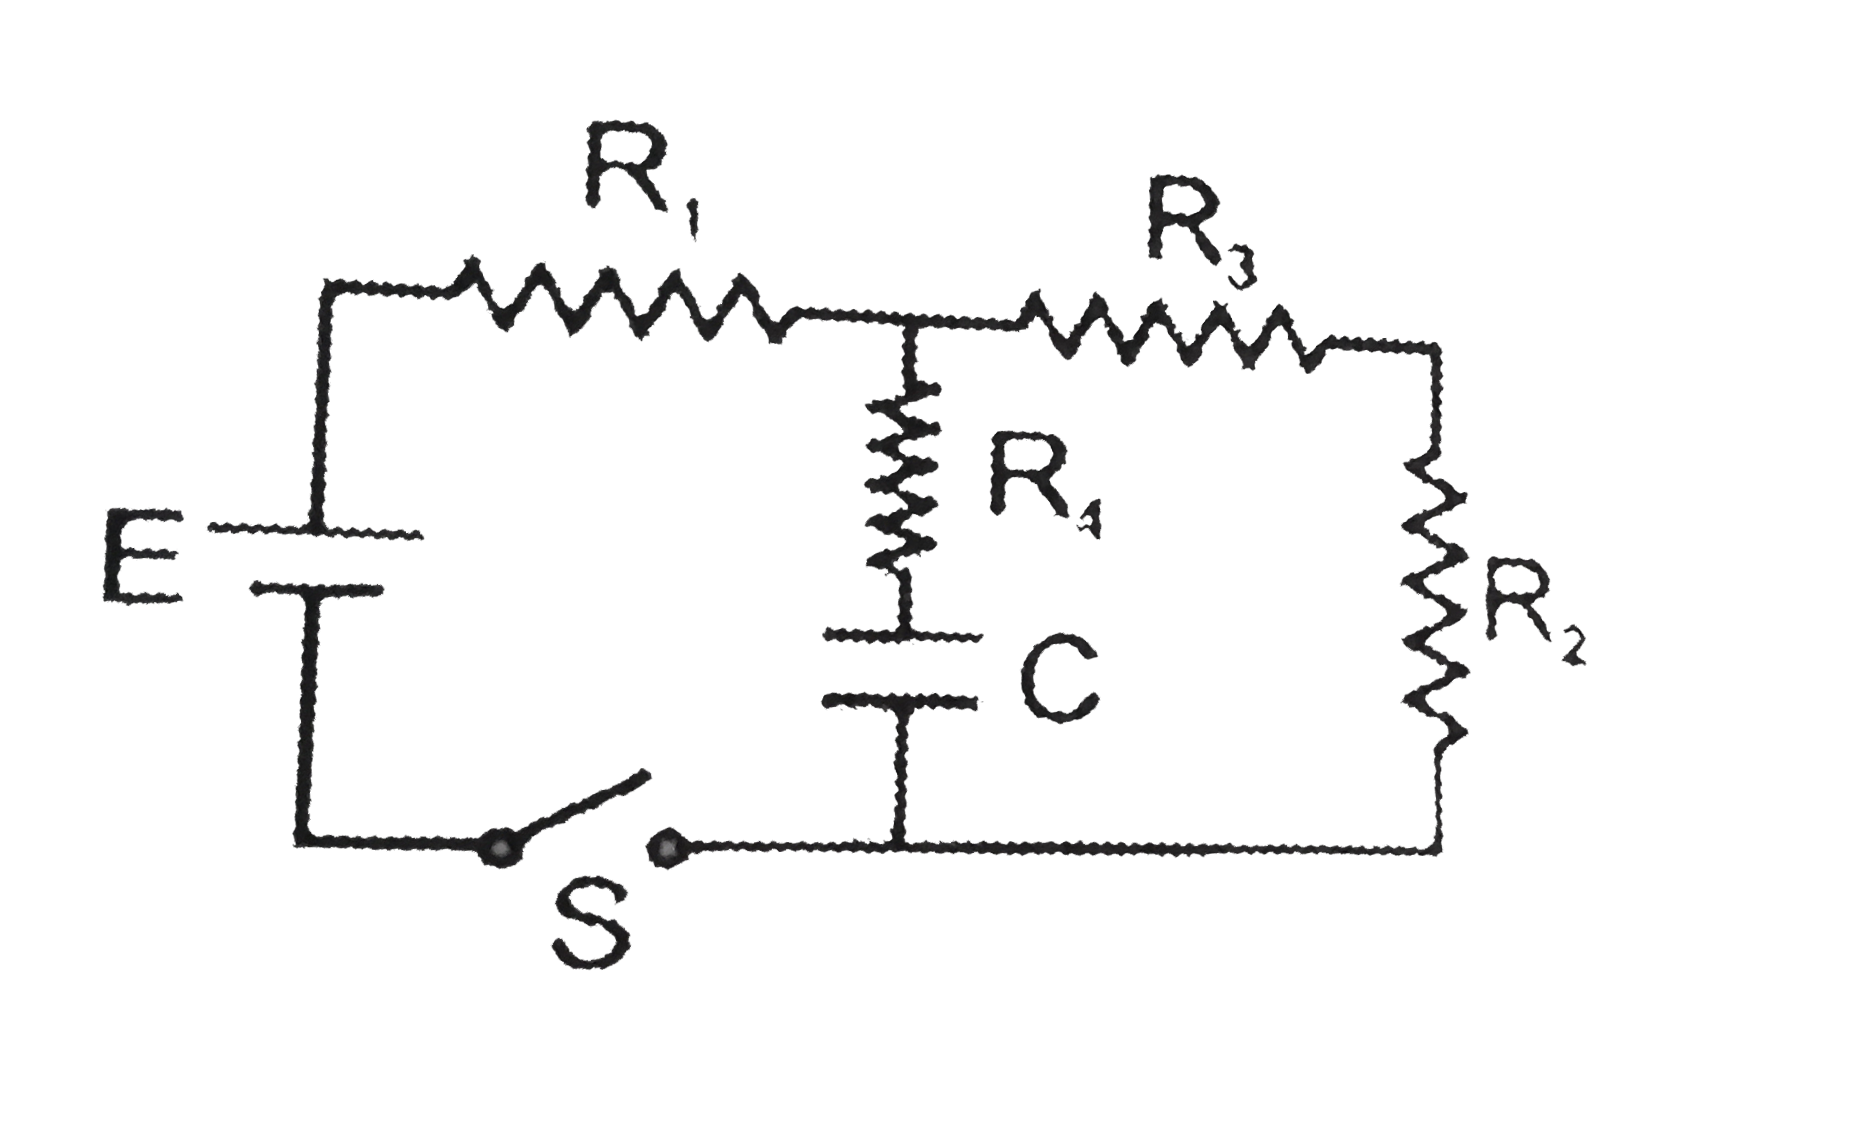
In the circuit shown in figure the switch S is closed at t = 0. A long time after closing the switch
 View Solution
Switch is closed at t=0 then the current in the circuit at t=L2R is
_PHY_E06_157_Q01.png) View Solution
View SolutionIn the circuit shown switch S is closed at t=0. Let i1 and i2 be the current at any finite time t then the ratio i1i2
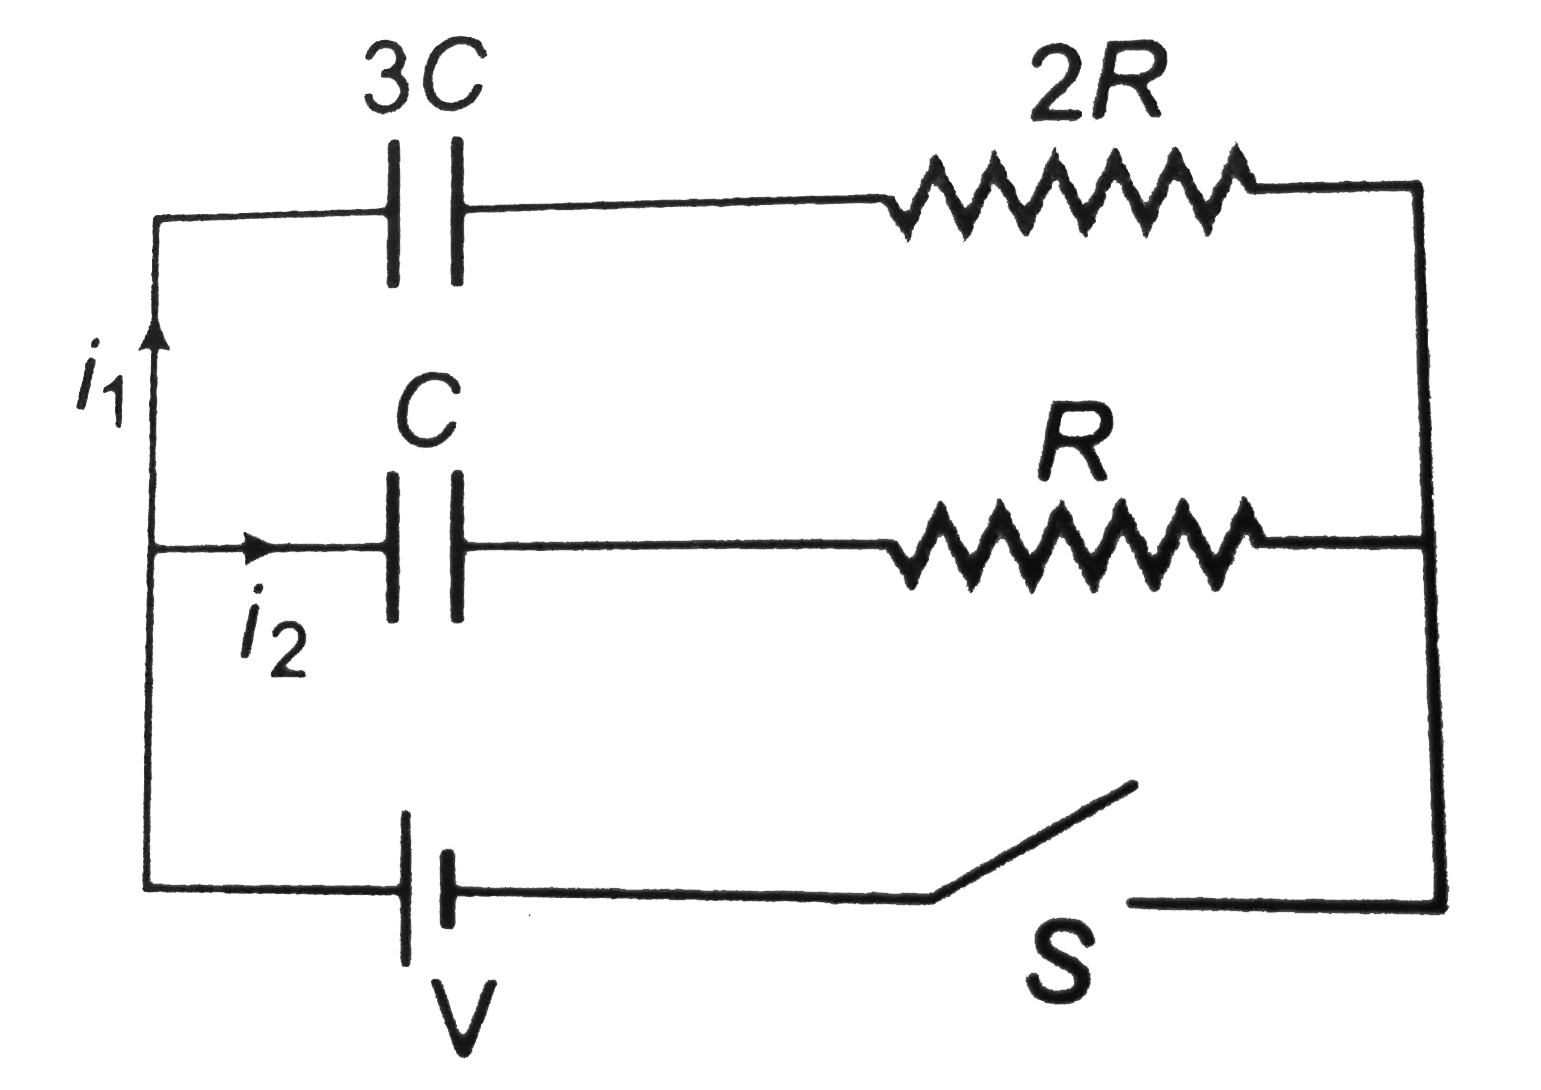 View Solution
In the circuit shown in figure-3.240 switch S is closed at time t=0. find the current through different wires and charge stored on the capacitor at any time t.
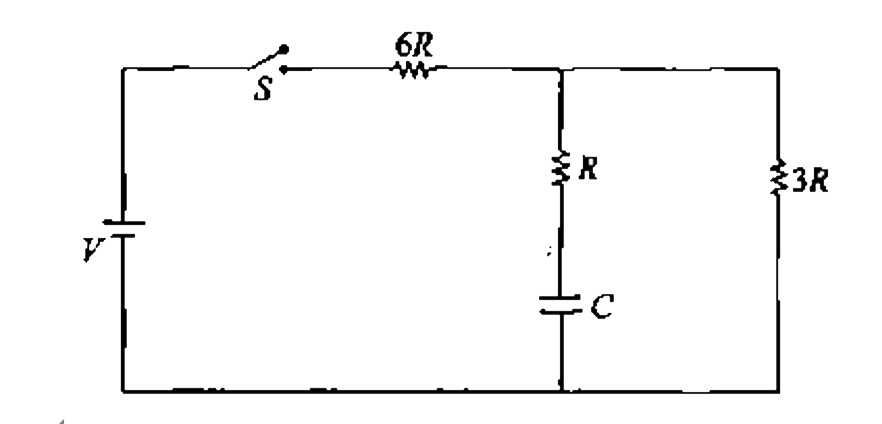 View Solution
In the circuit shown, switch S is closed at time t=0. Find the current through the inductor as a function of time t.
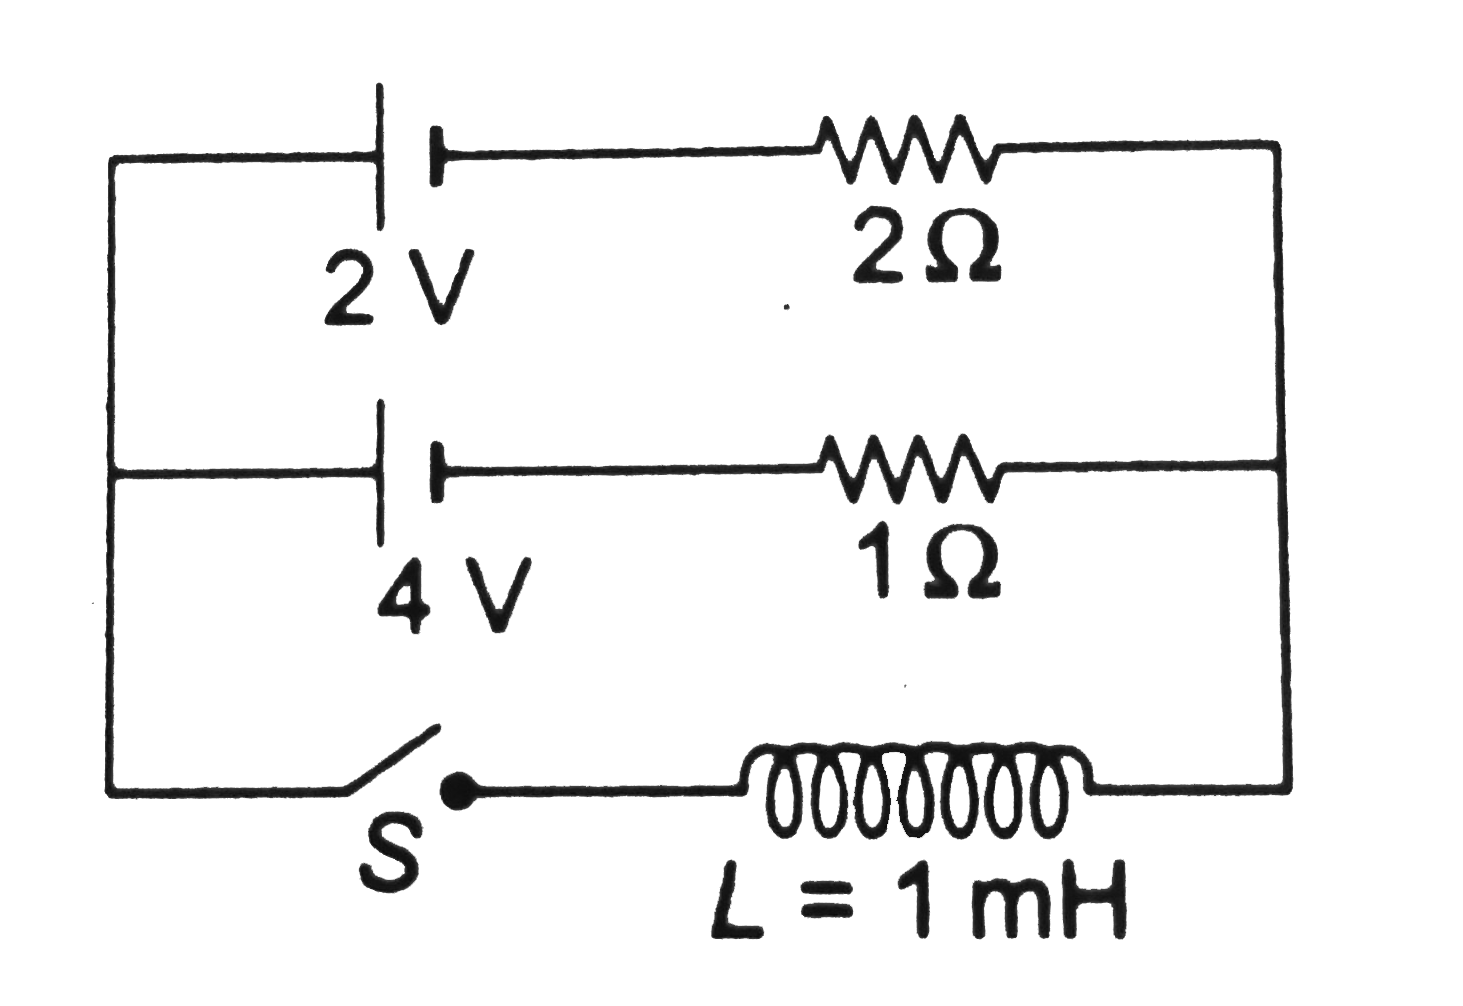 View Solution
In the circuit shwon in fig. switch S is closed at time t = 0. Let I1andI2 be the currents at any finite time t, then the ratio I1/I2
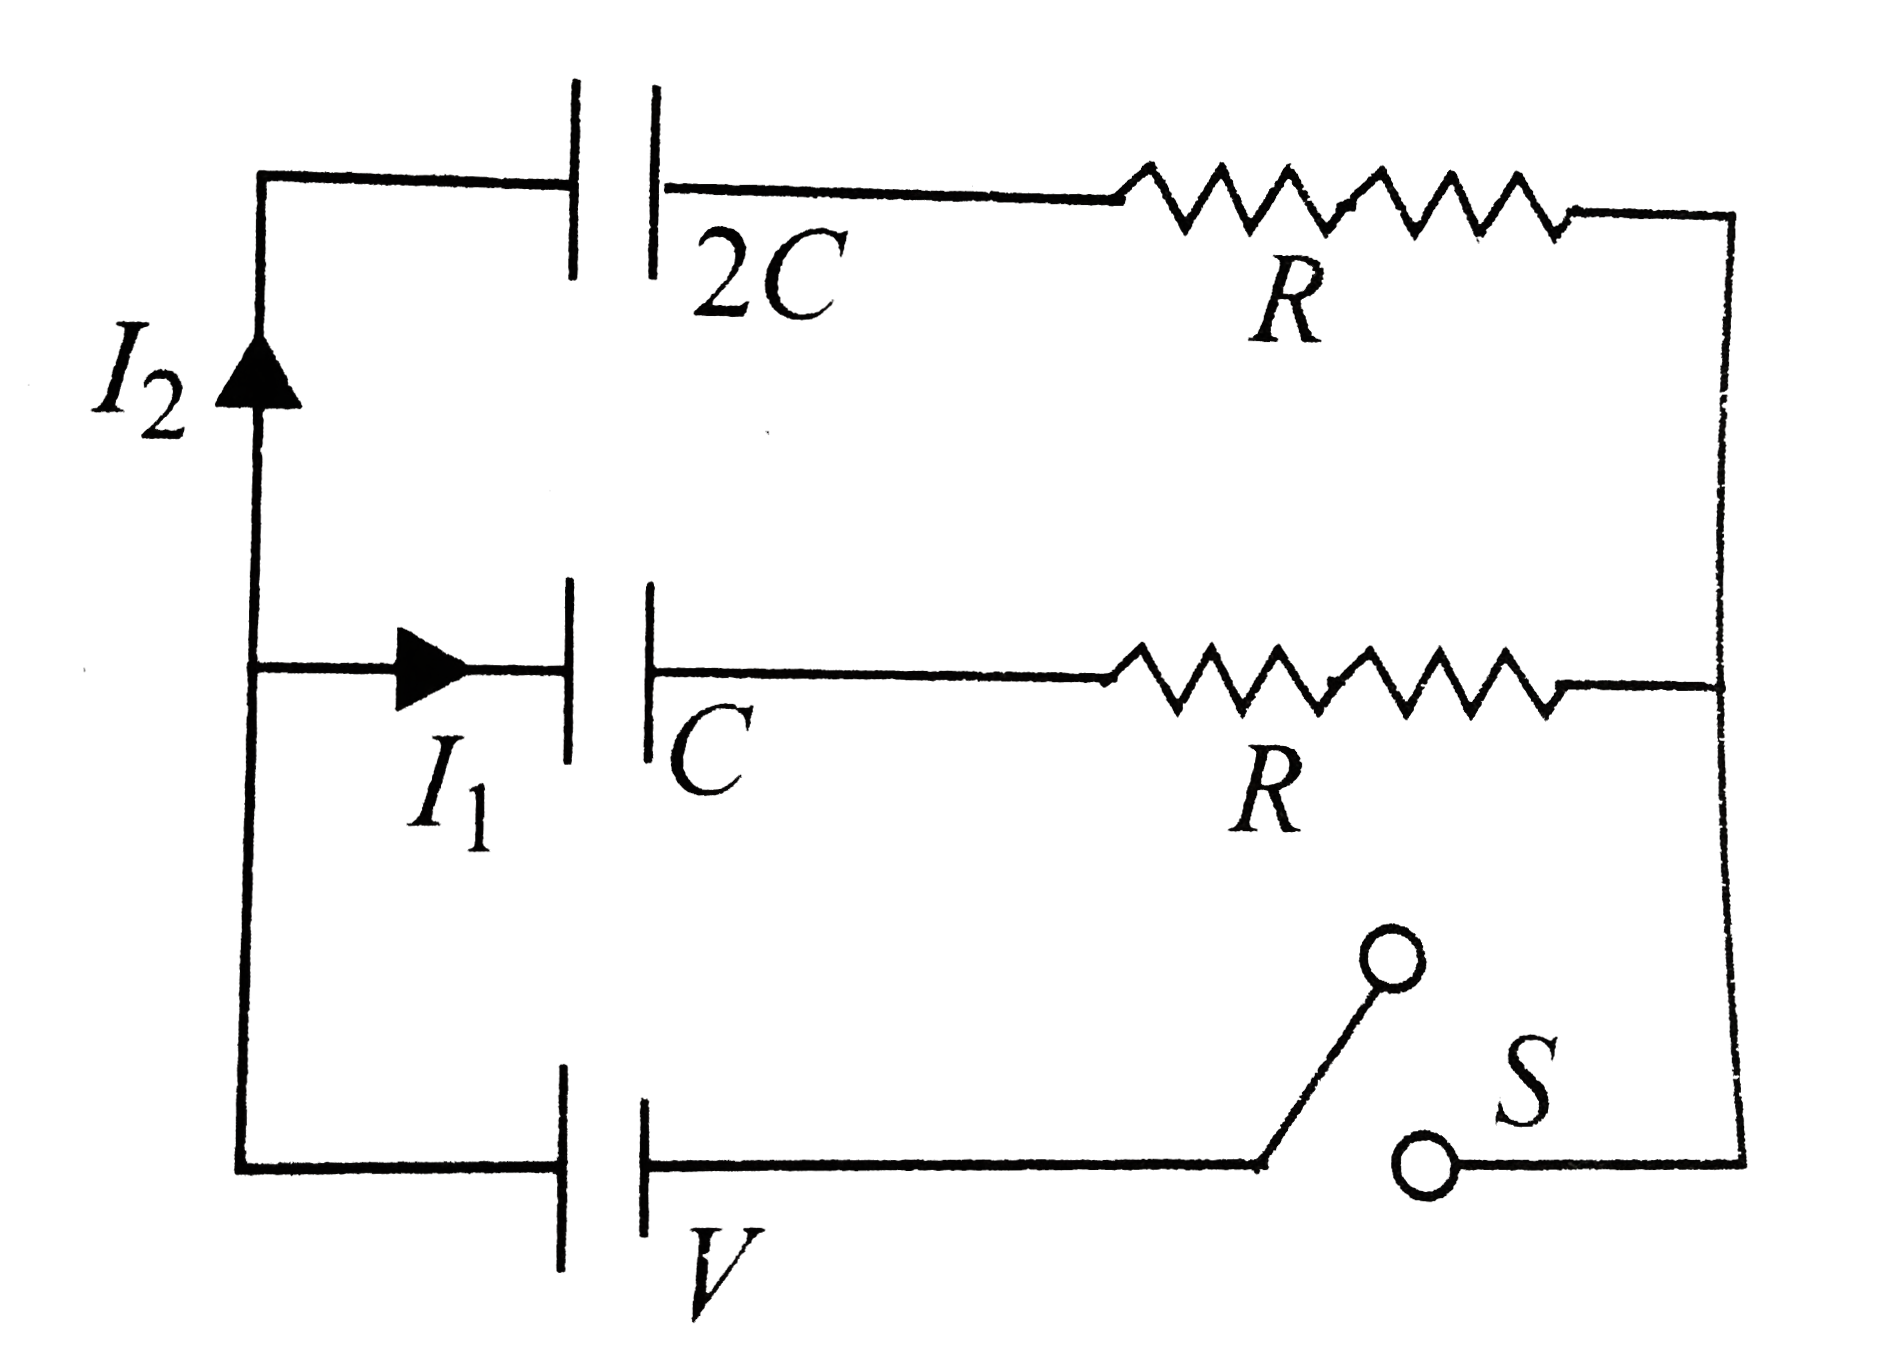 View Solution
