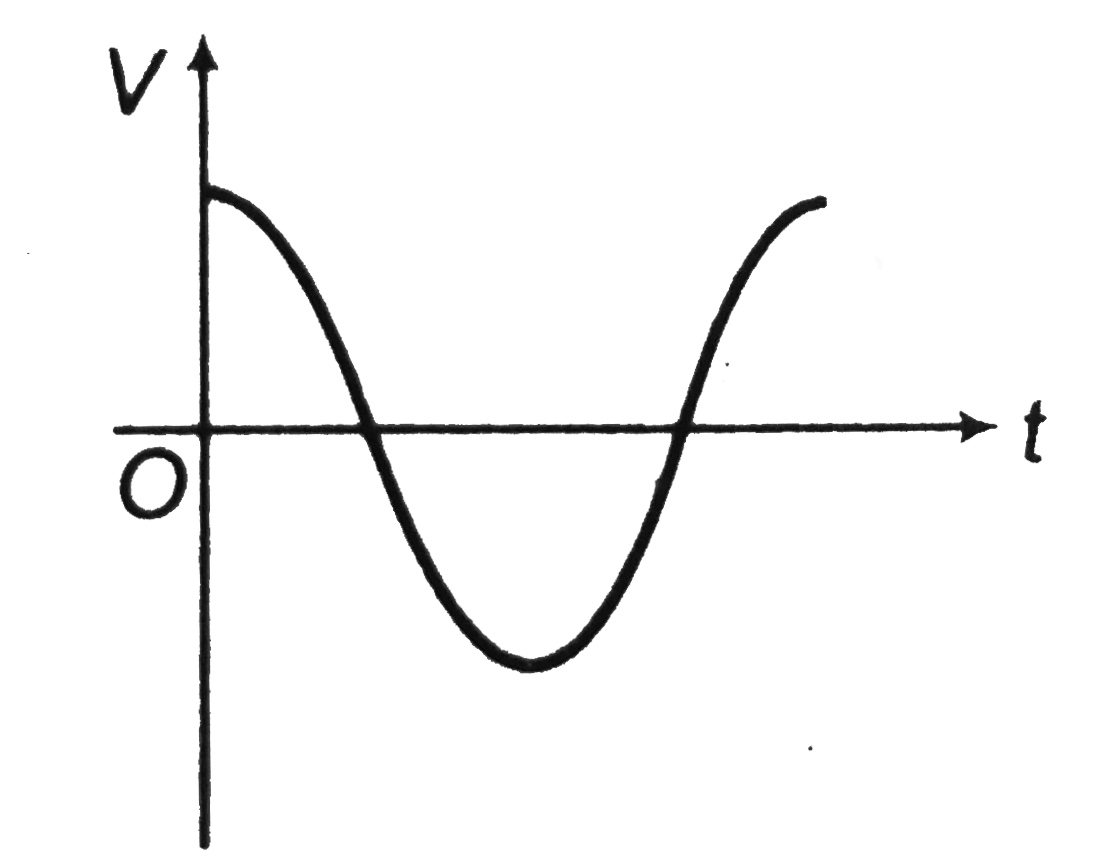
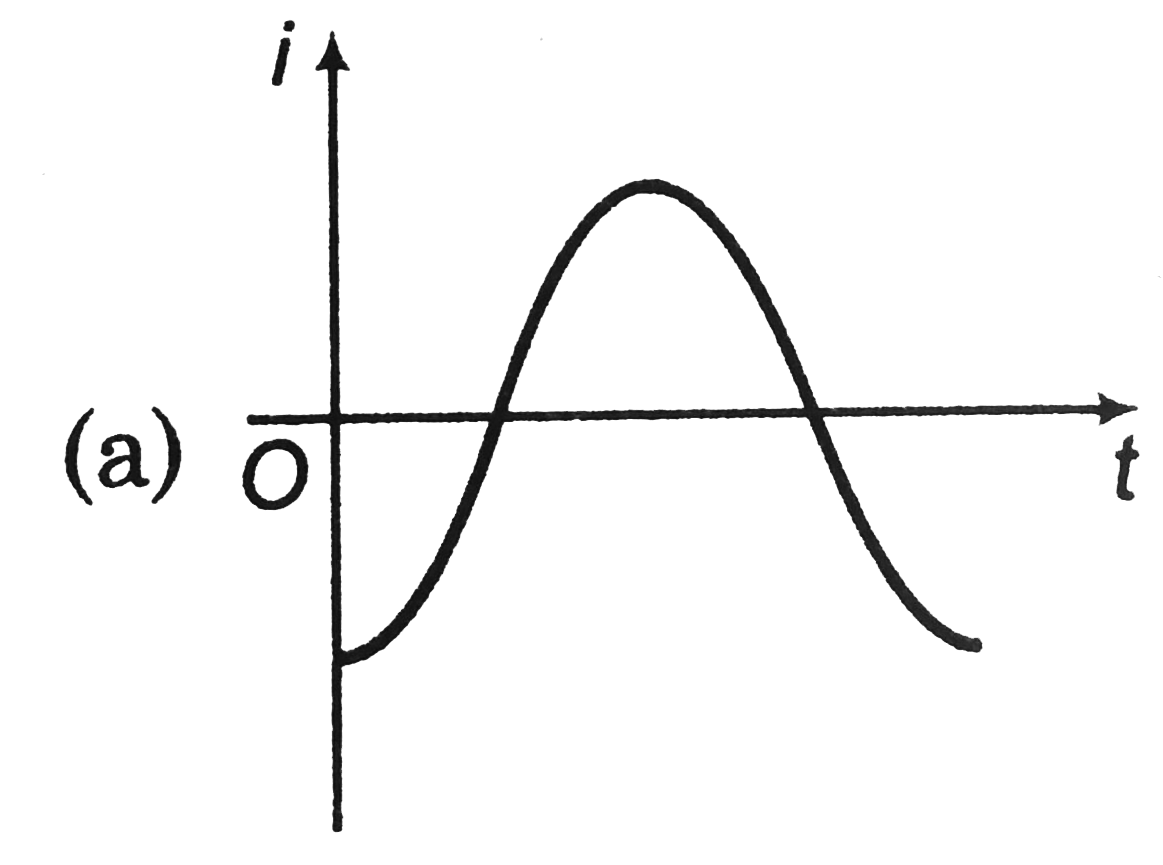
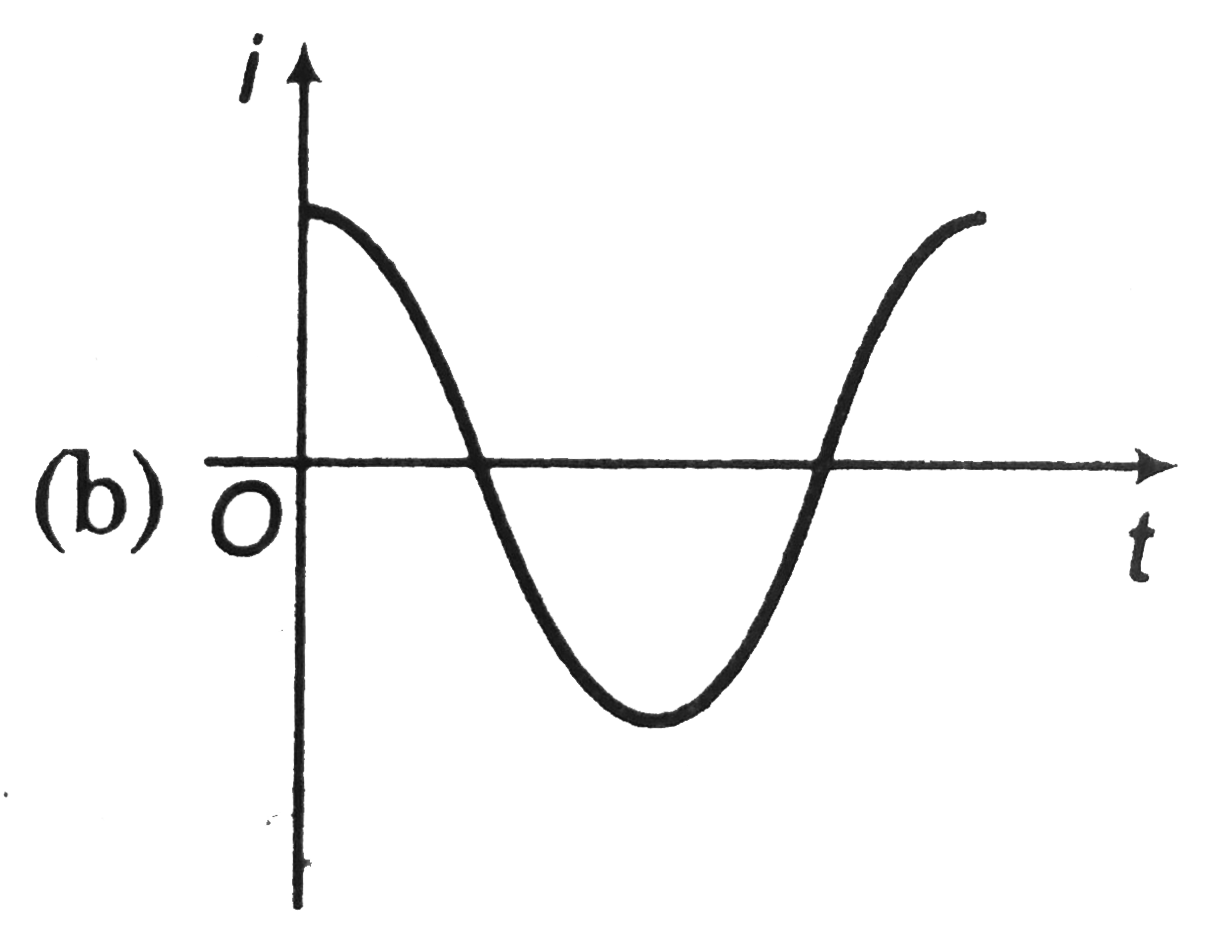
The figure represents the voltage applied across a pure inductor. The diagram which correctly represents the variation of curent i with time t is given by
 .
.
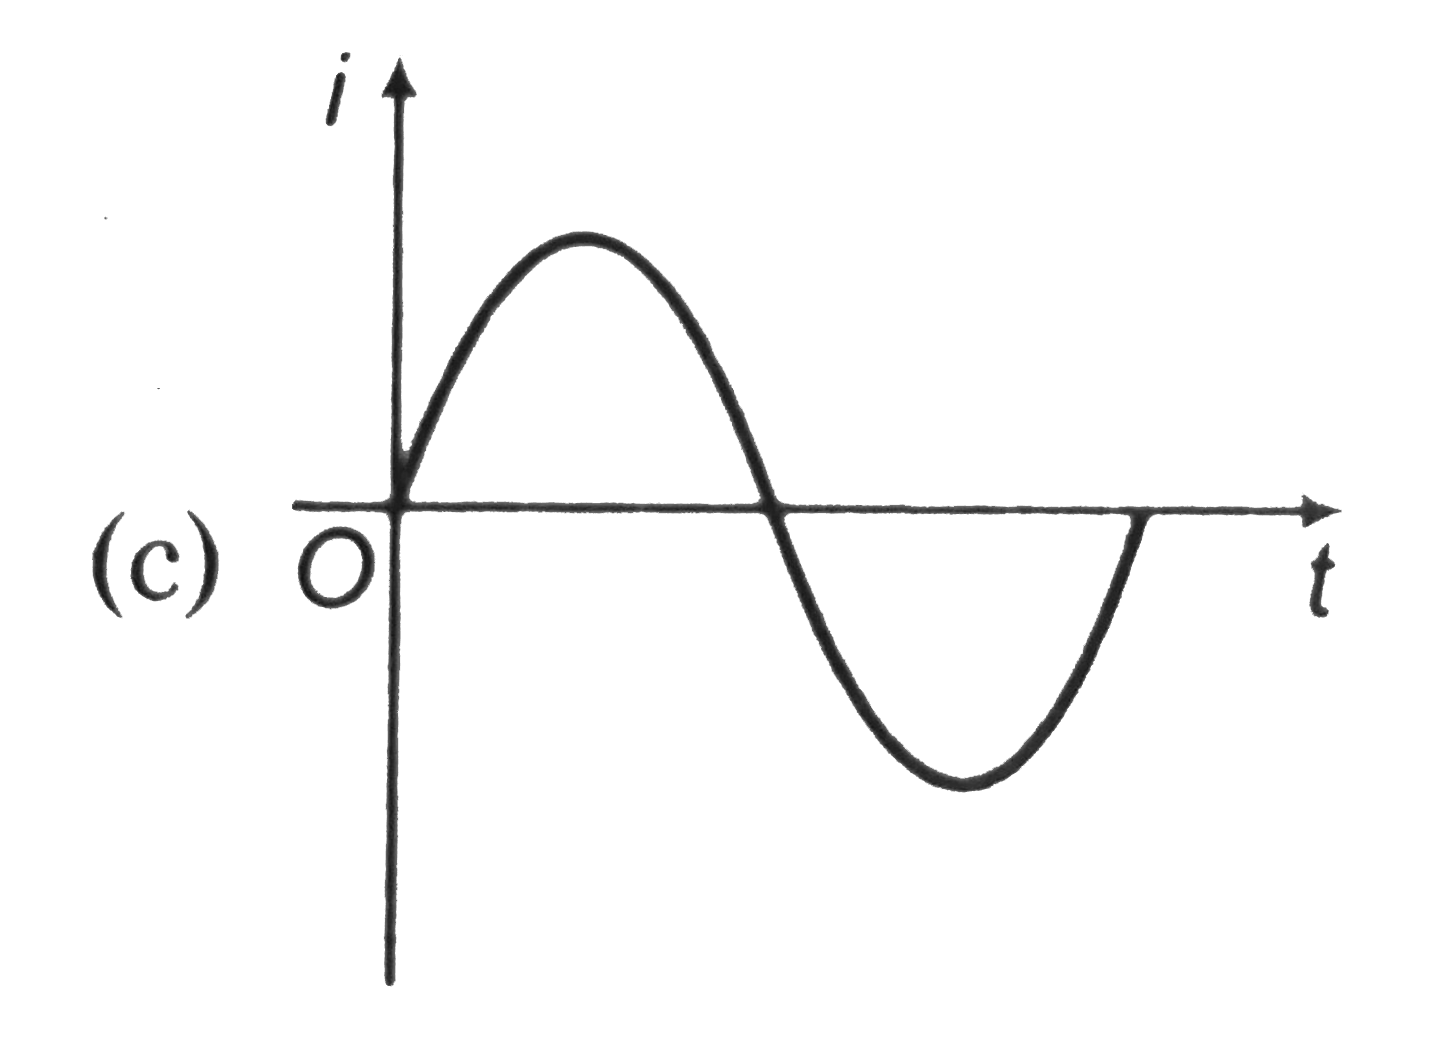
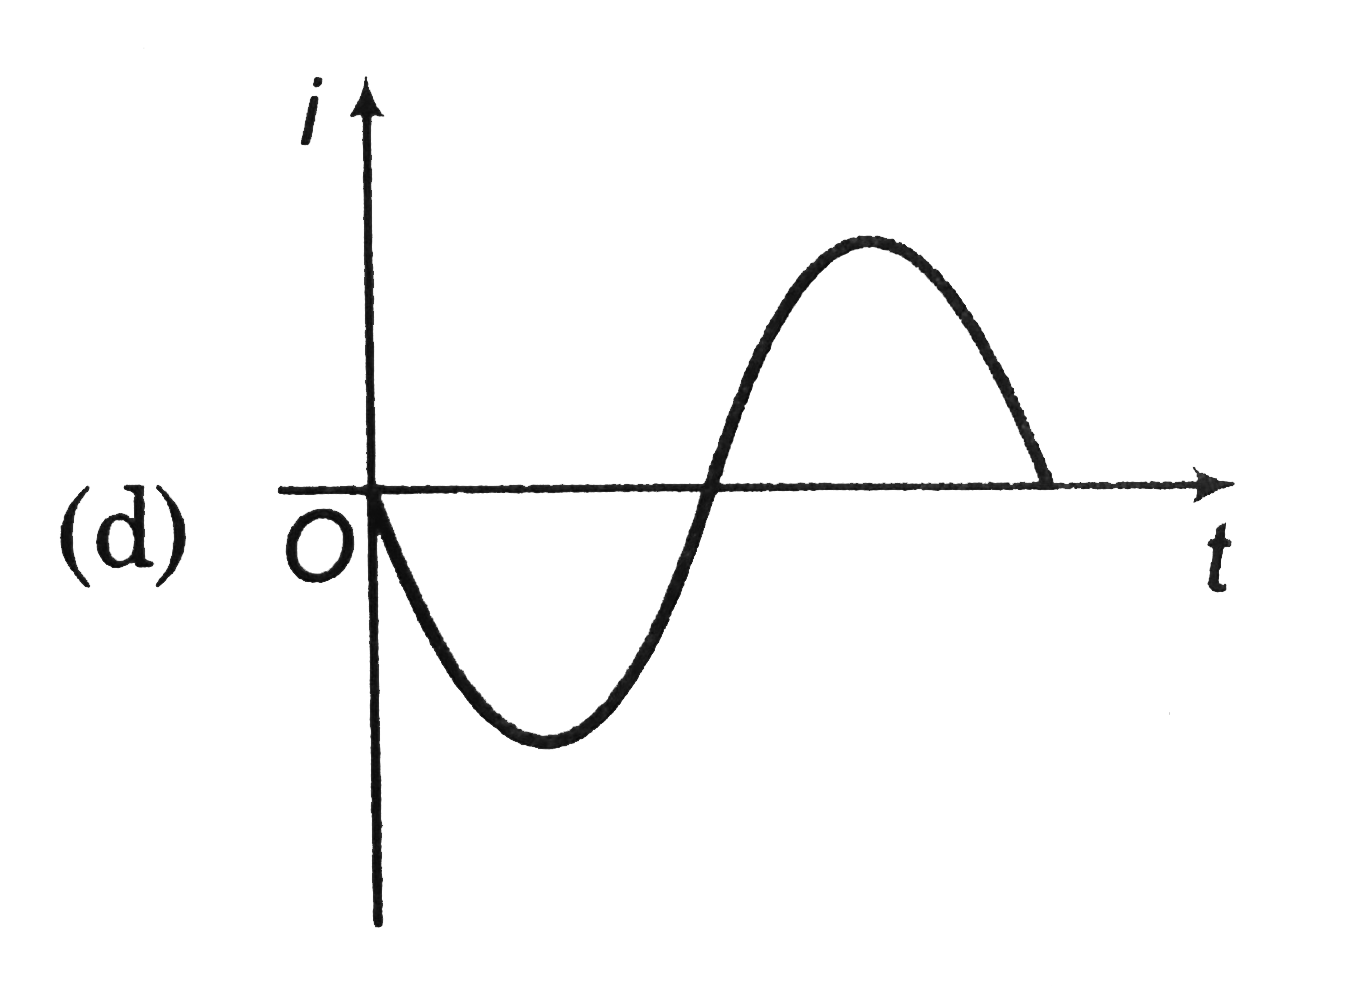
The correct Answer is:C
VL function is cos function, which is 90∘ ahead of the current function. Hence, current function should be sin function.
Topper's Solved these Questions
- BOOK - DC PANDEY ENGLISHCHAPTER - ALTERNATING CURRENTEXERCISE - Level - 1 Subjective6videos
ALTERNATING CURRENT
- BOOK - DC PANDEY ENGLISHCHAPTER - ALTERNATING CURRENTEXERCISE - Level- 2 Single Correct18videos
ALTERNATING CURRENT
- BOOK - DC PANDEY ENGLISHCHAPTER - ALTERNATING CURRENTEXERCISE - Level 1 Assertion-Reason11videos
ALTERNATING CURRENT
- BOOK - DC PANDEY ENGLISHCHAPTER - ATOMSEXERCISE - MEDICAL ENTRANCES GALLERY42videos
ATOMS
Similar Questions
Knowledge Check
- Question 1 - Select One
Which energy diagram best represents the given reaction ?
 A
A B
B C
C D
D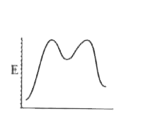
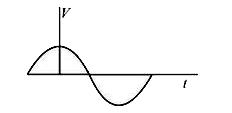
Voltage across a capacitor varies as shown in the diagram. Which diagram correctly represents the current time curve?
 View Solution
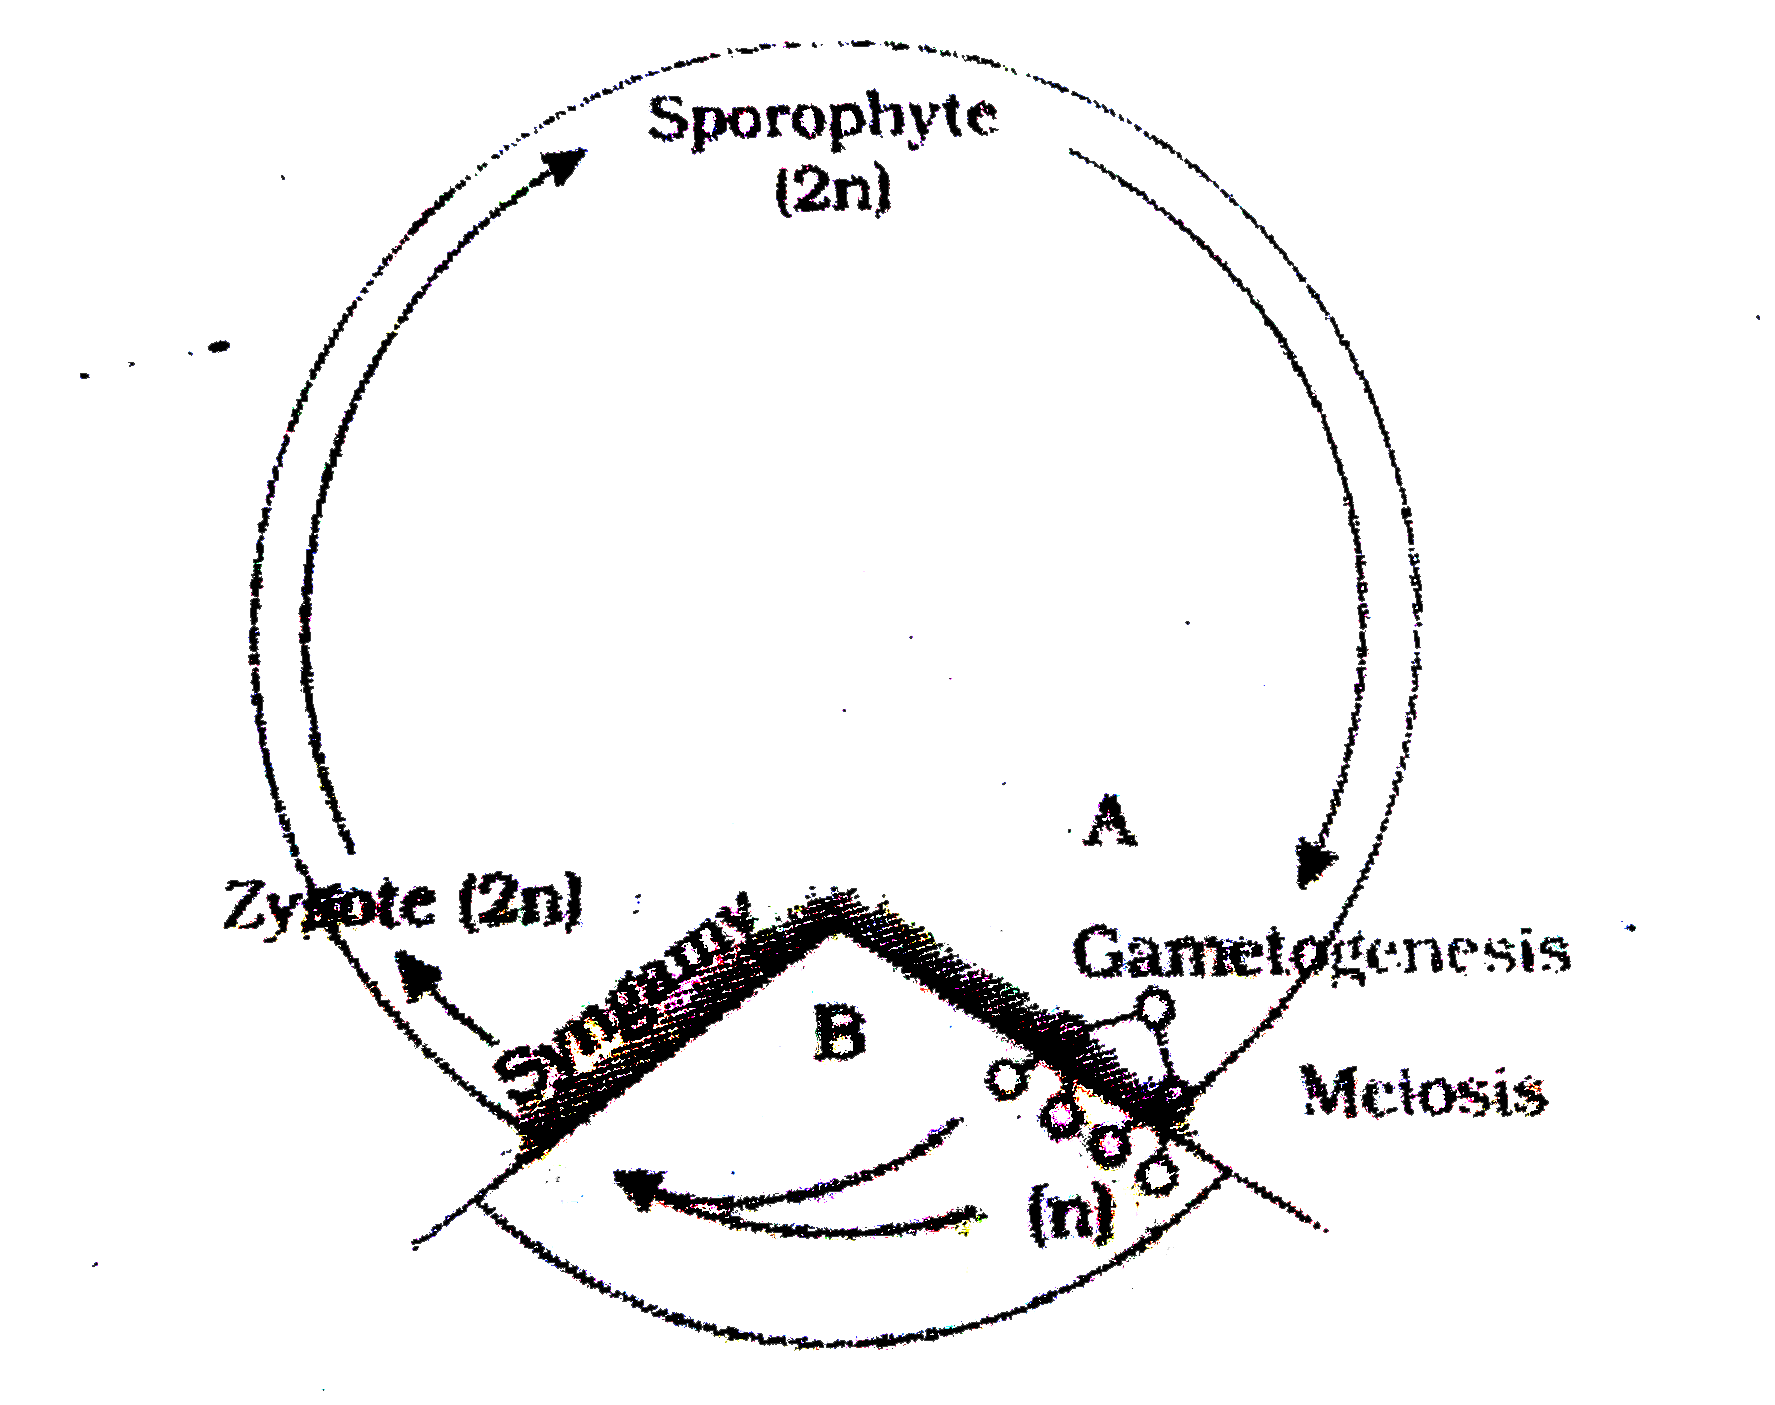
See the given life cycle pattern and choose the option which it correctly represents.
 View Solution
Which of following graphs correctly represents the variation of particle momentum with de-Broglie wavelength?
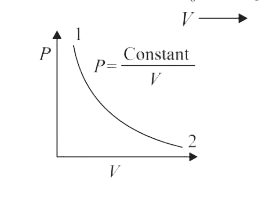
View SolutionFor the diagram given for an ideal gas, out of the following which one correctly represent the diagram?
 View Solution
In the given diagram which diversity represent by A, B, and CView SolutionIf heat energy is given to an ideal gas at constant pressure, then select the graph which best represents the variation of VT with temperature (T).
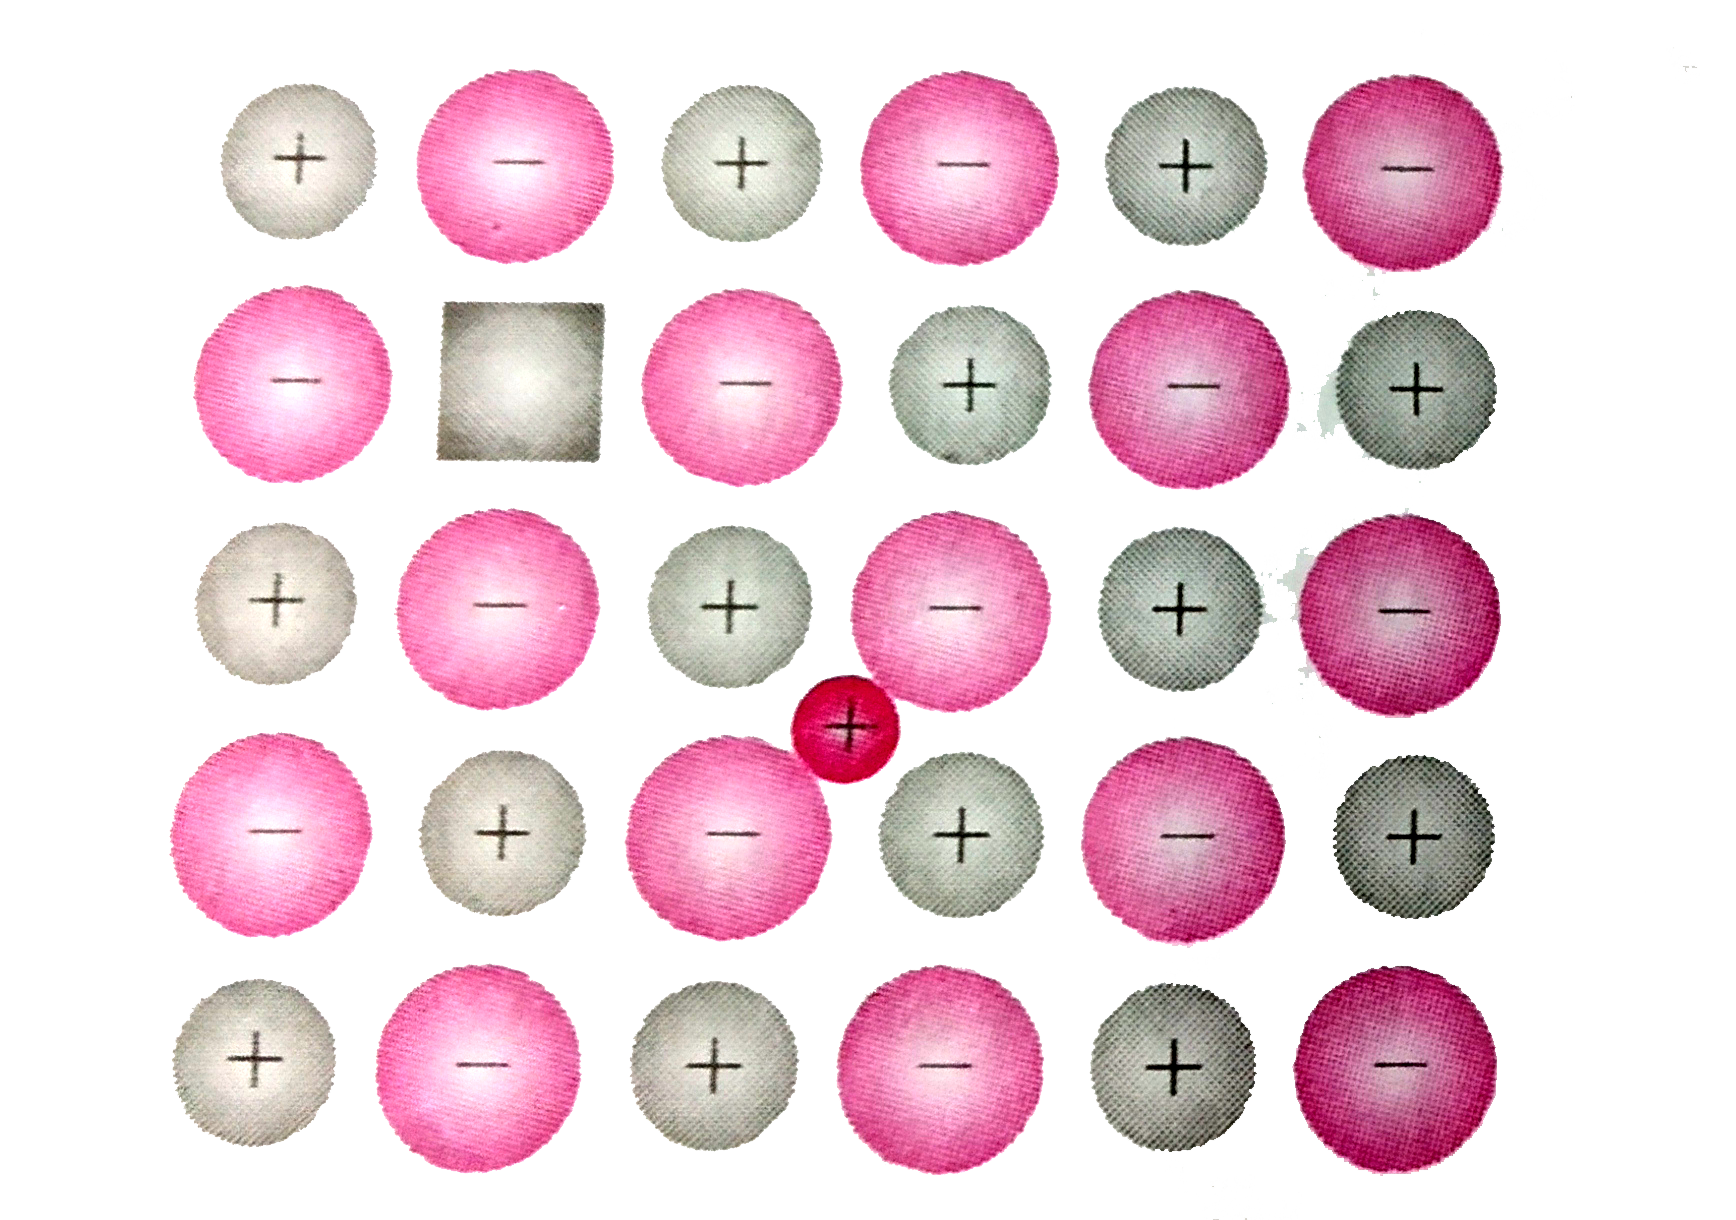
View SolutionWhich is the defect represented by the given figure ?
 View Solution

