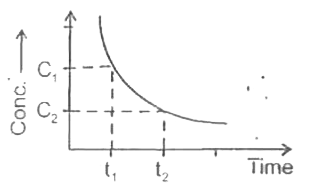
The graph between the instantaneous concentration (N) of a radioactive element and time (t) is.


The correct Answer is:D
To solve the question regarding the graph between the instantaneous concentration (N) of a radioactive element and time (t), we can follow these steps:
Step 1: Understand the Concept of Radioactive Decay
Radioactive decay is a random process by which an unstable atomic nucleus loses energy by emitting radiation. The concentration of a radioactive substance decreases over time as it transforms into other elements or isotopes.
Hint: Remember that radioactive decay is a stochastic process and is characterized by a half-life.
Step 2: Identify the Mathematical Representation
The instantaneous concentration (N) of a radioactive element at time (t) can be described by the equation:
N(t)=N0e−λt
where:
- N0 is the initial concentration at time t=0,
- λ is the decay constant,
- t is the time.
Hint: The exponential function e−λt indicates how the concentration decreases over time.
Step 3: Analyze the Equation
From the equation N(t)=N0e−λt:
- As time (t) increases, the term e−λt decreases.
- This means that the instantaneous concentration N decreases exponentially.
Hint: Focus on the negative exponent; it signifies a decrease in concentration over time.
Step 4: Graphical Representation
When we plot the graph of N versus t:
- The y-axis represents the instantaneous concentration N.
- The x-axis represents time t.
- The curve will start at N0 when t=0 and will approach zero as t increases, forming a smooth, downward-sloping curve.
Hint: The shape of the graph is crucial; it should show a rapid decrease initially that gradually slows down.
Step 5: Conclusion
Based on the analysis, the graph of the instantaneous concentration N of a radioactive element versus time t is an exponential decay curve. Therefore, the correct option is that the graph shows an exponential decrease in concentration over time.
Final Answer: The graph between the instantaneous concentration (N) of a radioactive element and time (t) is an exponential decay curve.
Radioactive decay is a random process by which an unstable atomic nucleus loses energy by emitting radiation. The concentration of a radioactive substance decreases over time as it transforms into other elements or isotopes.
The instantaneous concentration (N) of a radioactive element at time (t) can be described by the equation:
N(t)=N0e−λt
where:
- N0 is the initial concentration at time t=0,
- λ is the decay constant,
- t is the time.
From the equation N(t)=N0e−λt:
- As time (t) increases, the term e−λt decreases.
- This means that the instantaneous concentration N decreases exponentially.
When we plot the graph of N versus t:
- The y-axis represents the instantaneous concentration N.
- The x-axis represents time t.
- The curve will start at N0 when t=0 and will approach zero as t increases, forming a smooth, downward-sloping curve.
Based on the analysis, the graph of the instantaneous concentration N of a radioactive element versus time t is an exponential decay curve. Therefore, the correct option is that the graph shows an exponential decrease in concentration over time.
Topper's Solved these Questions
- NUCLEIBOOK - DC PANDEY ENGLISHCHAPTER - NUCLEIEXERCISE - B Medical entrance special format questions
9 Videos
- NUCLEIBOOK - DC PANDEY ENGLISHCHAPTER - NUCLEIEXERCISE - MATCH THE COLUMNS
4 Videos
- NUCLEIBOOK - DC PANDEY ENGLISHCHAPTER - NUCLEIEXERCISE - CHECK POINT 13.3
15 Videos
- MODERN PHYSICS - 2BOOK - DC PANDEY ENGLISHCHAPTER - MODERN PHYSICS - 2EXERCISE - Level 2 Subjective
10 Videos
- RAY OPTICSBOOK - DC PANDEY ENGLISHCHAPTER - RAY OPTICSEXERCISE - Medical entrance gallary
76 Videos
Similar Questions
The graph plotted between concentration versus time

View SolutionThe graph between the (velocity2) and temperature T of a gas is
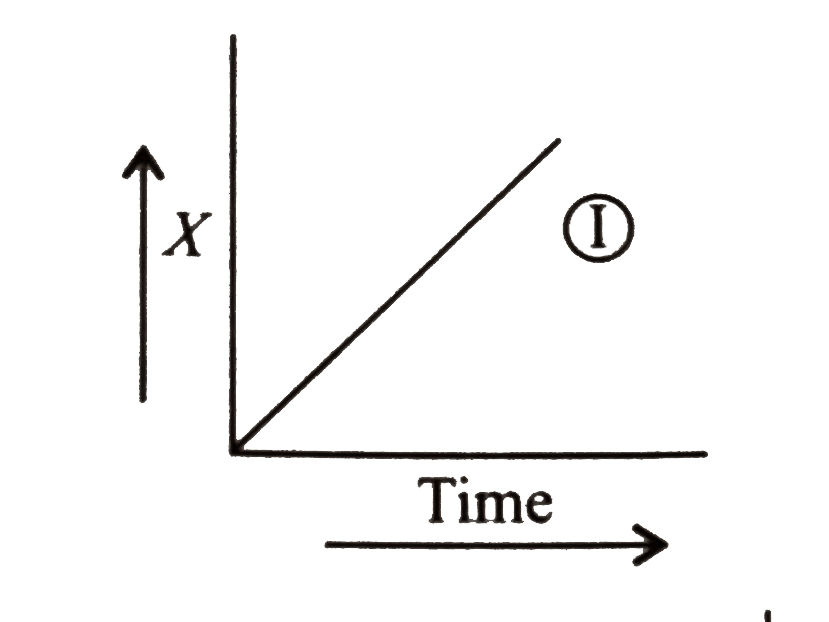
View SolutionThe graph between concentration (X) of the Product and time of the reaction A→B is of the type 1. Hence, graph between −d[A]dt and time will be of the type:

View SolutionThe graph between concentration (X) of the Product and time of the reaction A→B is of the type 1. Hence, graph between −d[A]dt and time will be of the type:

View SolutionFor the reactionA→B, for which graph between half life (t1/2)and∈itialconcentration(a)oftherectantisgivenbelow<br><imga≤ocr_imageload∈g=lazysrc=https://d10lpgp6xz60nq.cloudfront.net/physics_images/NRA_PHY_CHM_JMA_C07_E01_022_Q01.pngwh=80%mx-autosty≤=background:white;><br>Hencegraphbetween-(d[A])/(dt) and time will be:
View SolutionThe graph of t1/2 versus initial concentration 'a' is for

View SolutionGraphs are very useful to represent a physical situation. Various quantities can be easily represented on graphs and other quantites can be determined from the graph. For example the slope of velocity-time graph represents instantaneous acceleration. For a motion with constant acceleration slope of velocity-time graph is constant. If acceleration is changing with time, slope will change and thus velocity-time graph will be a non-linear curve. Further the area of velocity-time graph gives displacement.
The correct relation between v0,a1,a2andt0 is
View SolutionGraphs are very useful to represent a physical situation. Various quantities can be easily represented on graphs and other quantites can be determined from the graph. For example the slope of velocity-time graph represents instantaneous acceleration. For a motion with constant acceleration slope of velocity-time graph is constant. If acceleration is changing with time, slope will change and thus velocity-time graph will be a non-linear curve. Further the area of velocity-time graph gives displacement.
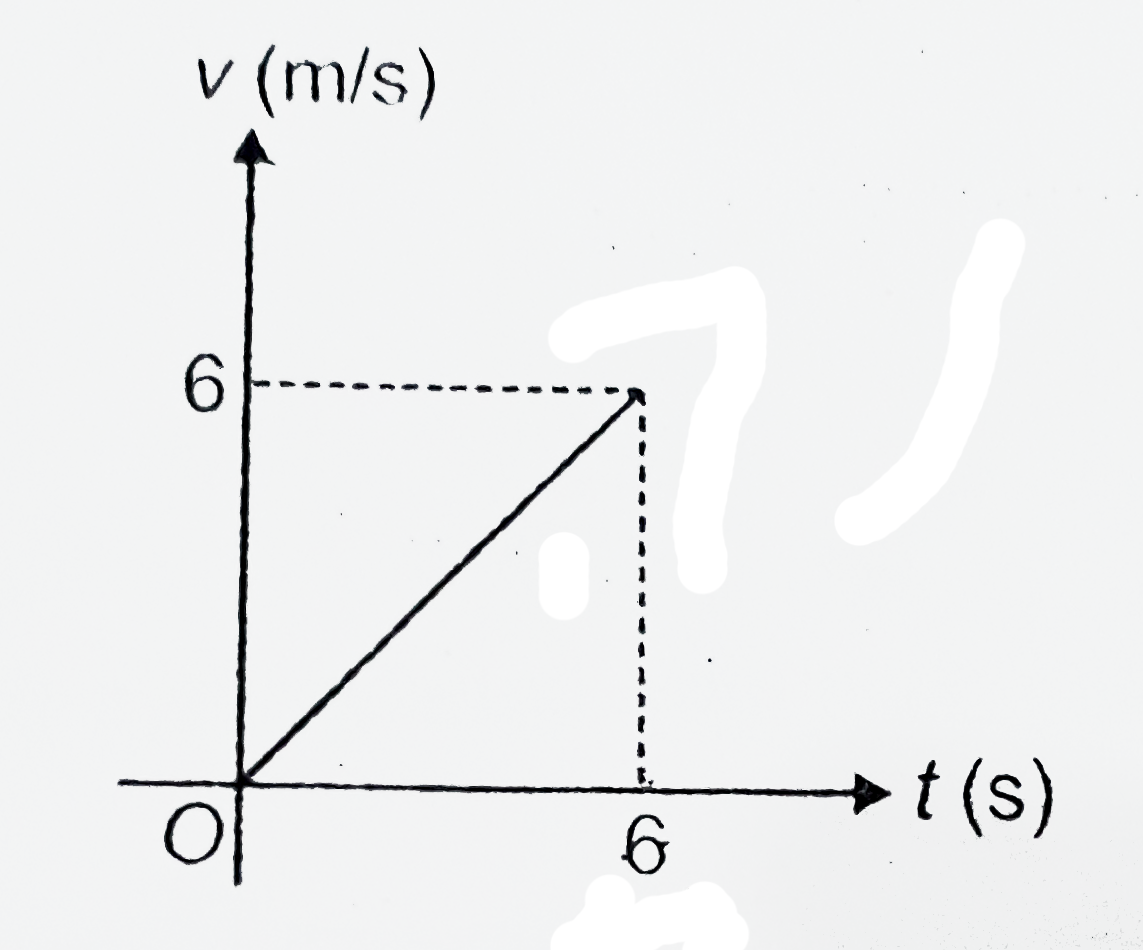
For the given velocity-time graph the displacement of the object between t = 2 s to t = 4 s is

View SolutionGraphs are very useful to represent a physical situation. Various quantities can be easily represented on graphs and other quantites can be determined from the graph. For example the slope of velocity-time graph represents instantaneous acceleration. For a motion with constant acceleration slope of velocity-time graph is constant. If acceleration is changing with time, slope with change and thus velocity-time graph will be a non-linear curve. Further the area of velocity-time graph gives displacement.
For the above situation let t1 be the time of accelerated motion and t2 be the time or retarded motion, then the correct relation is
View SolutionGraphs are very useful to represent a physical situation. Various quantities can be easily represented on graphs and other quantites can be determined from the graph. For example the slope of velocity-time graph represents instantaneous acceleration. For a motion with constant acceleration slope of velocity-time graph is constant. If acceleration is changing with time, slope will change and thus velocity-time graph will be a non-linear curve. Further the area of velocity-time graph gives displacement.
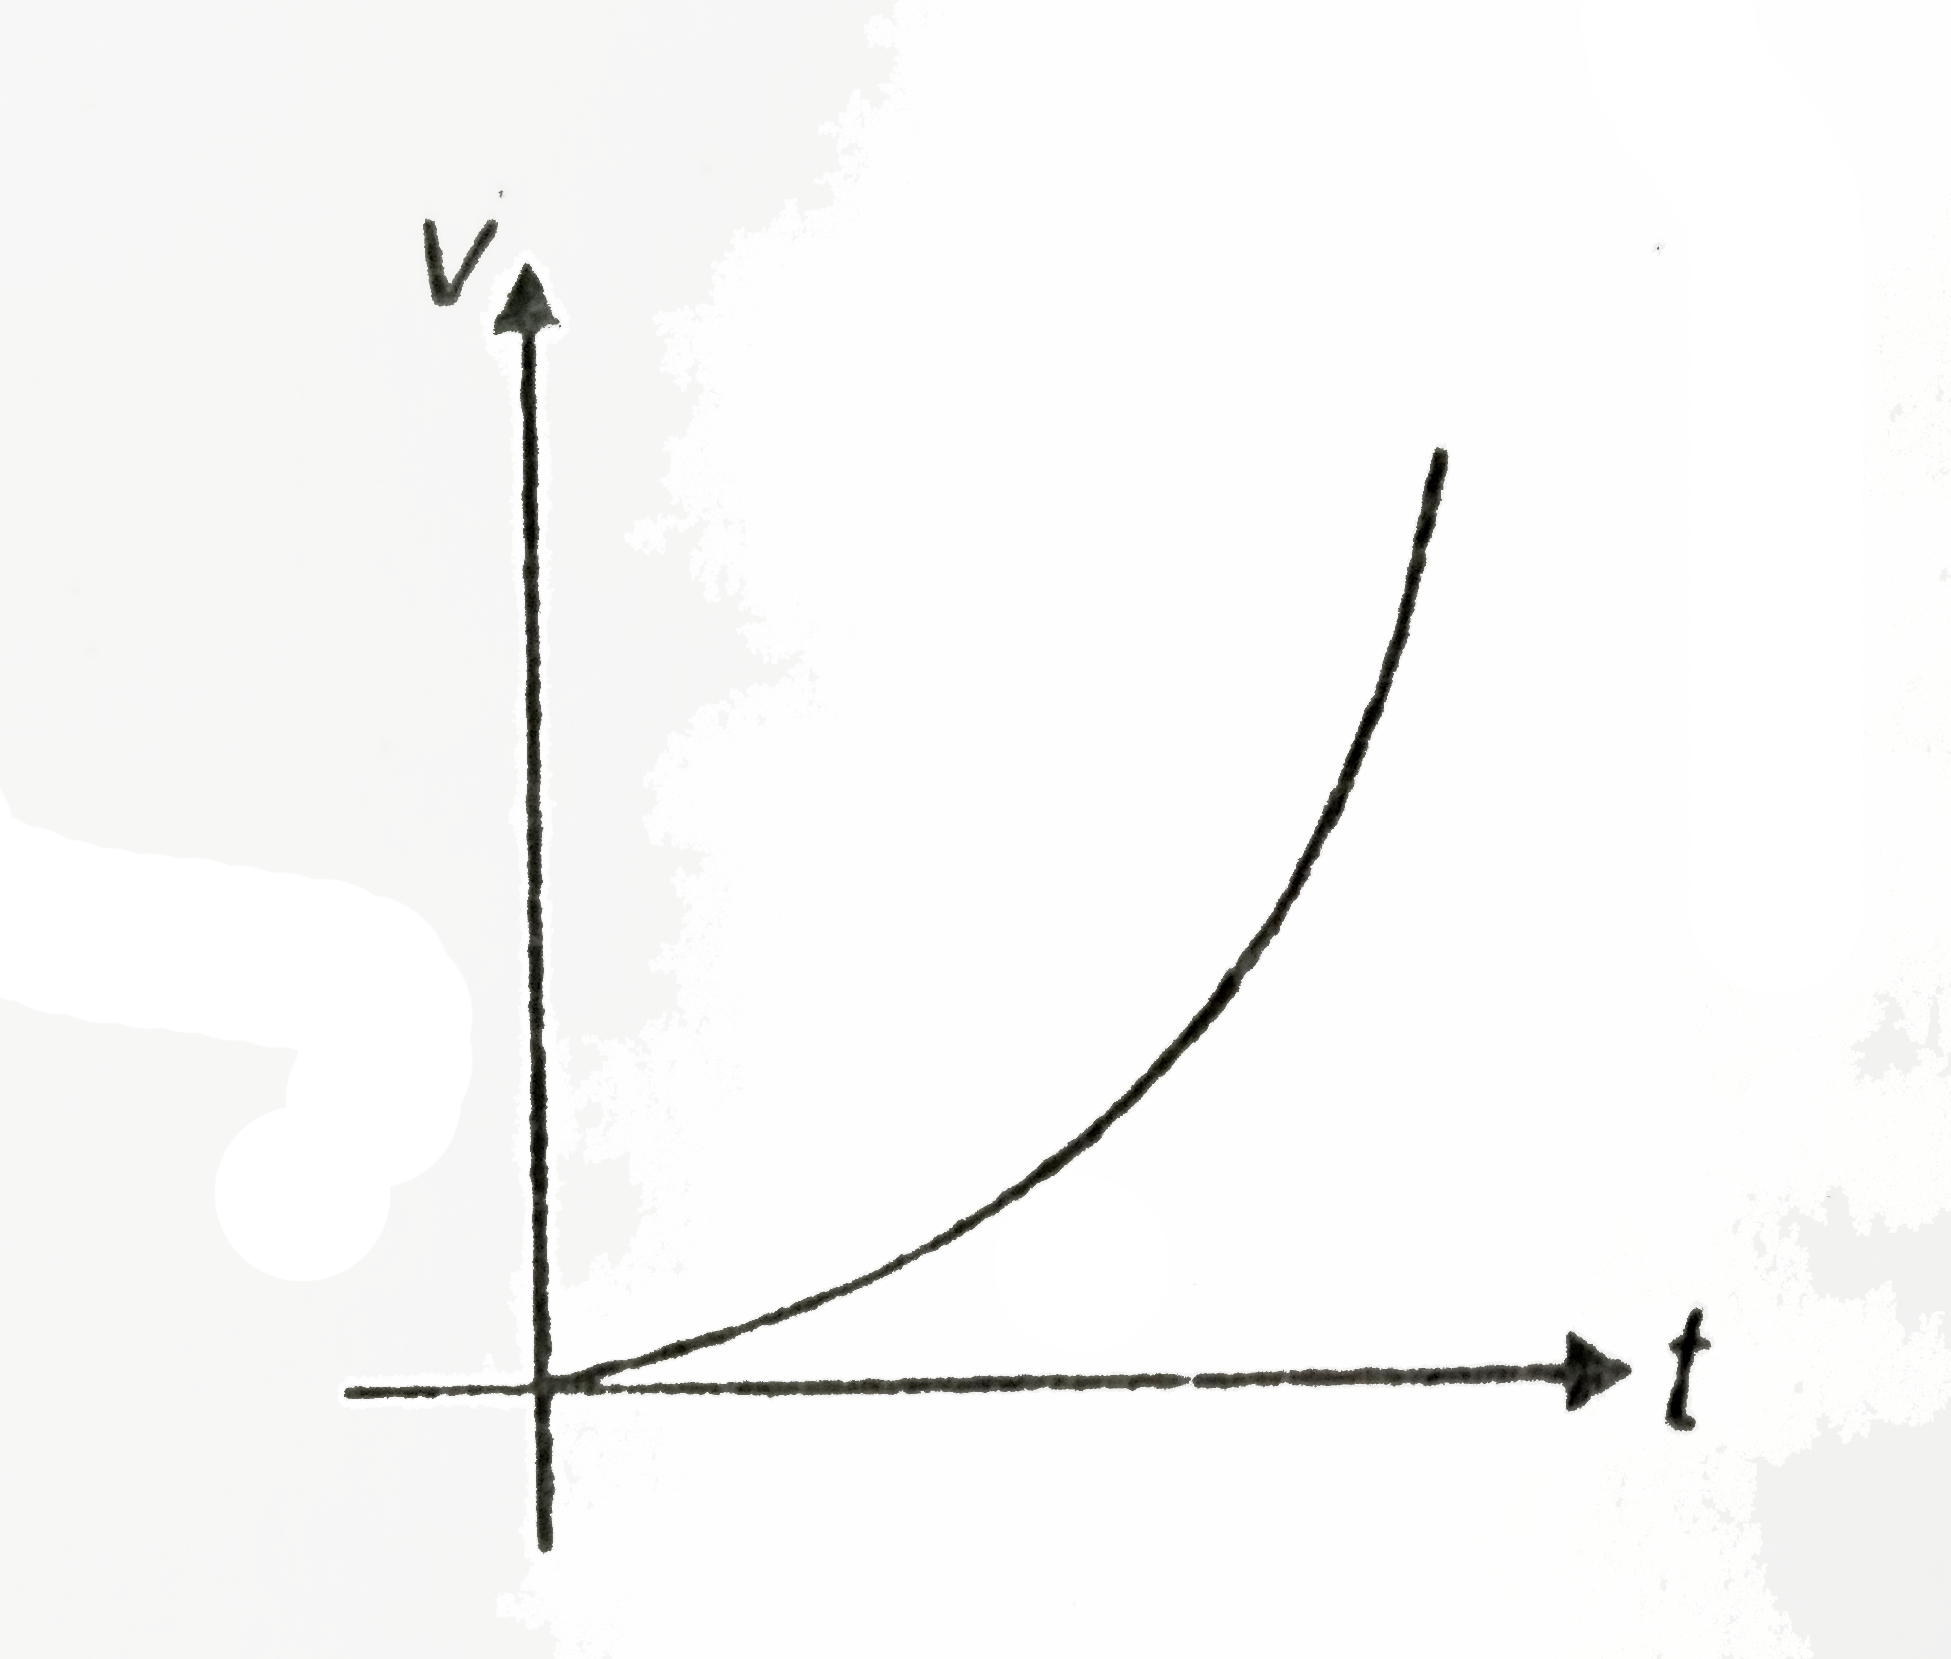
For the given velocity-time graph the possibly correct acceleration-time relationship is

View Solution
