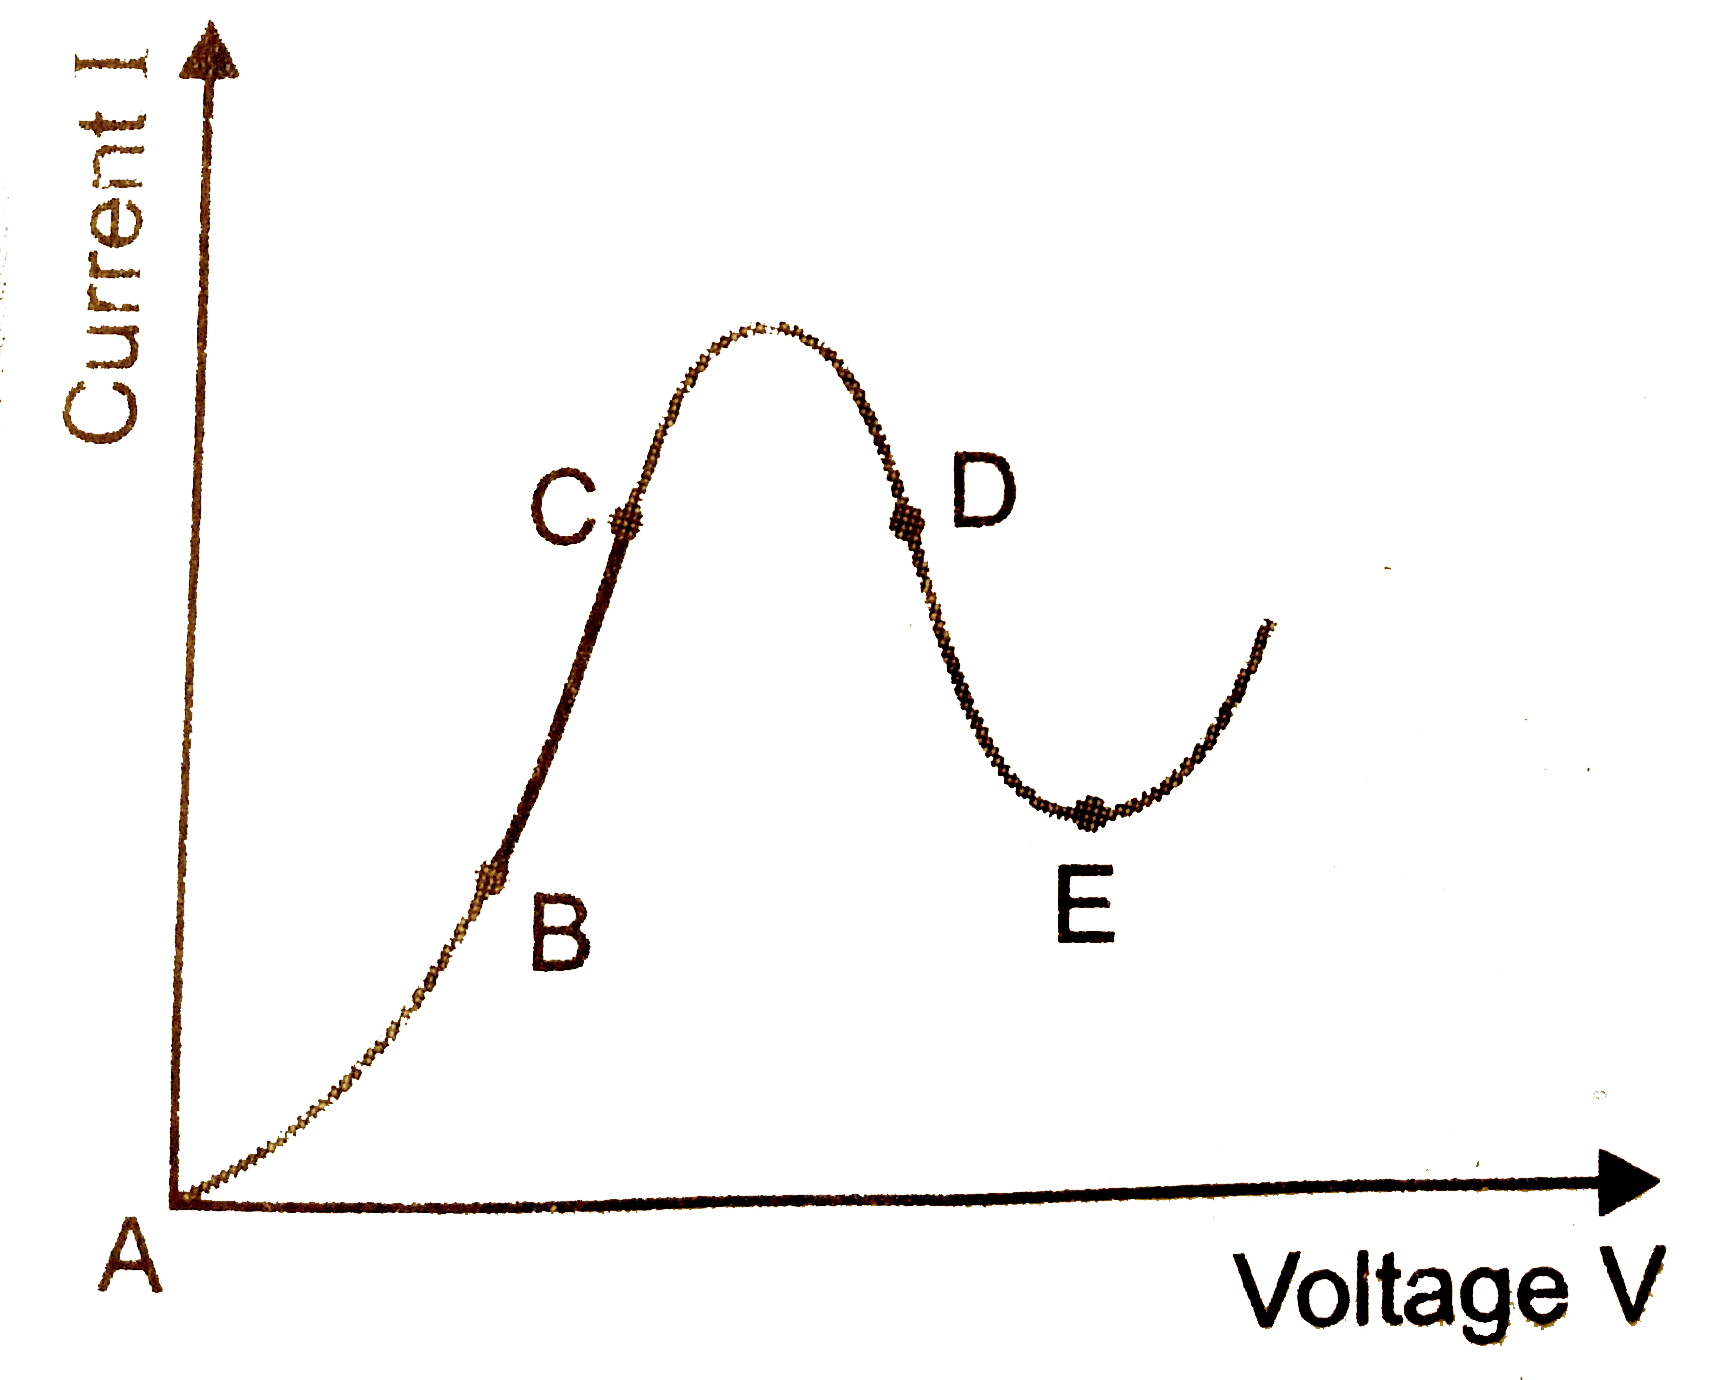
The graph shown in Fig.1.15 represenrts a plot of current versus voltage for a given semiconductor.
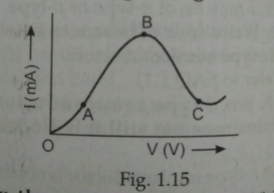
identify the region,if any,over which the semiconductor has a negative resistance.Solution in Punjabi
Step by step video & image solution for The graph shown in Fig.1.15 represenrts a plot of current versus voltage for a given semiconductor.identify the region,if any,over which the semiconductor has a negative resistance. by Physics experts to help you in doubts & scoring excellent marks in Class 12 exams.
Updated on:21/07/2023Topper's Solved these Questions
Similar Questions
Explain the formation of energy bands in solids and hence define conduction band and valence band.
View SolutionExplain the two processes involved in the formation of a p-n junciton diode. Hence defien the term"barrier potential".
View SolutionDefine atomic number.
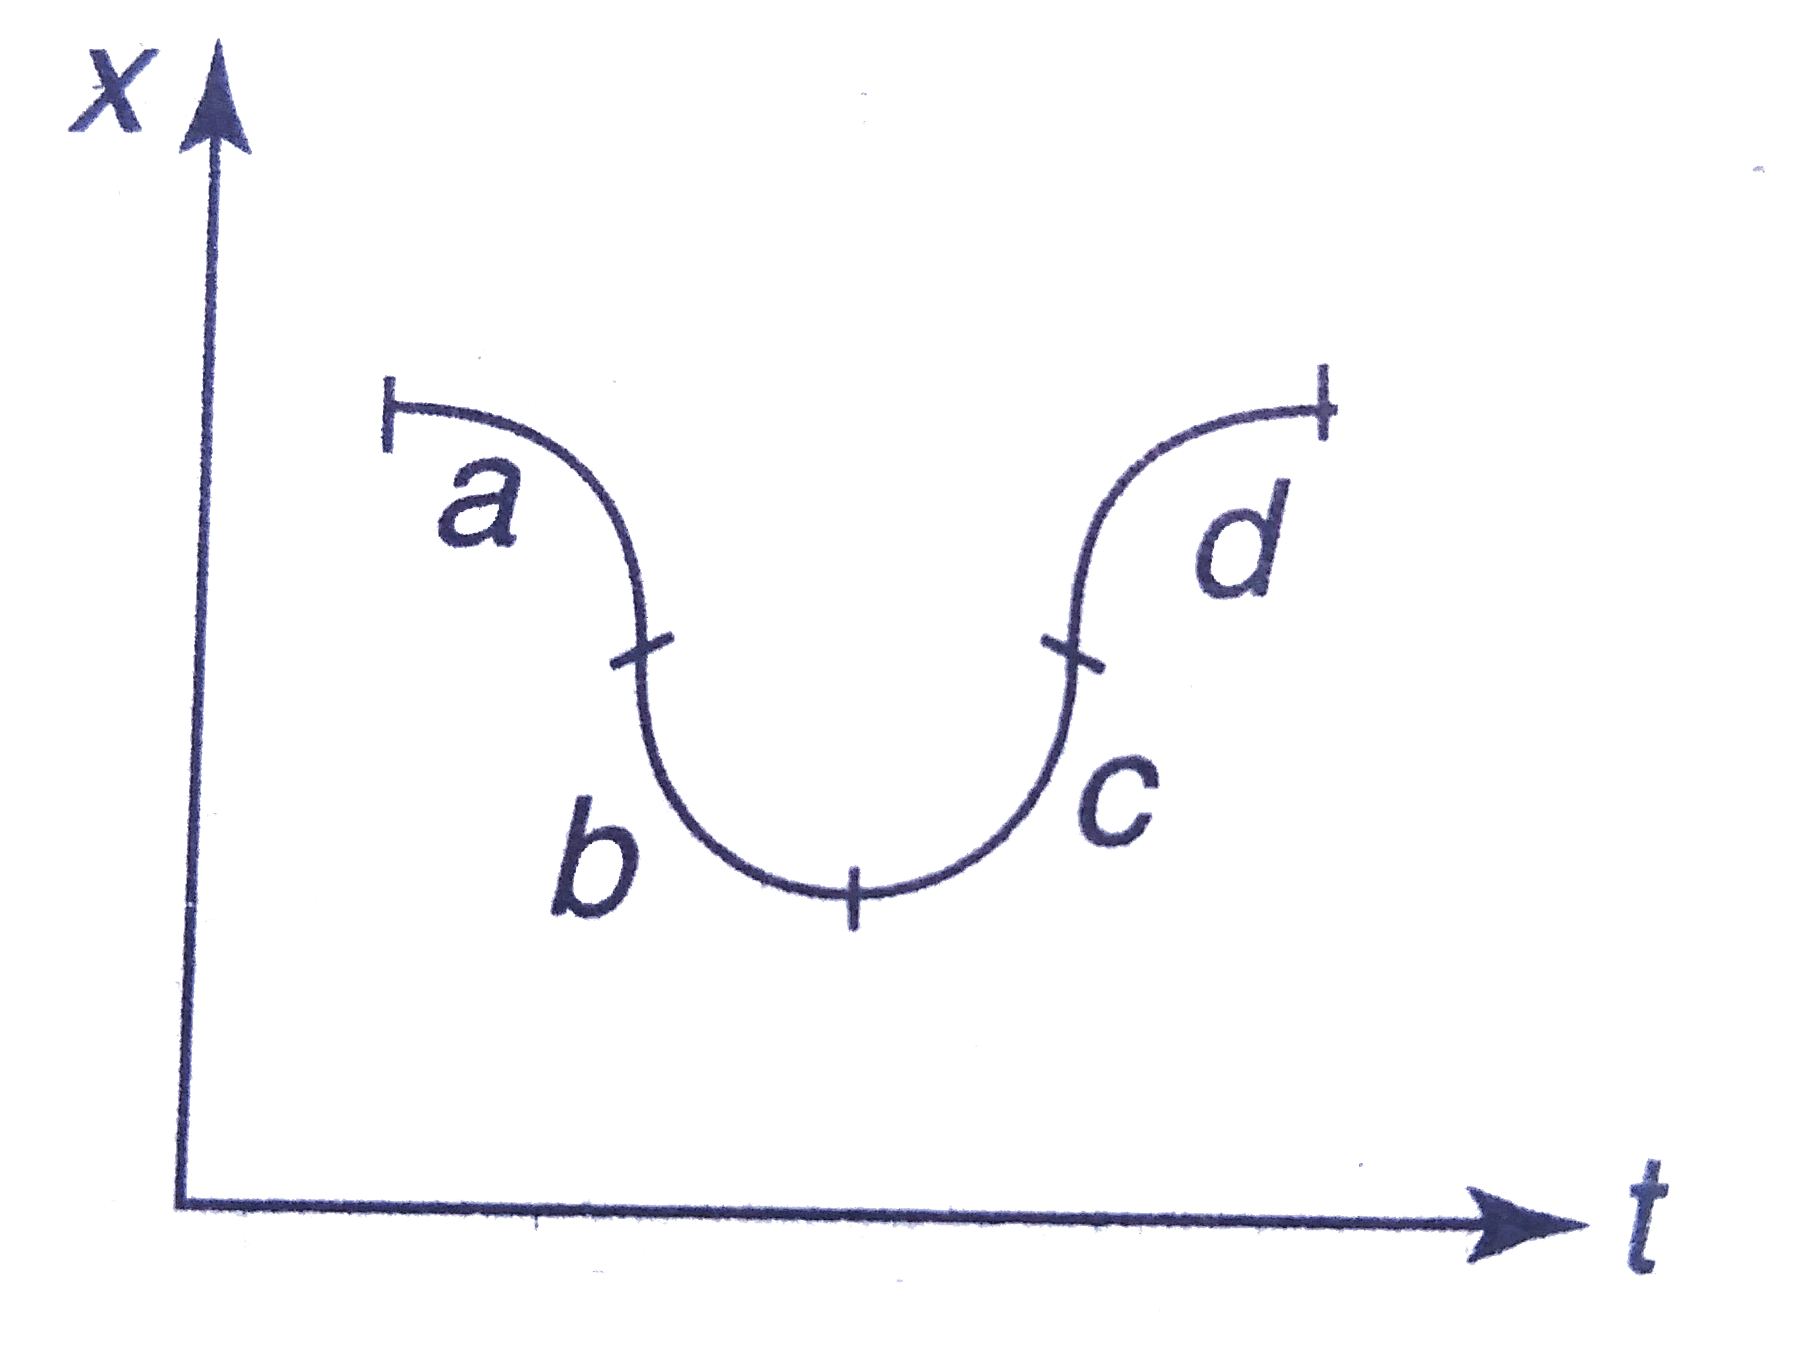
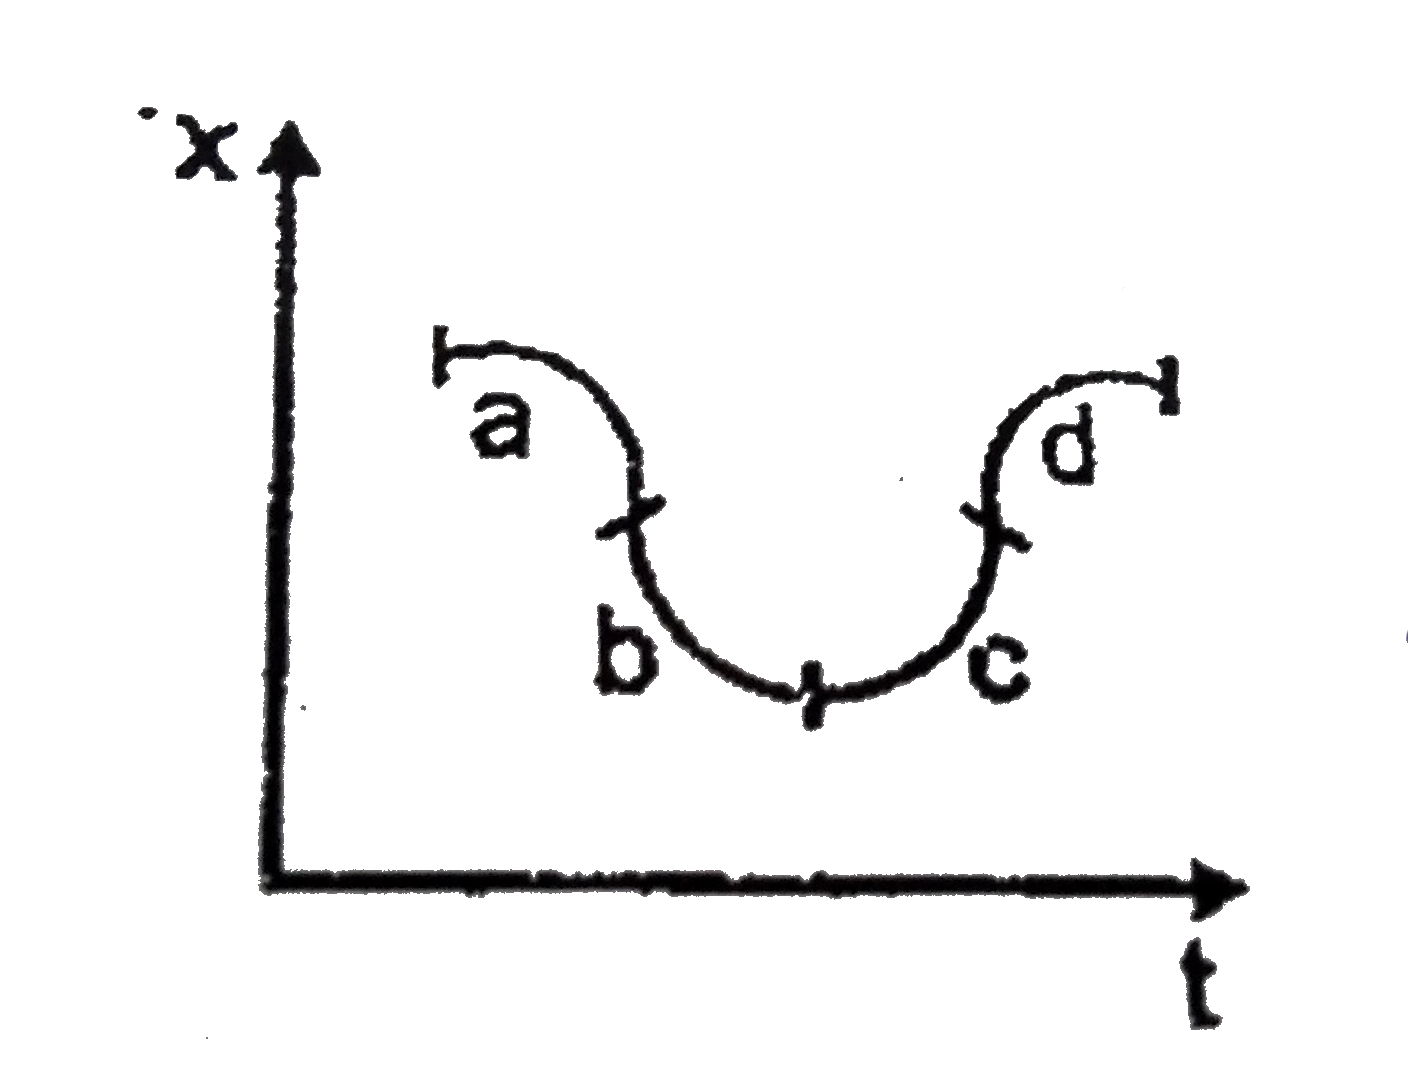
View SolutionThe graph to the right is a plot of position versus time. For which lebeled region is the velocity positive and the acceleration negative ?
View SolutionThe current-voltage graph of a device is shown in figure. The resistance is negative in region.
View SolutionGraph showing the variation of current versus voltage for a material GaAs is shown in figure. Identify the region of (i) negative resistance (ii) where Ohm's law is obeyed.
View SolutionThe graph to the right is a plot of position versus time. For which labeled region is the velocity positive and the acceleration negative?
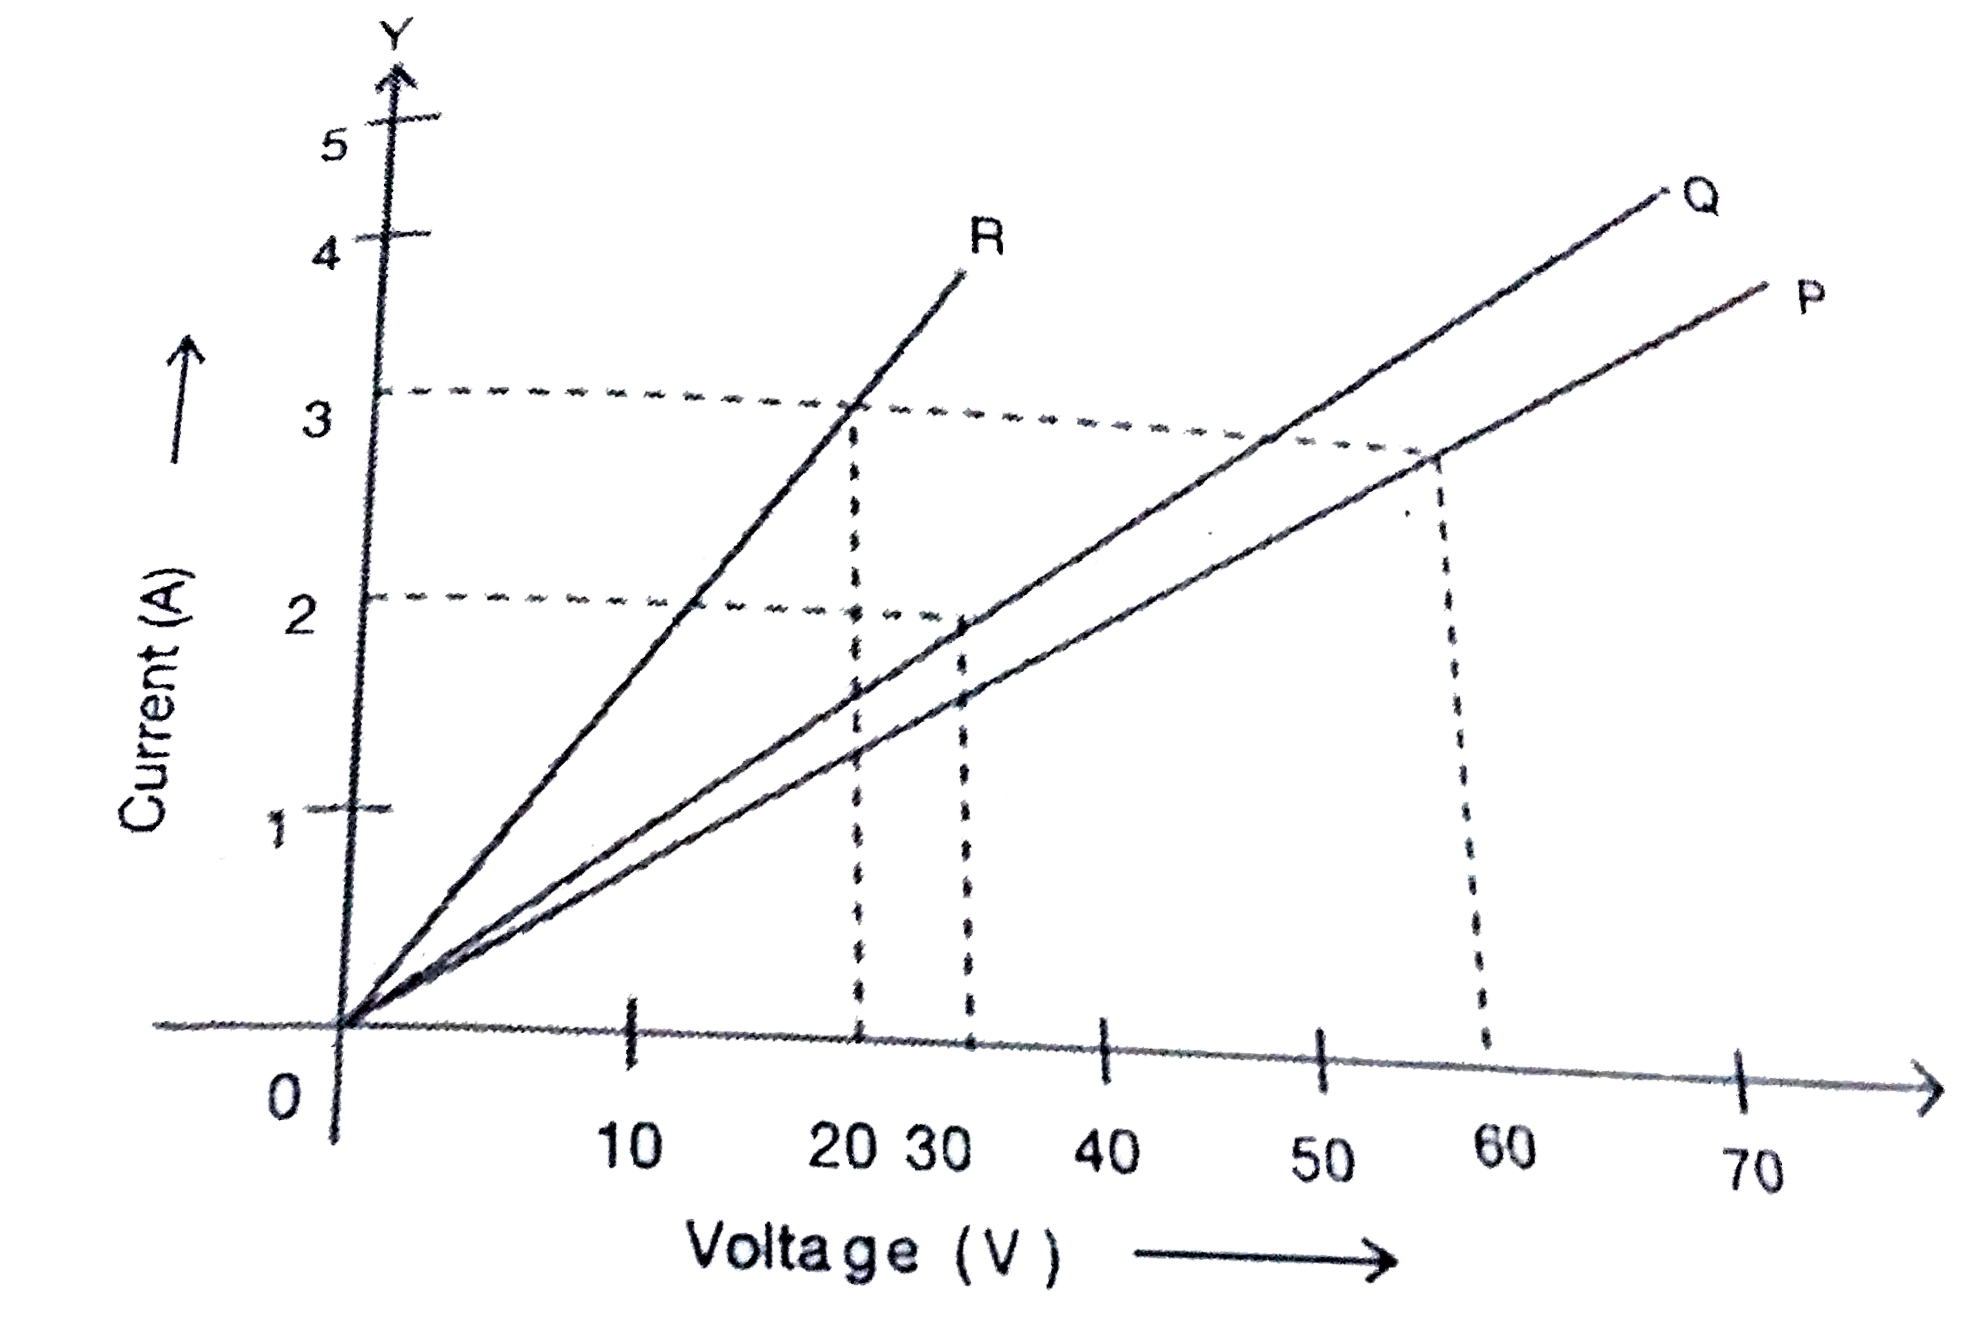
View SolutionThe graph of current versus voltage drop across the three resistors P,Q,R is shown above. Find the ratio of their resistances.
View SolutionPlot a graph showing variation of current versus voltage for the material Ga.
View Solution(a) Draw graph showing the variation of current versus voltage in an electroyte when an external resistance is also connceted.
(b) (i) The graph between resistance (R ) and temperature (T) for Hg is shown in the figure (a). Explain the behaviour of Hg near 4k.
(ii) In which region of the graph shown in the figure (b) is the resistance negative and why?

View SolutionShow the variation of current versus voltage graph for GaAs and mark the I Non-liner region (ii) Negative resistance region.
View Solutionदिया गया आरेख किसी अर्धचालक के लिए विघुत धारा तथा वोलटता के बीच ग्राफ को दर्शाता है| उस क्षेत्र की (यदि पहचान कीजिए जिसमे इस अर्धचालक का प्रतिरोध ऋणात्मक है|

View SolutionPlot a graph showing variation of current versus voltage for the material GaAs
View SolutionGraph showing the variation of current versus voltage for a material GaAs is shown in figure. Identify the region of (i) negative resistance (ii) where Ohm's law is obeyed.
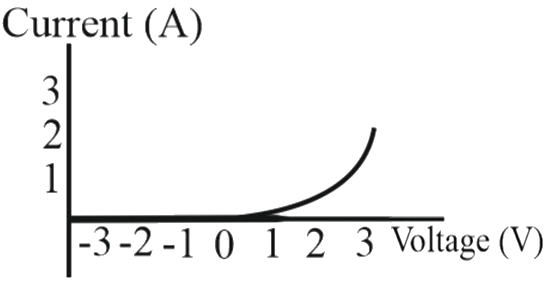
View SolutionShown below is a graph of current versus applied voltage for a diode . Approximately , what is the resistance of the diode for an applied voltage of – 1 V ?
View SolutionThe following graphs represent the current versus voltage and voltage versus current for the six conductors A,B,C,D,E and F. Which conductor has least resistance and which has maximum resistance?
View Solution
