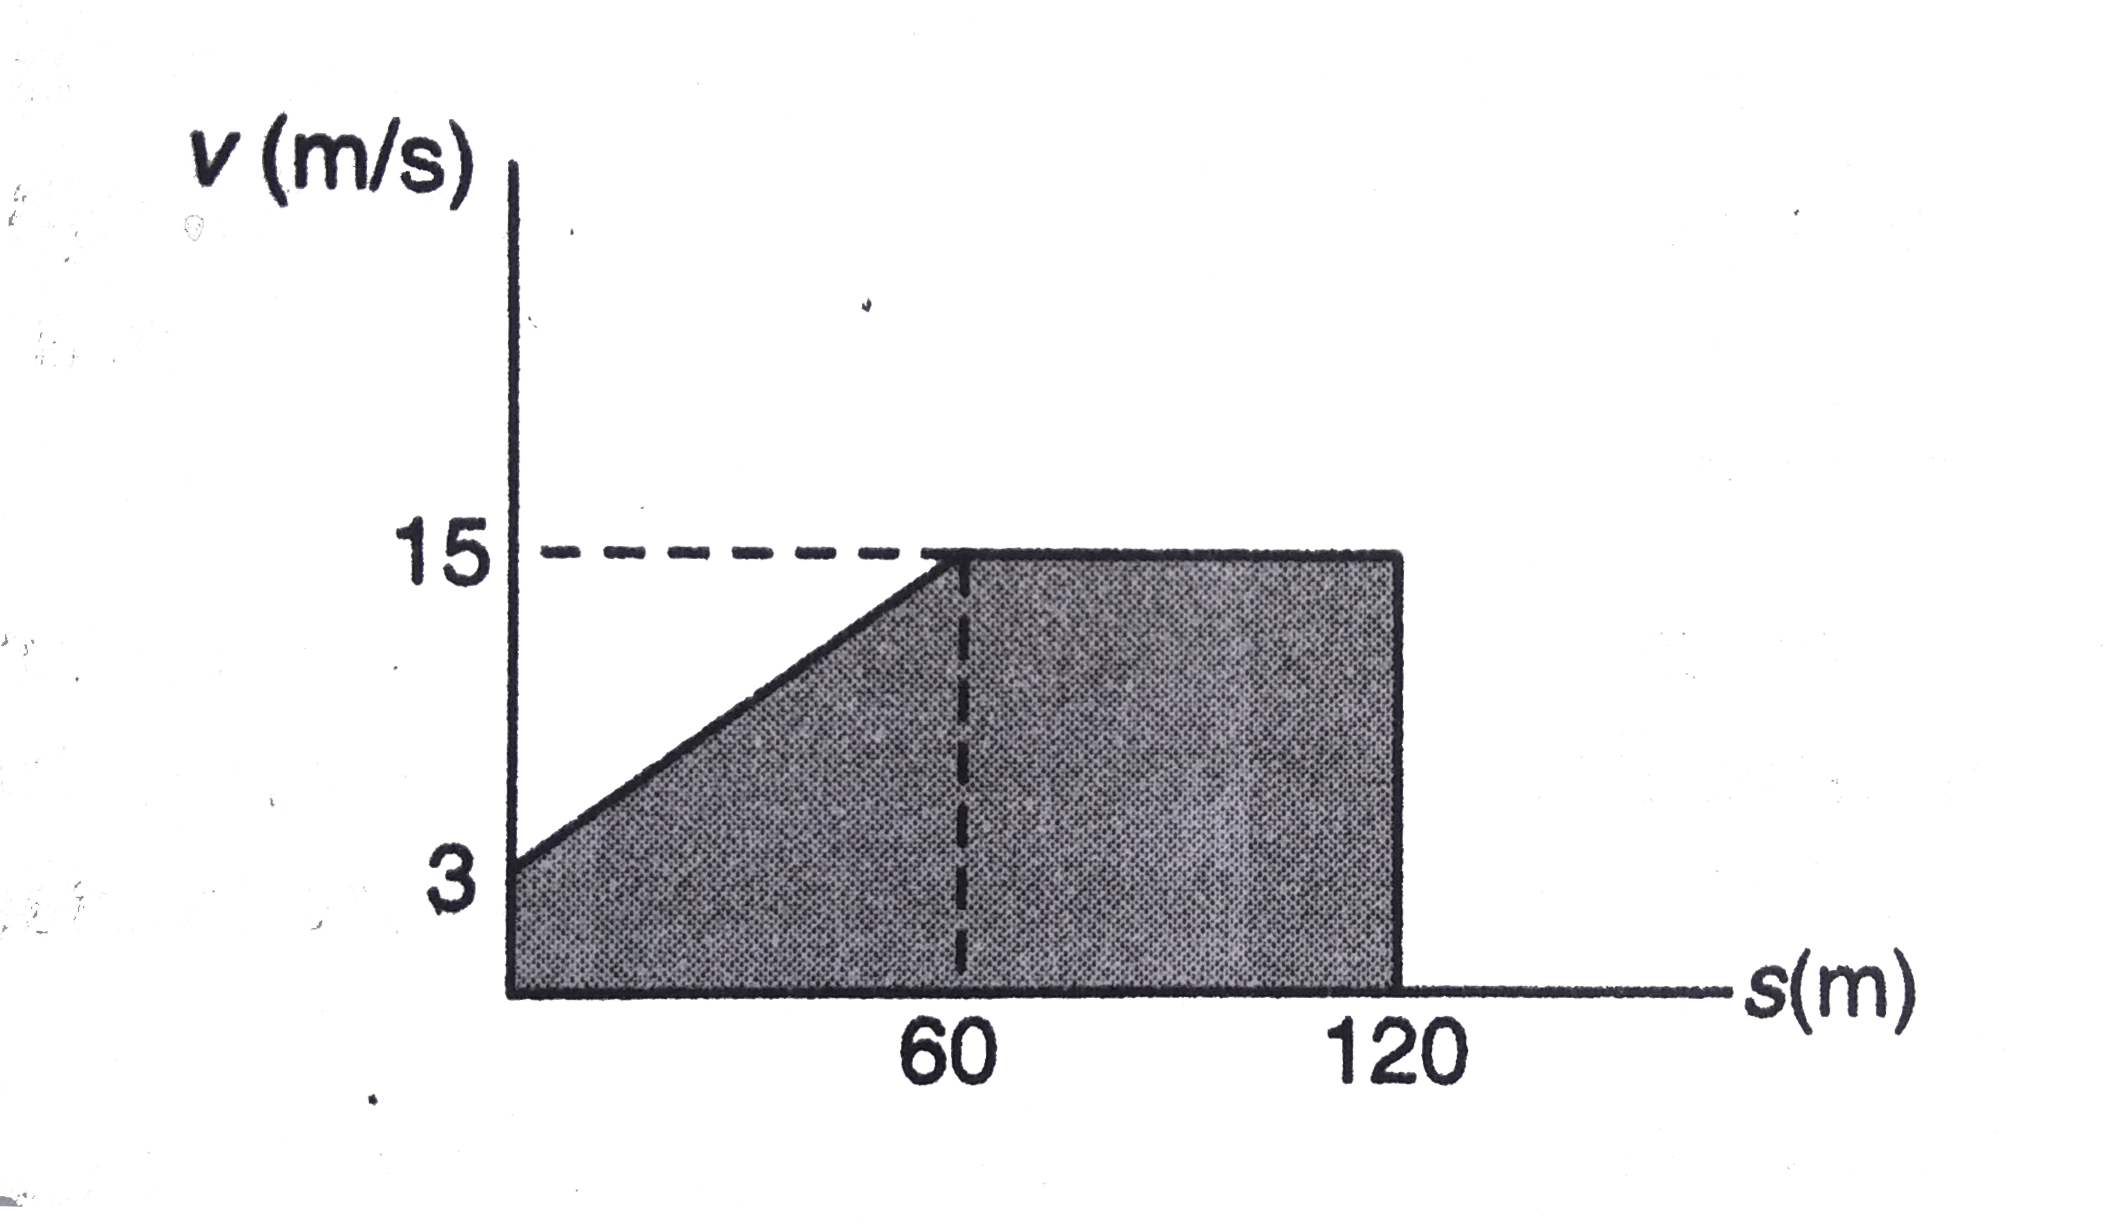
The v-s graph describing the motion of a motorcycle is shown in figure. Construct the a-s graph of the motion and determine the time needed for the motorcycle to reach the position Given In
The correct Answer is:A
For
or
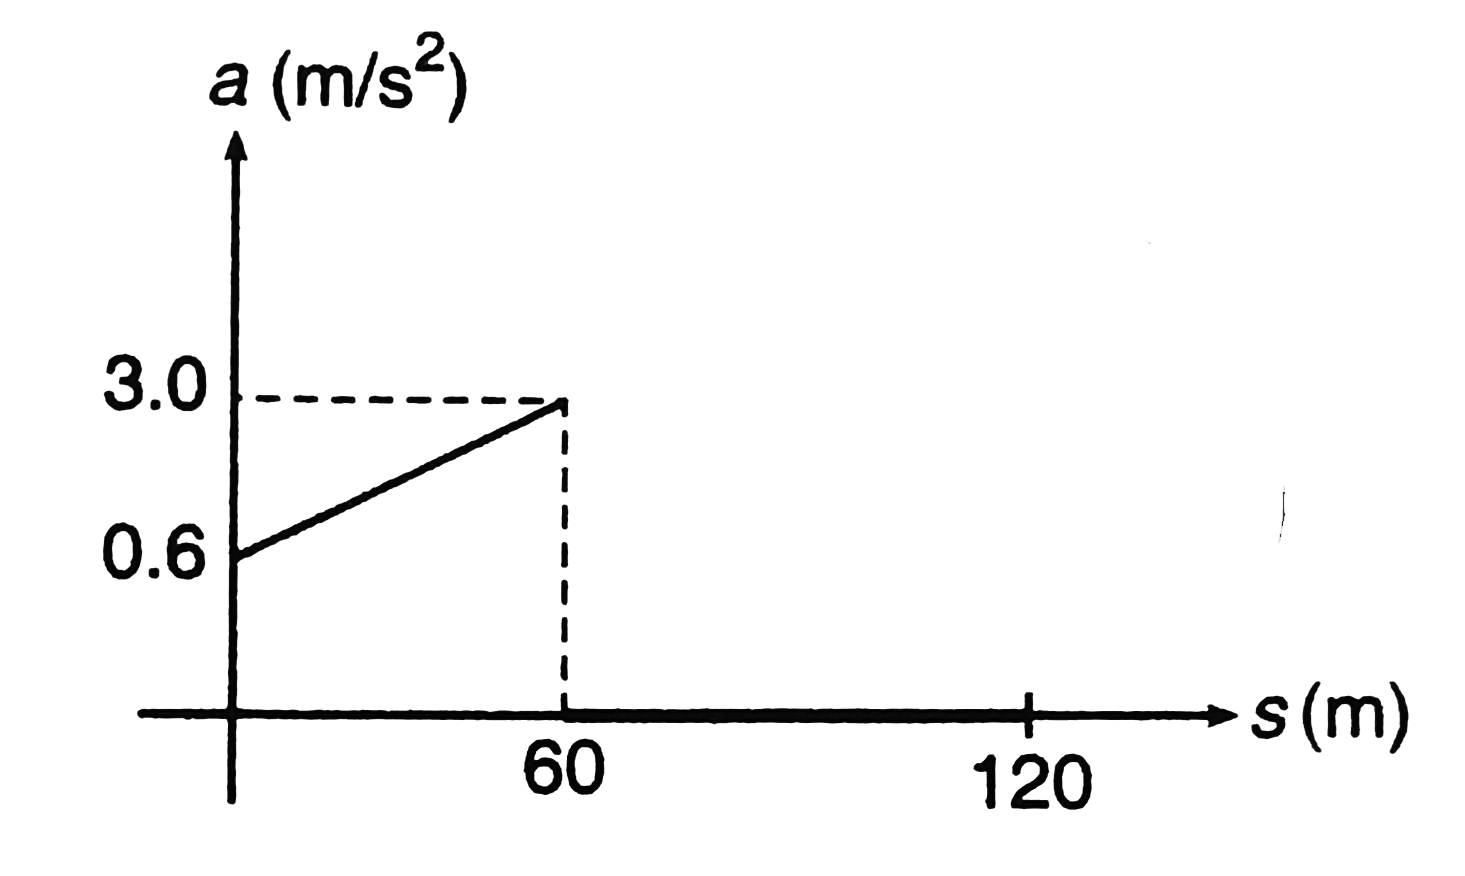
i.e. a-s graph is a straight line.
At
and at
For
v=constant
Therefore, the corresponding a-s graph is shown in
figure.
From Eq. (i),
or
or
or
Time taken to travel next 60m with speed
will be
Total time
Topper's Solved these Questions
- KINEMATICSBOOK - DC PANDEY ENGLISHCHAPTER - KINEMATICSEXERCISE - SCQ_TYPE
39 Videos
- KINEMATICSBOOK - DC PANDEY ENGLISHCHAPTER - KINEMATICSEXERCISE - MCQ_TYPE
23 Videos
- KINEMATICSBOOK - DC PANDEY ENGLISHCHAPTER - KINEMATICSEXERCISE - Comprehension
7 Videos
- GRAVITATIONBOOK - DC PANDEY ENGLISHCHAPTER - GRAVITATIONEXERCISE - (C) Chapter Exercises
45 Videos
- KINEMATICS 1BOOK - DC PANDEY ENGLISHCHAPTER - KINEMATICS 1EXERCISE - INTEGER_TYPE
15 Videos
Similar Questions
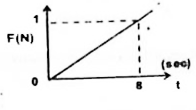
A force-time graph for the motion of a body is shown in figure. Change in linear momentum between 0 and 8 s is:
View SolutionA force lime graph for the motion of a body is as shown in figure. Change in linear momentum between 0 and 6s is:

View SolutionA force-time graph for the motion of a body is shown in fig. change in linear momentum between 0 and 8 s is:-

View SolutionThe car start from rest at x=0 and is subjected to an acceleration shown by the a-s graph.Draw the v-s graph and determine the time needed to travel 60 m.

View SolutionA force-time graph for the motion of a body is shown in fig. Change in linear momentum between 0 and 8s is :
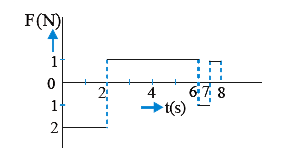
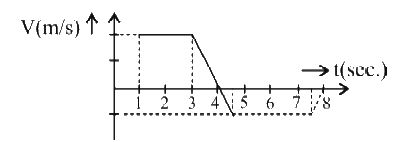
View SolutionThe velocity-time graph of a linear motion is shown in figure. The displacement from the origin after 8 sec is :
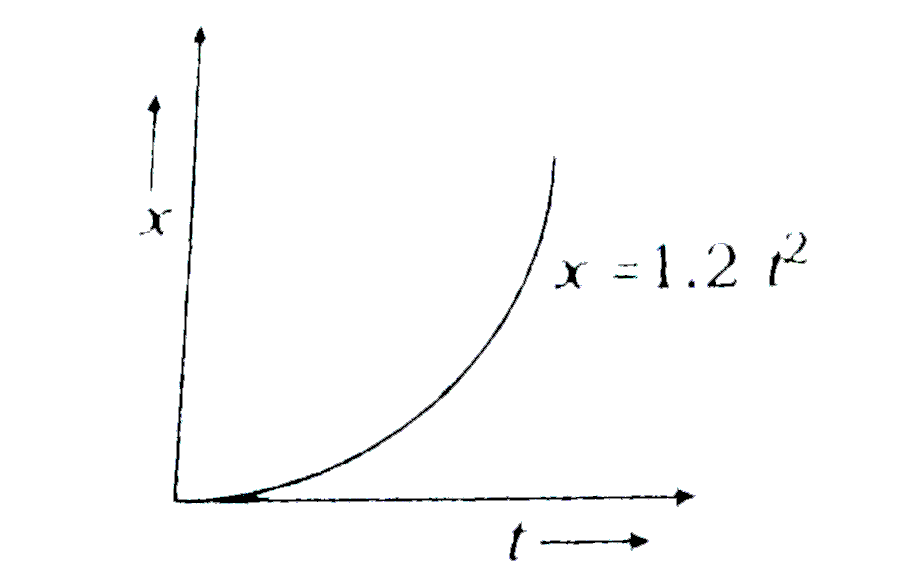
View SolutionFigure given shows the distance - time graph of the motion of a car. It follows from the graph that the car is
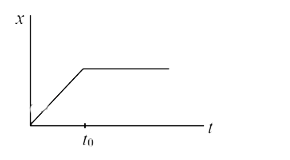
View SolutionFigure shows the position-time graph of a particle moving on the X--axis. Which of these option correctly describes the particle 's motion?
View Solutions-t graph of a particle in motion is shown in Fig. Calculate Average velocity
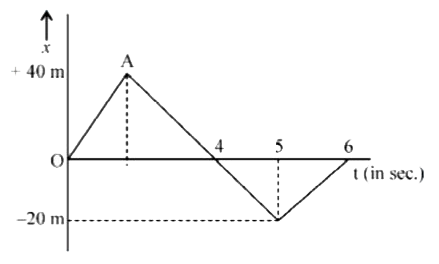
View Solutions-t graph of a particle in motion is shown in Fig. Calculate
Average speed
View Solution
