Which of the following x-t graphs represents the distance-time variation of a body released from the top of a buiding?
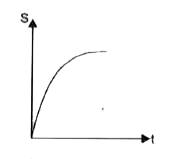
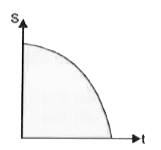
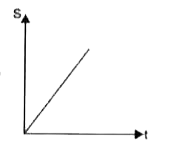
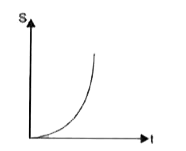
The correct Answer is:D
S=12gt2orS∝t2
Topper's Solved these Questions
- MISCELLANEOUS QUESTIONSBOOK - MCGROW HILL PUBLICATIONCHAPTER - MISCELLANEOUS QUESTIONSEXERCISE - PART-B
99 Videos
- MEASUREMENTBOOK - MCGROW HILL PUBLICATIONCHAPTER - MEASUREMENTEXERCISE - ELEMENTARY QUESTIONS (HIGHER ORDER THINKING QUESTIONS)
13 Videos
- MOTIONBOOK - MCGROW HILL PUBLICATIONCHAPTER - MOTIONEXERCISE - HIGHER ORDER THINKING QUESTIONS
48 Videos
Similar Questions
Which one of the following graphs represents the variation of electric field with distance r from the centre of a charged spherical conductor of radius R?
View SolutionGraph between velocity and displacement is shown in the following figure:
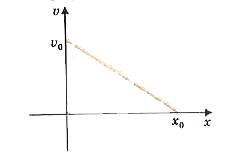
Which of the following graphes represents the correct variation of acceleration with displacement
View Solution
Knowledge Check
Which of the following x-t graphs does not represent periodic motion?
A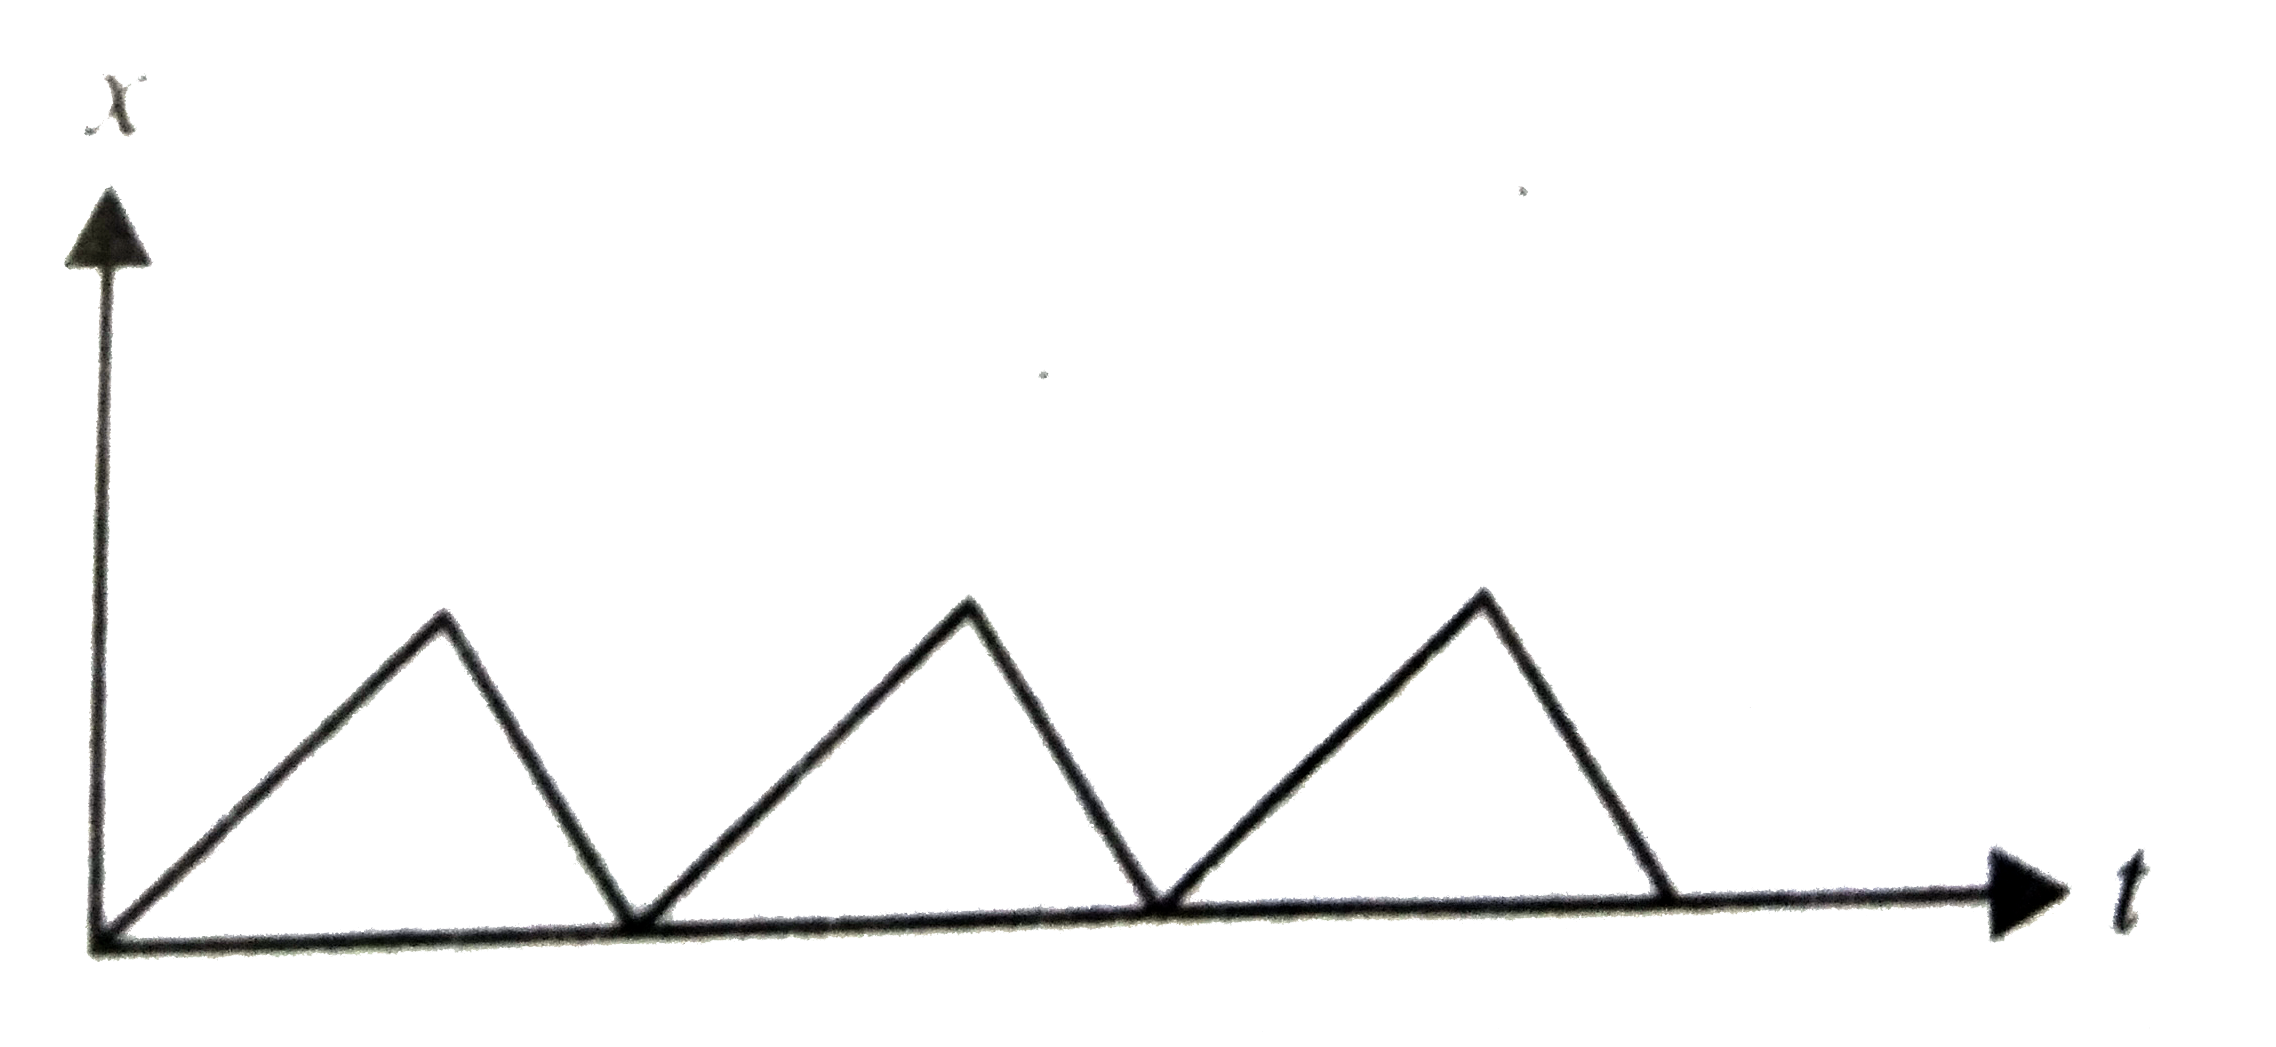 B
B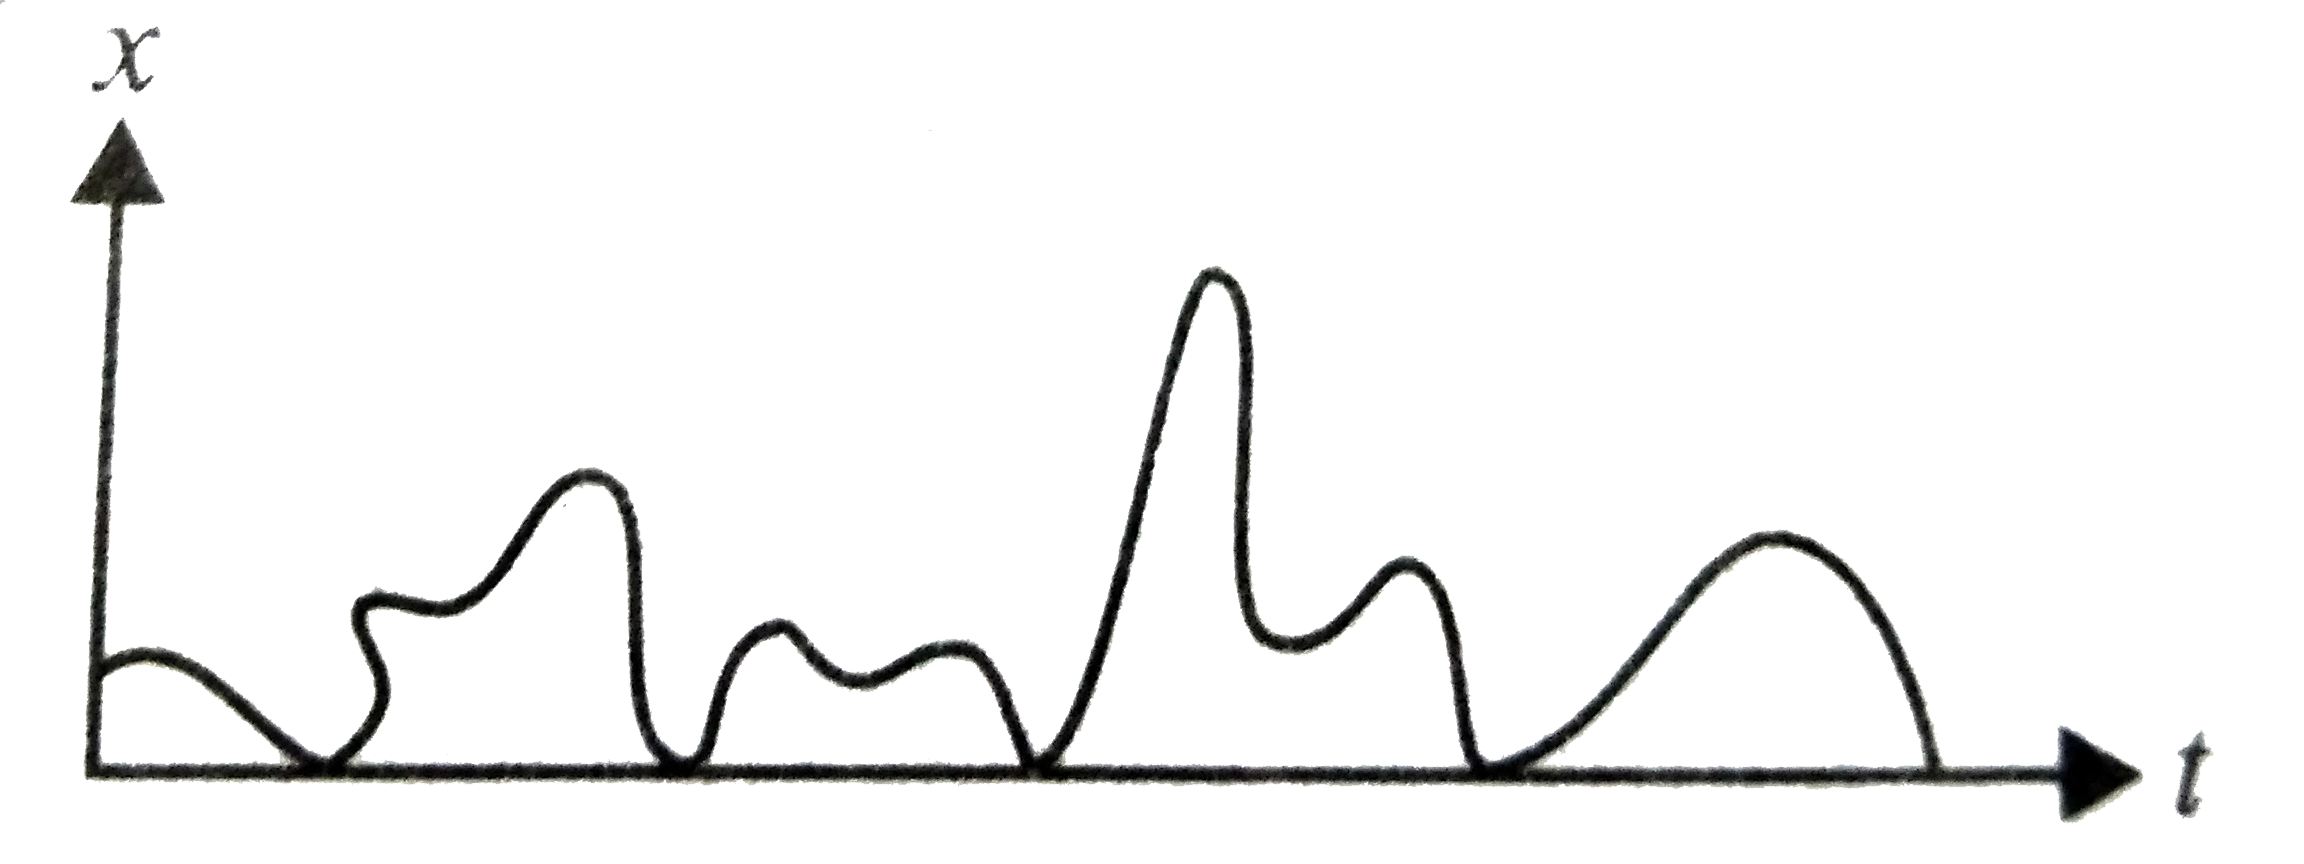 C
C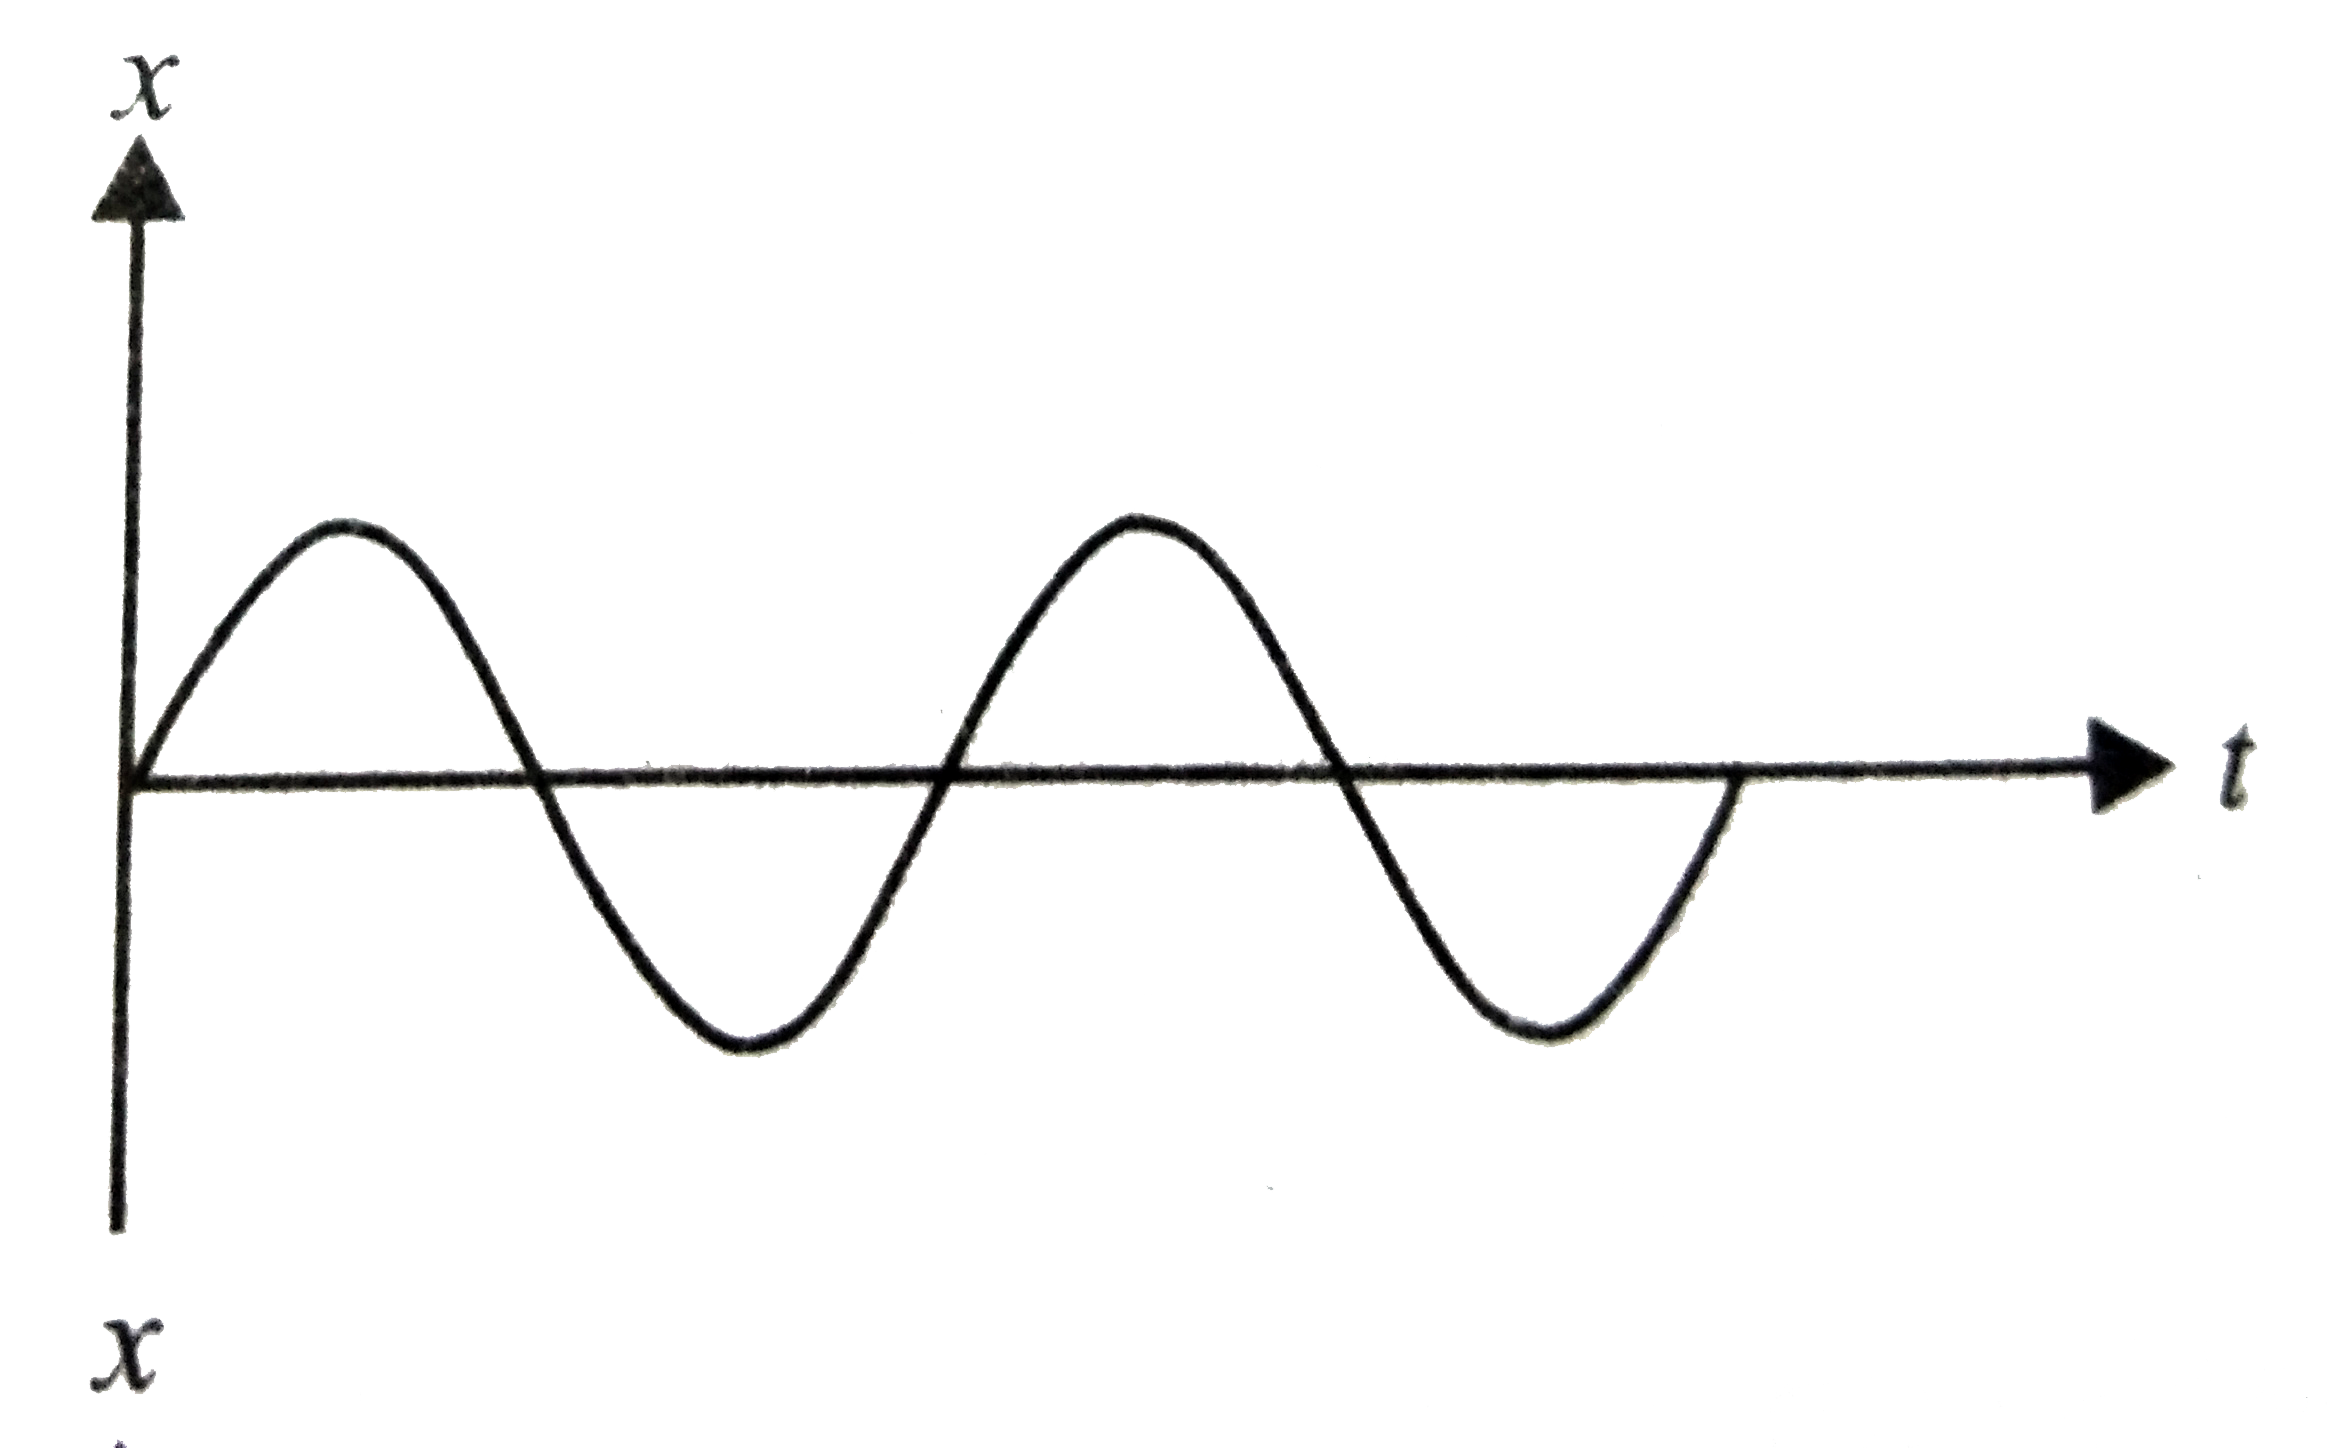 D
D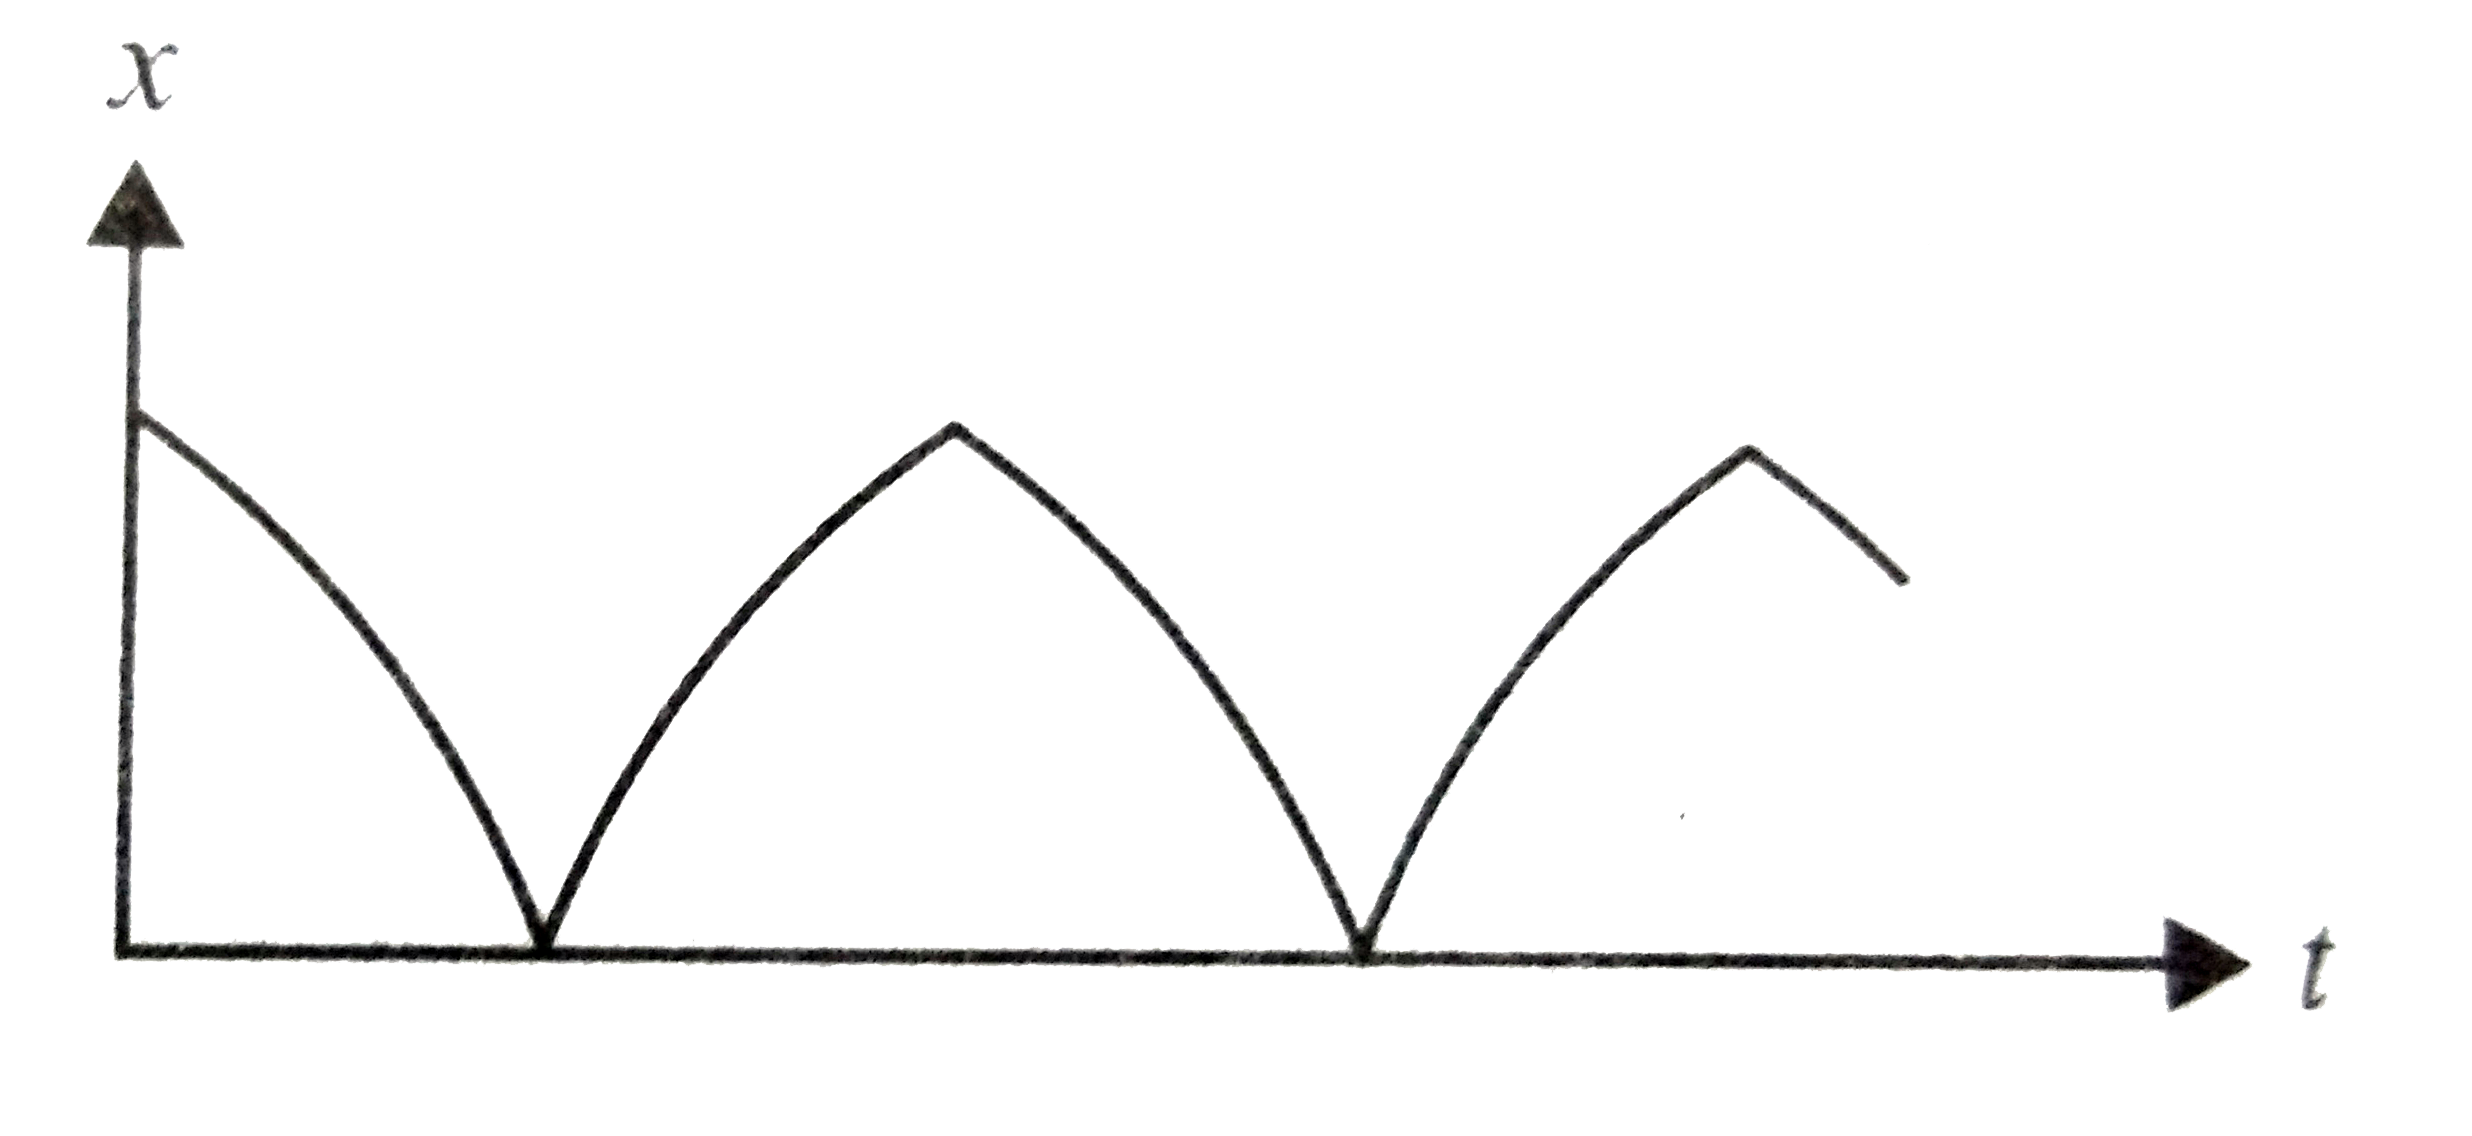
Which of the following graphs represents the displacement (s) -time (t) graph for uniform motion ?
A B
B C
C D
D
Which of the following graph correctly represents velocity-time relationship for a particle released from rest to fall freely under gravity ?
A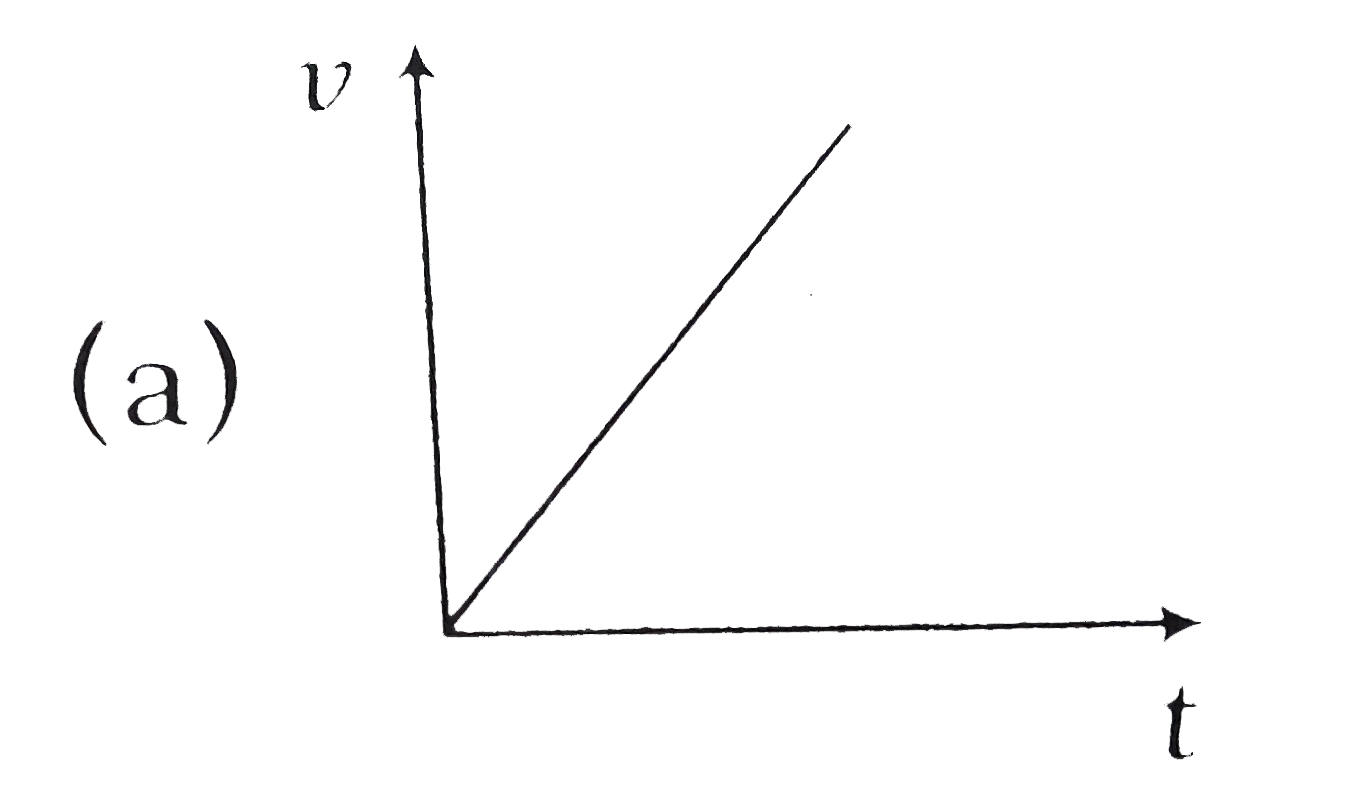 B
B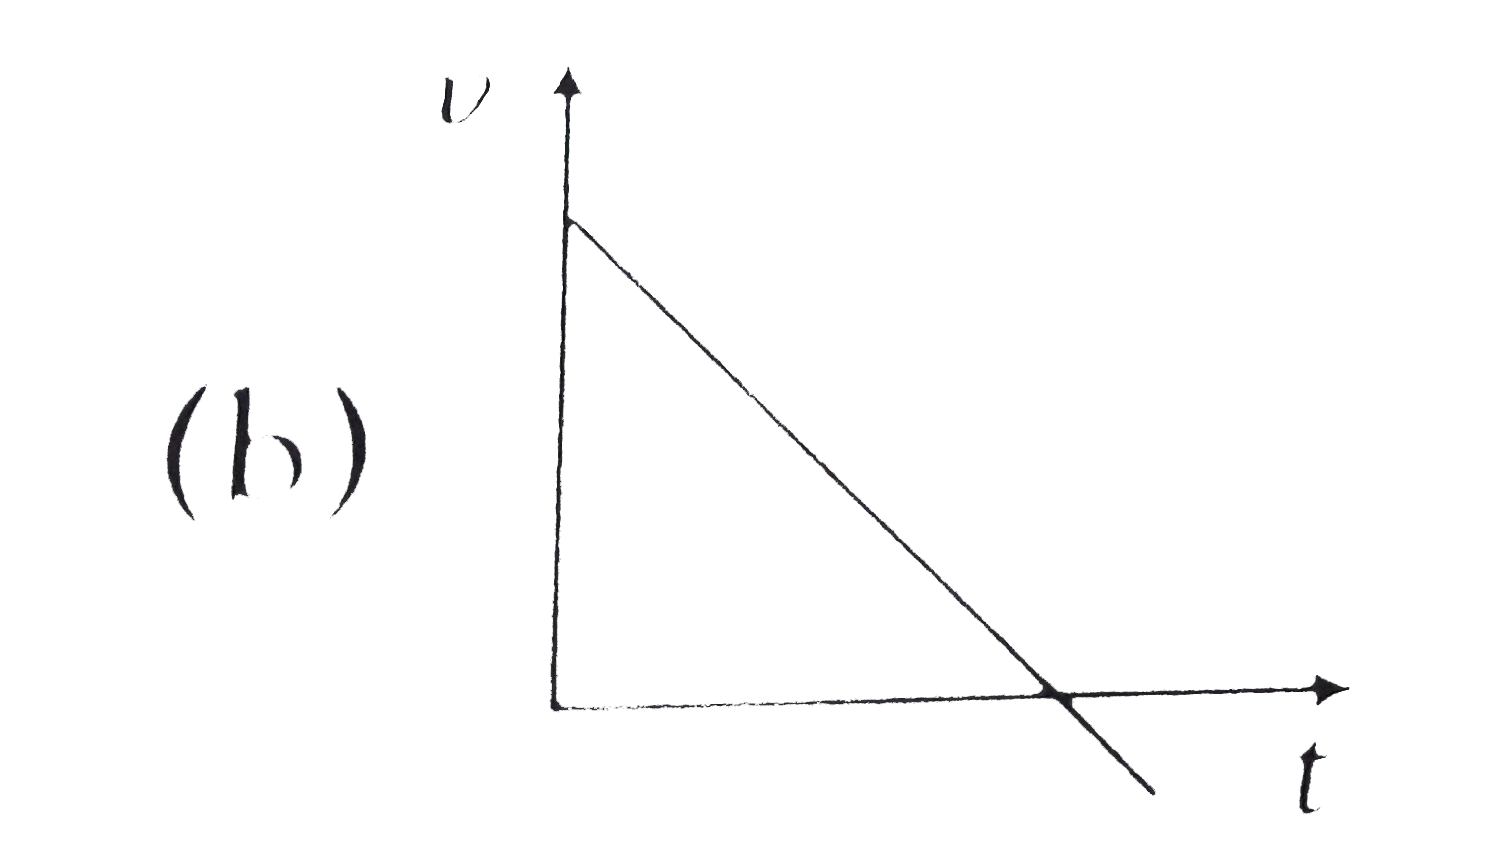 C
C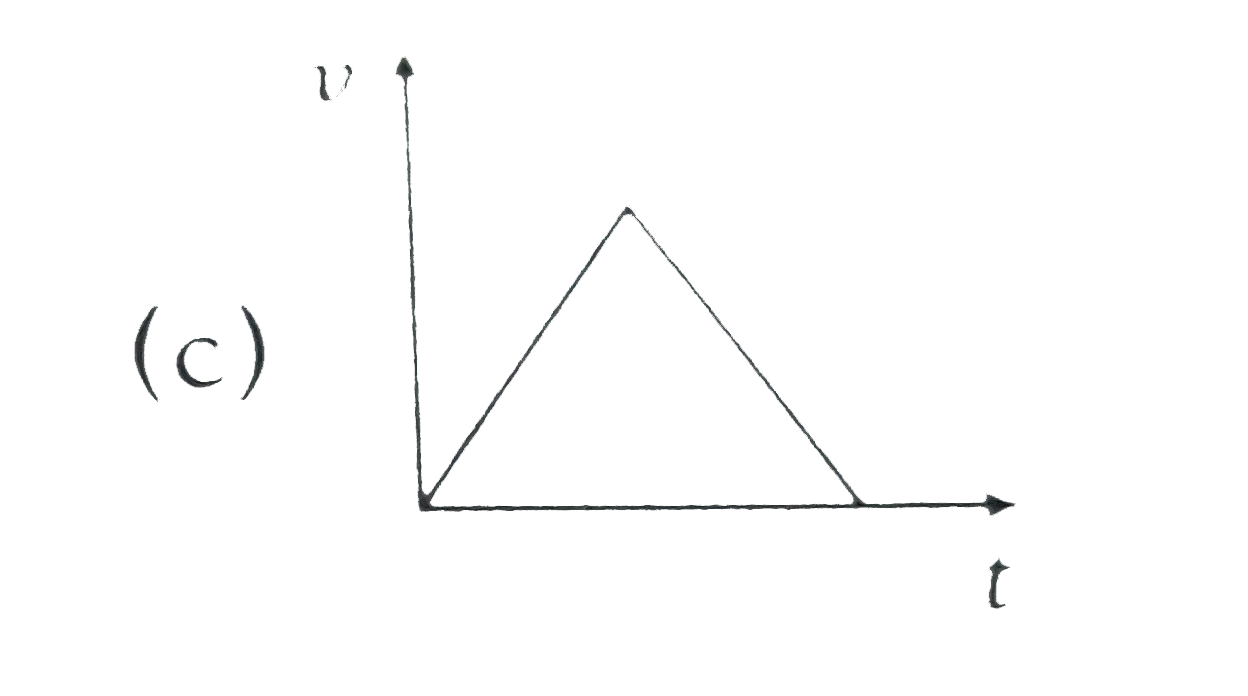 D
D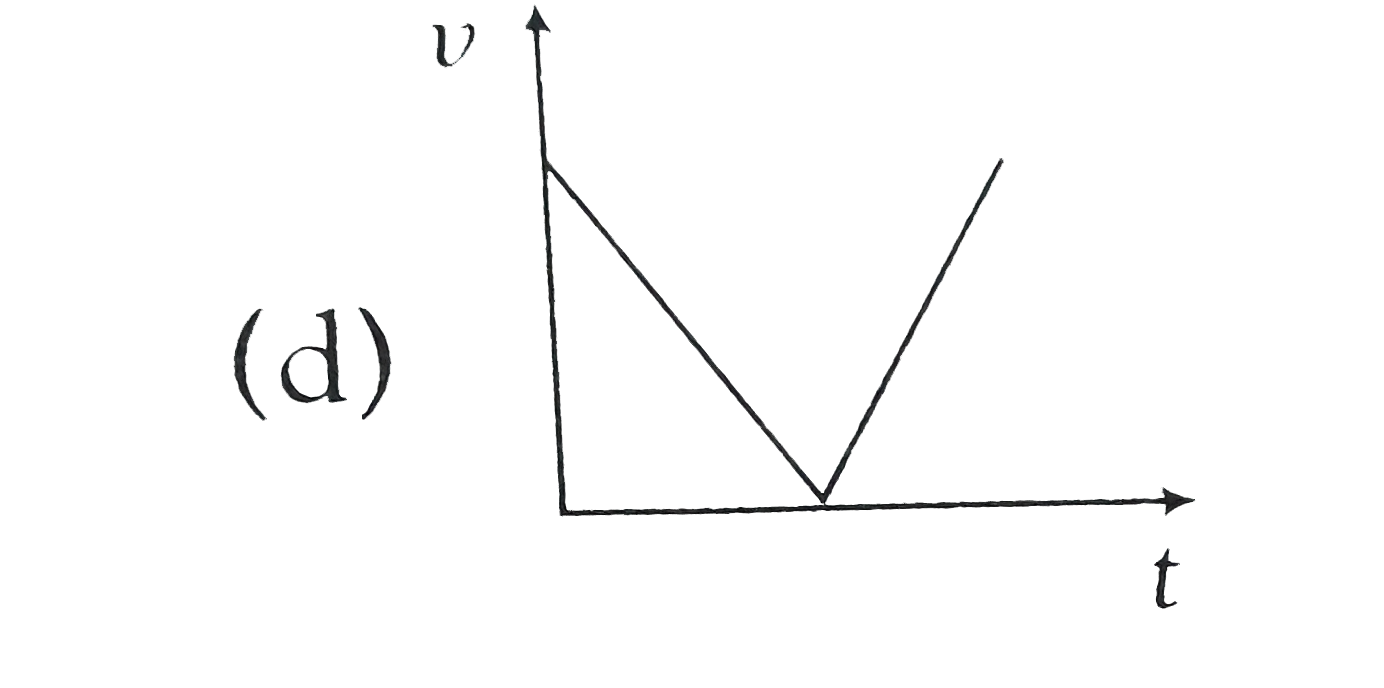
Which of the following represents distance(s)-time(t) graph for a retarded motion?
View SolutionWhich of the following graphs best represents the variation of acceleration 'a' with displacement x?
View Solutionwhich of the following graph represents the variation of resistivity (ρ) with temperature (T) for copper?
View SolutionWhich of the following graphs represent the correct variation of inductive reactance XL with frequency υ?
View SolutionWhich of the following graphs represents the variation of activity (A) of a radioactive substance with time (t).
View Solution