Arranging the data in the form of a table is called……………
To answer the question "Arranging the data in the form of a table is called……………", we can follow these steps:
1. Understanding the Concept: We need to identify what it means to arrange data in a table format. A table typically consists of rows and columns that help organize information systematically.
2. Identifying the Term: The specific term used to describe the arrangement of data in a table format is important.
3. Defining the Term: The process of organizing data into rows and columns is known as "Tabulation."
4. Final Answer: Therefore, the answer to the question is: "Arranging the data in the form of a table is called Tabulation."
Topper's Solved these Questions
- DATA HANDLING BOOK - RS AGGARWALCHAPTER - DATA HANDLING EXERCISE - EXERCISE 22
10 Videos
- CONSTRUCTIONS ( USING RULER AND A PAIR OF COMPASSES )BOOK - RS AGGARWALCHAPTER - CONSTRUCTIONS ( USING RULER AND A PAIR OF COMPASSES )EXERCISE - TEST PAPER-14 (D.) Write T for true and F for false for each of the statements given below:
6 Videos
- DECIMALSBOOK - RS AGGARWALCHAPTER - DECIMALSEXERCISE - TEST PAPER-7
29 Videos
Similar Questions
Knowledge Check
The process of presenting data in the form of a table in called:
AorganisationBclassificationCpresentationDtabulationThe presentation of data in the form of pictures is called ________ .
ABar graphBPictographCTally marksDNone of theseThe aggregate of data is called:
AStatisticsBediting of dataCanalysis of dataDcollection of data
Following tables shows estimates of cost of production of certain commodities. Present the data in the form of sub divided bar diagram:

View SolutionFollowing are the data about the number of men and women in different age groups in a society. Present the information in the form of a two-way table.

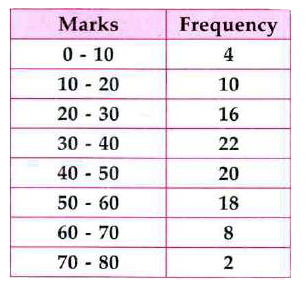
View SolutionThe following table gives the marks scored by 100 students in an entrance examination

Represent this data in the form of a histogram.
View SolutionThe following table gives data on birth rate in India according to census survey of different years. Present the information the form of a vertical/simple bar diagram.

View SolutionDraw a bar graph using the data given in the following table.

View Solution


