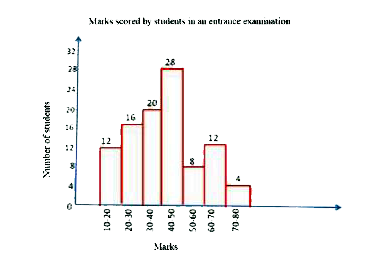
Compare the modal ages of two groups of students appearing for an entrance examination

Case I. Computation of modal Age of Group A:
In group A, class 18-20 has the maximum frequency
So, 18-20 is the modal class and its frequency is 78
∴xk=18,fk=78,fk−1=50,fk+1=46andh=2
∴ mode , Mo=xk+{h×(fk−fk−1)2fk−fk−1−fk+1
=18+{2×(78−50)(2×78−50−46)}=18+{2×2860}
18+1415=18+0.93=18.93
Case II. Computation of Modal Age of Group B
In group B , class 18-20 has the maximum is 89
So , 18-20 is the modal class and its frequency is 89
xk=18,fk=89,fk−1=54,fk+1=40andh=2
∴ mode , Mo=xk+{h×(fk−fk−1)2fk−fk−1−fk+1
=18+{2×(89−54)(2×89−54−40)}=18+(2×35)(178−94)
=18+7084=18+56=18+0.83=18.83
Hence , the modal ages of students in group A and are 18.93 years respectively .
∴ (modal age in group A)>(modal age in group B)
Topper's Solved these Questions
- BOOK - RS AGGARWALCHAPTER - MEAN,MEDAN,MODE OF GROUPED,DATA CUMULATIVE FREQUENCY GRAPH AND OGIVE EXERCISE - MISCELLANEOUS QUESTIONS ON MEAN,MODE AND MEDIAN1videos
MEAN,MEDAN,MODE OF GROUPED,DATA CUMULATIVE FREQUENCY GRAPH AND OGIVE
- BOOK - RS AGGARWALCHAPTER - MEAN,MEDAN,MODE OF GROUPED,DATA CUMULATIVE FREQUENCY GRAPH AND OGIVE EXERCISE - Exercise 18A2videos
MEAN,MEDAN,MODE OF GROUPED,DATA CUMULATIVE FREQUENCY GRAPH AND OGIVE
- BOOK - RS AGGARWALCHAPTER - MEAN,MEDAN,MODE OF GROUPED,DATA CUMULATIVE FREQUENCY GRAPH AND OGIVE EXERCISE - Test Yourself18videos
MEAN,MEDAN,MODE OF GROUPED,DATA CUMULATIVE FREQUENCY GRAPH AND OGIVE
- BOOK - RS AGGARWALCHAPTER - LINEAR EQUATIONS IN TWO VARIABLES EXERCISE - QUESTION2videos
LINEAR EQUATIONS IN TWO VARIABLES
- BOOK - RS AGGARWALCHAPTER - PERIMETER AND AREA OF PLANE FIGURES EXERCISE - TEST YOURSELF (SHORT -ANSWER QUESTIONS)1videos
PERIMETER AND AREA OF PLANE FIGURES
Similar Questions
Knowledge Check
- Question 1 - Select One
He has a SECURE position in the entrance examination
ArigidBprecariousCstaticDsecondary - Question 2 - Select One
The given Venn diagram shows a total of 50 students who appeared for three different examinations : A, B, and C. All have appeared for at least one examination. How many appeared for examination A and B but not C ?
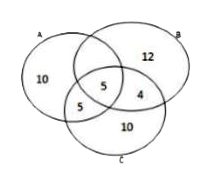 AA) 5BB) 10CC) 4DD) 6
 - Question 3 - Select One
In 1998, ratio of the numbers of students taking examinations in x and z states are respectively 3:5:6. Next year, the numbers of students are increased by 20%, 10% and 20% respectively. If ratio of the numbers of students in states x and z is 1 : 2, then find the number of students who sit to take examination in 1998.
A7200B6000C7500DData inadequate
The following table gives the marks scored by 100 students in an entrance examination
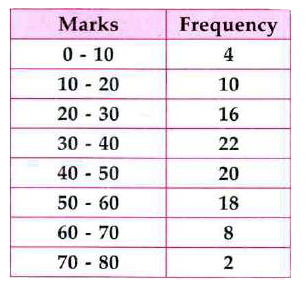
Represent this data in the form of a histogram.View SolutionIn an examination, 8% of the students fail. What percentage of the students pass? If 1650 students appeared in the examination, how many passed?
View SolutionExpress the following ratios in the language of daily life: In an examination, the ratio of the number of students passing the examination to the total number of students that appeared in the examination is 4:5. Water is formed by combining volumes of oxygen and hydrogen in the ratio 1:2. To dilute an acid, students were asked to mix acid and water in the ratio 2:3.
View SolutionStudy the following table and answer question.
Number of students appeared in an examination from five cities :
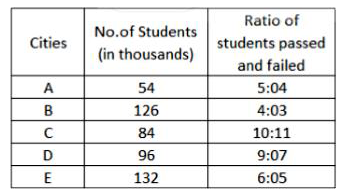
The ratio of the total number of students passed in the examination from cities A and D to that of students failed from cities B and E ?View SolutionStudy the following table and answer question.
Number of students appeared in an examination from five citie s:
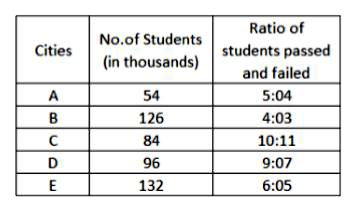
The total number of students who appeared in the examination from cities C and D is what percent more than the total number of students who failed in cities A, B and E ? (nearest to an integer)View Solution


