Consider this data collected from a survey of a colony

Draw a double bar graph choosing an apropriate scale
What do you infer from the bar graph
Step by step video & image solution for Consider this data collected from a survey of a colony Draw a double bar graph choosing an apropriate scale What do you infer from the bar graph by Maths experts to help you in doubts & scoring excellent marks in Class 7 exams.
Topper's Solved these Questions
- BOOK - MTG IIT JEE FOUNDATIONCHAPTER - DATA HANDLINGEXERCISE - NCERT Section (Exercise - 3 .4 )8videos
DATA HANDLING
- BOOK - MTG IIT JEE FOUNDATIONCHAPTER - DATA HANDLINGEXERCISE - Exercise (Level - 1) M.C.Q35videos
DATA HANDLING
- BOOK - MTG IIT JEE FOUNDATIONCHAPTER - DATA HANDLINGEXERCISE - NCERT Section (Exercise - 3 .2 )9videos
DATA HANDLING
- BOOK - MTG IIT JEE FOUNDATIONCHAPTER - CONGRUENCE OF TRIANGLES EXERCISE - Olympiad/HOTS Corner10videos
CONGRUENCE OF TRIANGLES
- BOOK - MTG IIT JEE FOUNDATIONCHAPTER - EXPONENTS AND POWERSEXERCISE - OLYMPIAD/HOTS CORNER15videos
EXPONENTS AND POWERS
Similar Questions
Consider this data collected from a survey of a colony

Which sport is most popular ?View SolutionObserve the following data:

(a) Draw a double bar graph choosing an appropriate scale. What do you infer from the bar graph?
(b) Which class has the maximum number of students?
(c) In which class, the difference of total students and number of students present is minimum?
(d) Find the ratio of number of students present to the total number of students of Class IX.
(e) What per cent of Class VI students were absent?View Solution
Knowledge Check
- Question 1 - Select One or More
How is a histogram different from bar graph
AHistogram is same as bar graph but joined together.Bno differenceCWe use class-intervals in histogram instead to variables.D(A) &(B) both are correct
Consider this data collected from a survey of a colony

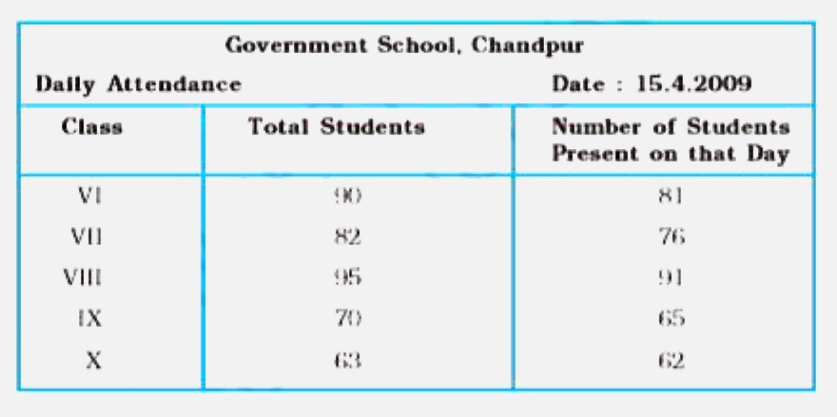
Which is more preferred, watching or participating in sports ?View SolutionOn a particular day in a school, the attendance in each of the classes from VI to X has been recorded as under
Draw a double bar graph, choosing an appropriate scale. Using the bar graph, answer the questions given below

(i) Which class has the maximum number of students (ii) Find the ratio of number of students present to the total number of students in Class VII. (iii) What percent of Class IX students were absentView SolutionIn a public library, the following observations were recorded by the librarian in a particular week:

(a) Draw a double bar graph choosing an appropriate scale.
(b) On which day, the number of readers in the library was maximum?
(c) What is the mean number of magazine readers?View SolutionIn a public library, the following observations were recorded by the librarian in a particular week:

(a) Draw a double bar graph choosing an appropriate scale.
(b) On which day, the number of readers in the library was maximum?
(c) What is the mean number of magazine readers?View SolutionWhat do you infer from Sam’s letter to Charley?
View SolutionWhat do you infer from Sam's letter to Charley?
View SolutionThe performance of a student in 1st Term and 2nd Term is given.

Has the performance gone down in any subjectView Solution

