In a public library, the following observations were recorded by the librarian in a particular week:

(a) Draw a double bar graph choosing an appropriate scale.
(b) On which day, the number of readers in the library was maximum?
(c) What is the mean number of magazine readers?
Step by step video & image solution for In a public library, the following observations were recorded by the librarian in a particular week: (a) Draw a double bar graph choosing an appropriate scale. (b) On which day, the number of readers in the library was maximum? (c) What is the mean number of magazine readers? by Maths experts to help you in doubts & scoring excellent marks in Class 7 exams.
Updated on:21/07/2023Topper's Solved these Questions
- DATA HANDLINGBook:NCERT EXEMPLARChapter:DATA HANDLINGExercise:THINK AND DISCUSS
Explore 3 Videos
- DATA HANDLINGBook:NCERT EXEMPLARChapter:DATA HANDLINGExercise:EXERCISE(TRUE OR FALSE)
Explore 18 Videos
- COMPARING QUANTITIESBook:NCERT EXEMPLARChapter:COMPARING QUANTITIESExercise:THINK AND DISCUSS
Explore 24 Videos
- EXPONENTS AND POWERSBook:NCERT EXEMPLARChapter:EXPONENTS AND POWERSExercise:EXERCISE
Explore 136 Videos
Similar Questions
In a public library, the following observations were recorded by the librarian in a particular week:

(a) Draw a double bar graph choosing an appropriate scale.
(b) On which day, the number of readers in the library was maximum?
(c) What is the mean number of magazine readers?
View SolutionThe performance of a student in 1st Term and 2nd Term is given.

In which subject is the improvement the least ?
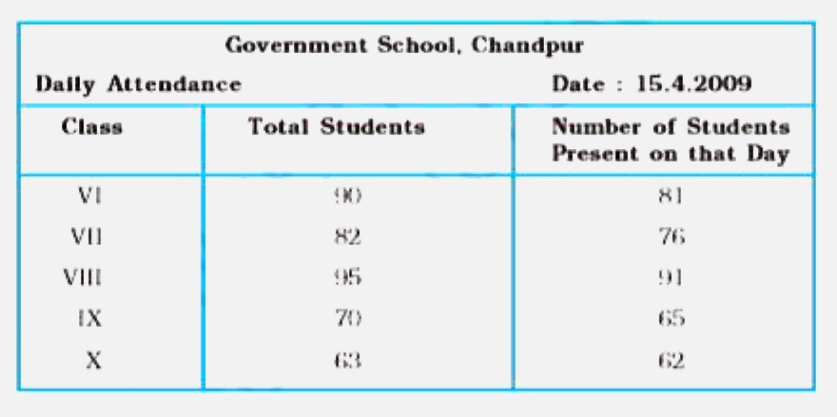
View SolutionOn a particular day in a school, the attendance in each of the classes from VI to X has been recorded as under
Draw a double bar graph, choosing an appropriate scale. Using the bar graph, answer the questions given below

(i) Which class has the maximum number of students (ii) Find the ratio of number of students present to the total number of students in Class VII. (iii) What percent of Class IX students were absent
View SolutionThe following data shows the number of students who attended the school on weekdays. Draw a bar graph to represent information by using appropriate scale.

View SolutionThe performance of a student in 1st Term and 2nd Term is given.

Has the performance gone down in any subject
View SolutionThe table below compares the population (in hundreds) of 4 towns over two years:

Study the table and answer the following questions:
(a) Draw a double bar graph using appropriate scale to depict the above information.
(b) In which town was the population growth maximum?
(c) In which town was the population growth least?
View SolutionThe table below gives the data of tourists visiting 5 hill stations over two consecutive years. Study the table and answer the questions that follow:

(a) Draw a double bar graph to depict the above information using appropriate scale.
(b) Which hill station was visited by the maximum number of tourists in 2008?
(c) Which hill station was visited by the least number of tourists in 2009?
(d) In which hill stations was there increase in number of tourists in the year 2009?
View SolutionThe marks out of 100 obtained by Kunal and Soni in the Half Yearly Examination are given below:

(a) Draw a double bar graph by choosing appropriate scale.
(b) Calculate the total percentage of marks obtained by Soni.
(c) Calculate the total percentage of marks obtained by Kunal.
(d) Compare the percentages of marks obtained by Kunal and Soni/
(e) In how many subjects did Soni get more marks than Kunal? Which are those subjects?
(f) Who got more marks in S. Science and what was the difference of marks?
(g) In which subject the difference of marks was maximum and by how much? "
View SolutionObserve the following data:

(a) Draw a double bar graph choosing an appropriate scale. What do you infer from the bar graph?
(b) Which class has the maximum number of students?
(c) In which class, the difference of total students and number of students present is minimum?
(d) Find the ratio of number of students present to the total number of students of Class IX.
(e) What per cent of Class VI students were absent?
View SolutionThe performance of a student in 1st Term and 2nd Term is given.

In which subject, has the child improved his performance the most ?
View Solution