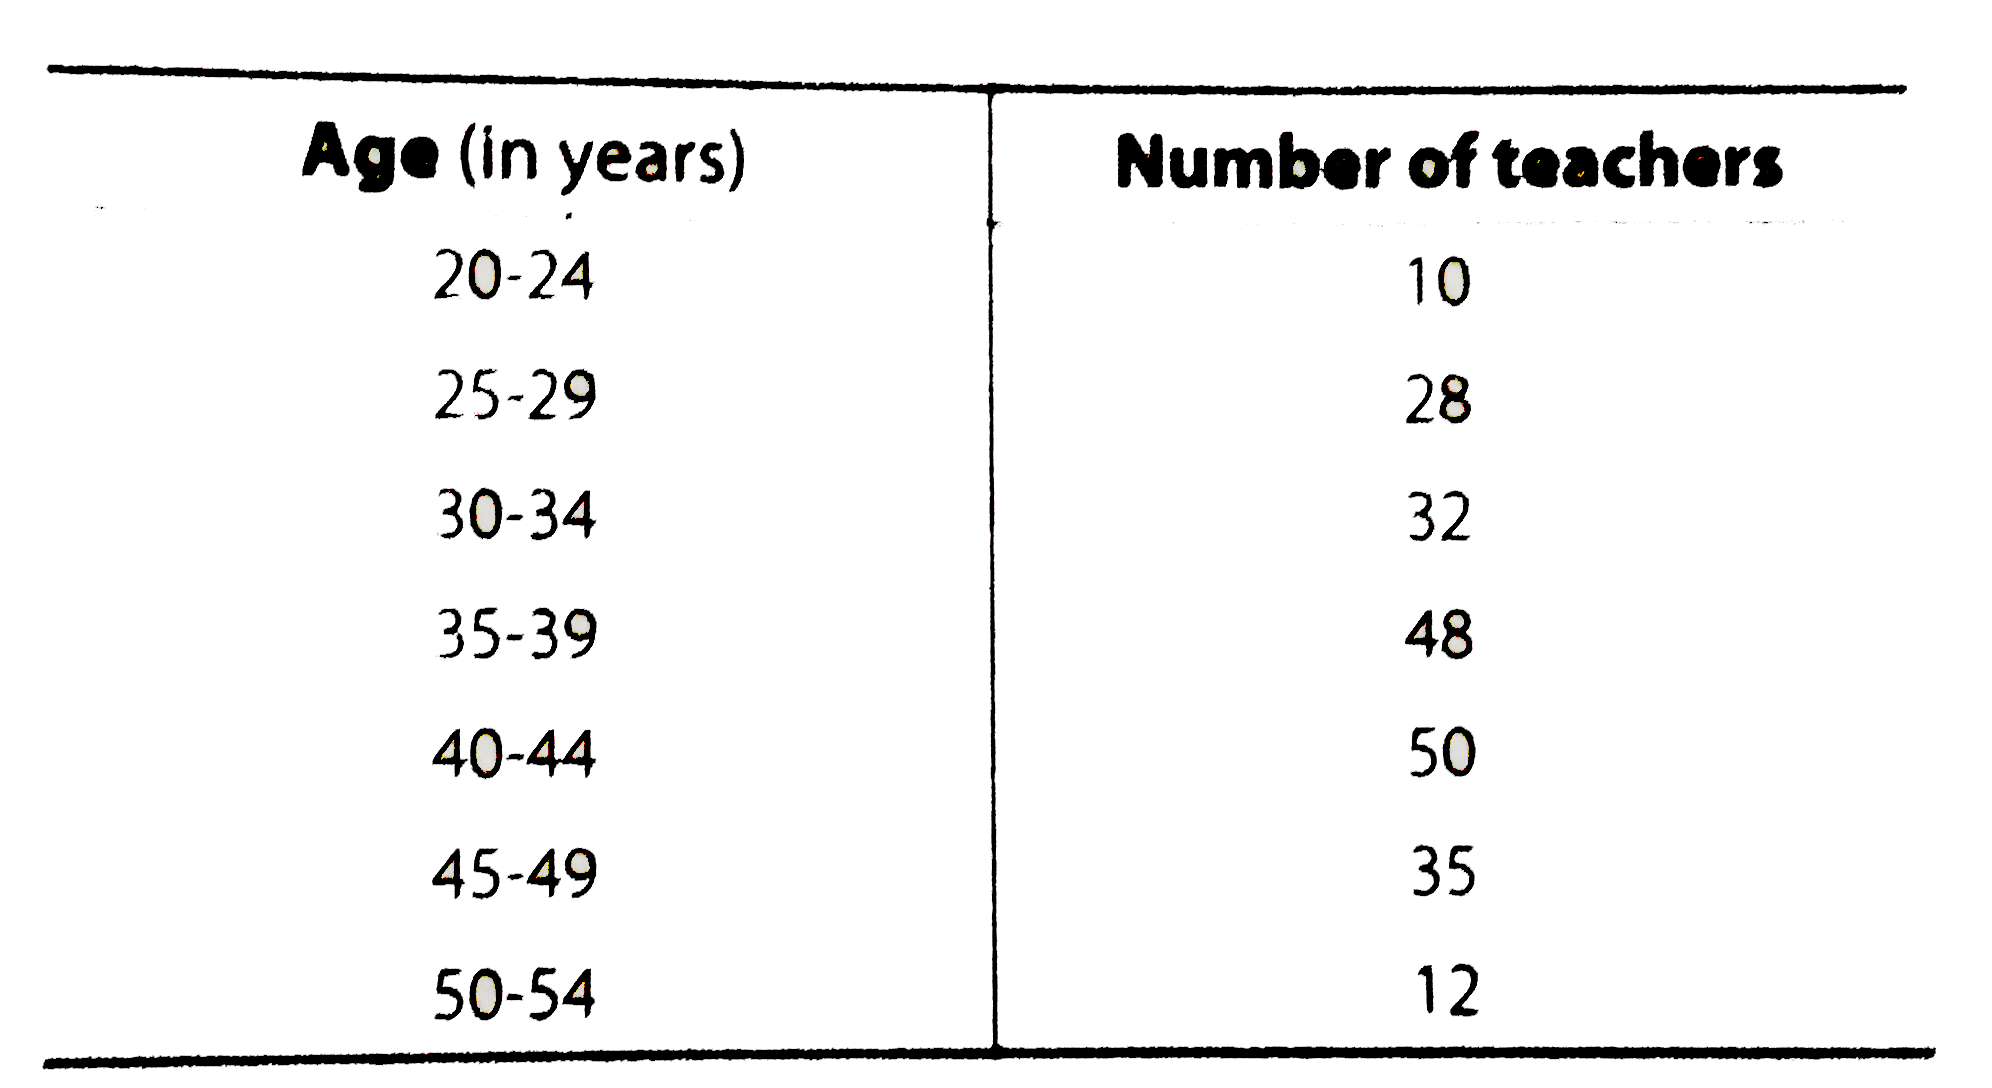
Draw a histogram to represent the following information:

Video Solution
Text Solution
The class sizes of the given class intervals are
(10-5)=5(15-10)=5,(25-15)=10,(45-25)=20 and (75-45)=30
Minimum class size=5
Adjusted frequencies of the given class interval are
(53×6)=6,(55×132)=12(510×10)=5,(520×8)=2,(520×15)=5,(530×18)=3
|
Topper's Solved these Questions
- BAR GRAPH, HISTOGRAM AND FREQUENCY POLYGONBOOK - RS AGGARWALCHAPTER - BAR GRAPH, HISTOGRAM AND FREQUENCY POLYGONEXERCISE - EXERCISE 17A
12 Videos
- AREAS OF TRIANGLES AND QUADRILATERALSBOOK - RS AGGARWALCHAPTER - AREAS OF TRIANGLES AND QUADRILATERALSEXERCISE - Multiple Choice Questions (Mcq)
16 Videos
- CIRCLES BOOK - RS AGGARWALCHAPTER - CIRCLES EXERCISE - MULTIPLE CHOICE QUESTION(MCQ)
37 Videos
Similar Questions
Knowledge Check
To draw a histogram to represent the following frequency distribution.
Class Interval 5−1010−1515−2525−4545−75
Frequency 6 12 10 8 15
The adjusted frequency for the class 25−45 isA6B5C3D2
Draw the histogram to represent the following data.

View SolutionDraw a histogram representing the following distribution.

View SolutionDraw a histogram representing the following distribution.

View SolutionDraw a histogram to represent the following grouped frequency distribution.

View SolutionDraw a histogrum and to represent the following frequency distribution :
View SolutionDraw a histogram for the following data:

View SolutionDraw a histogram for the following data.

View Solution

