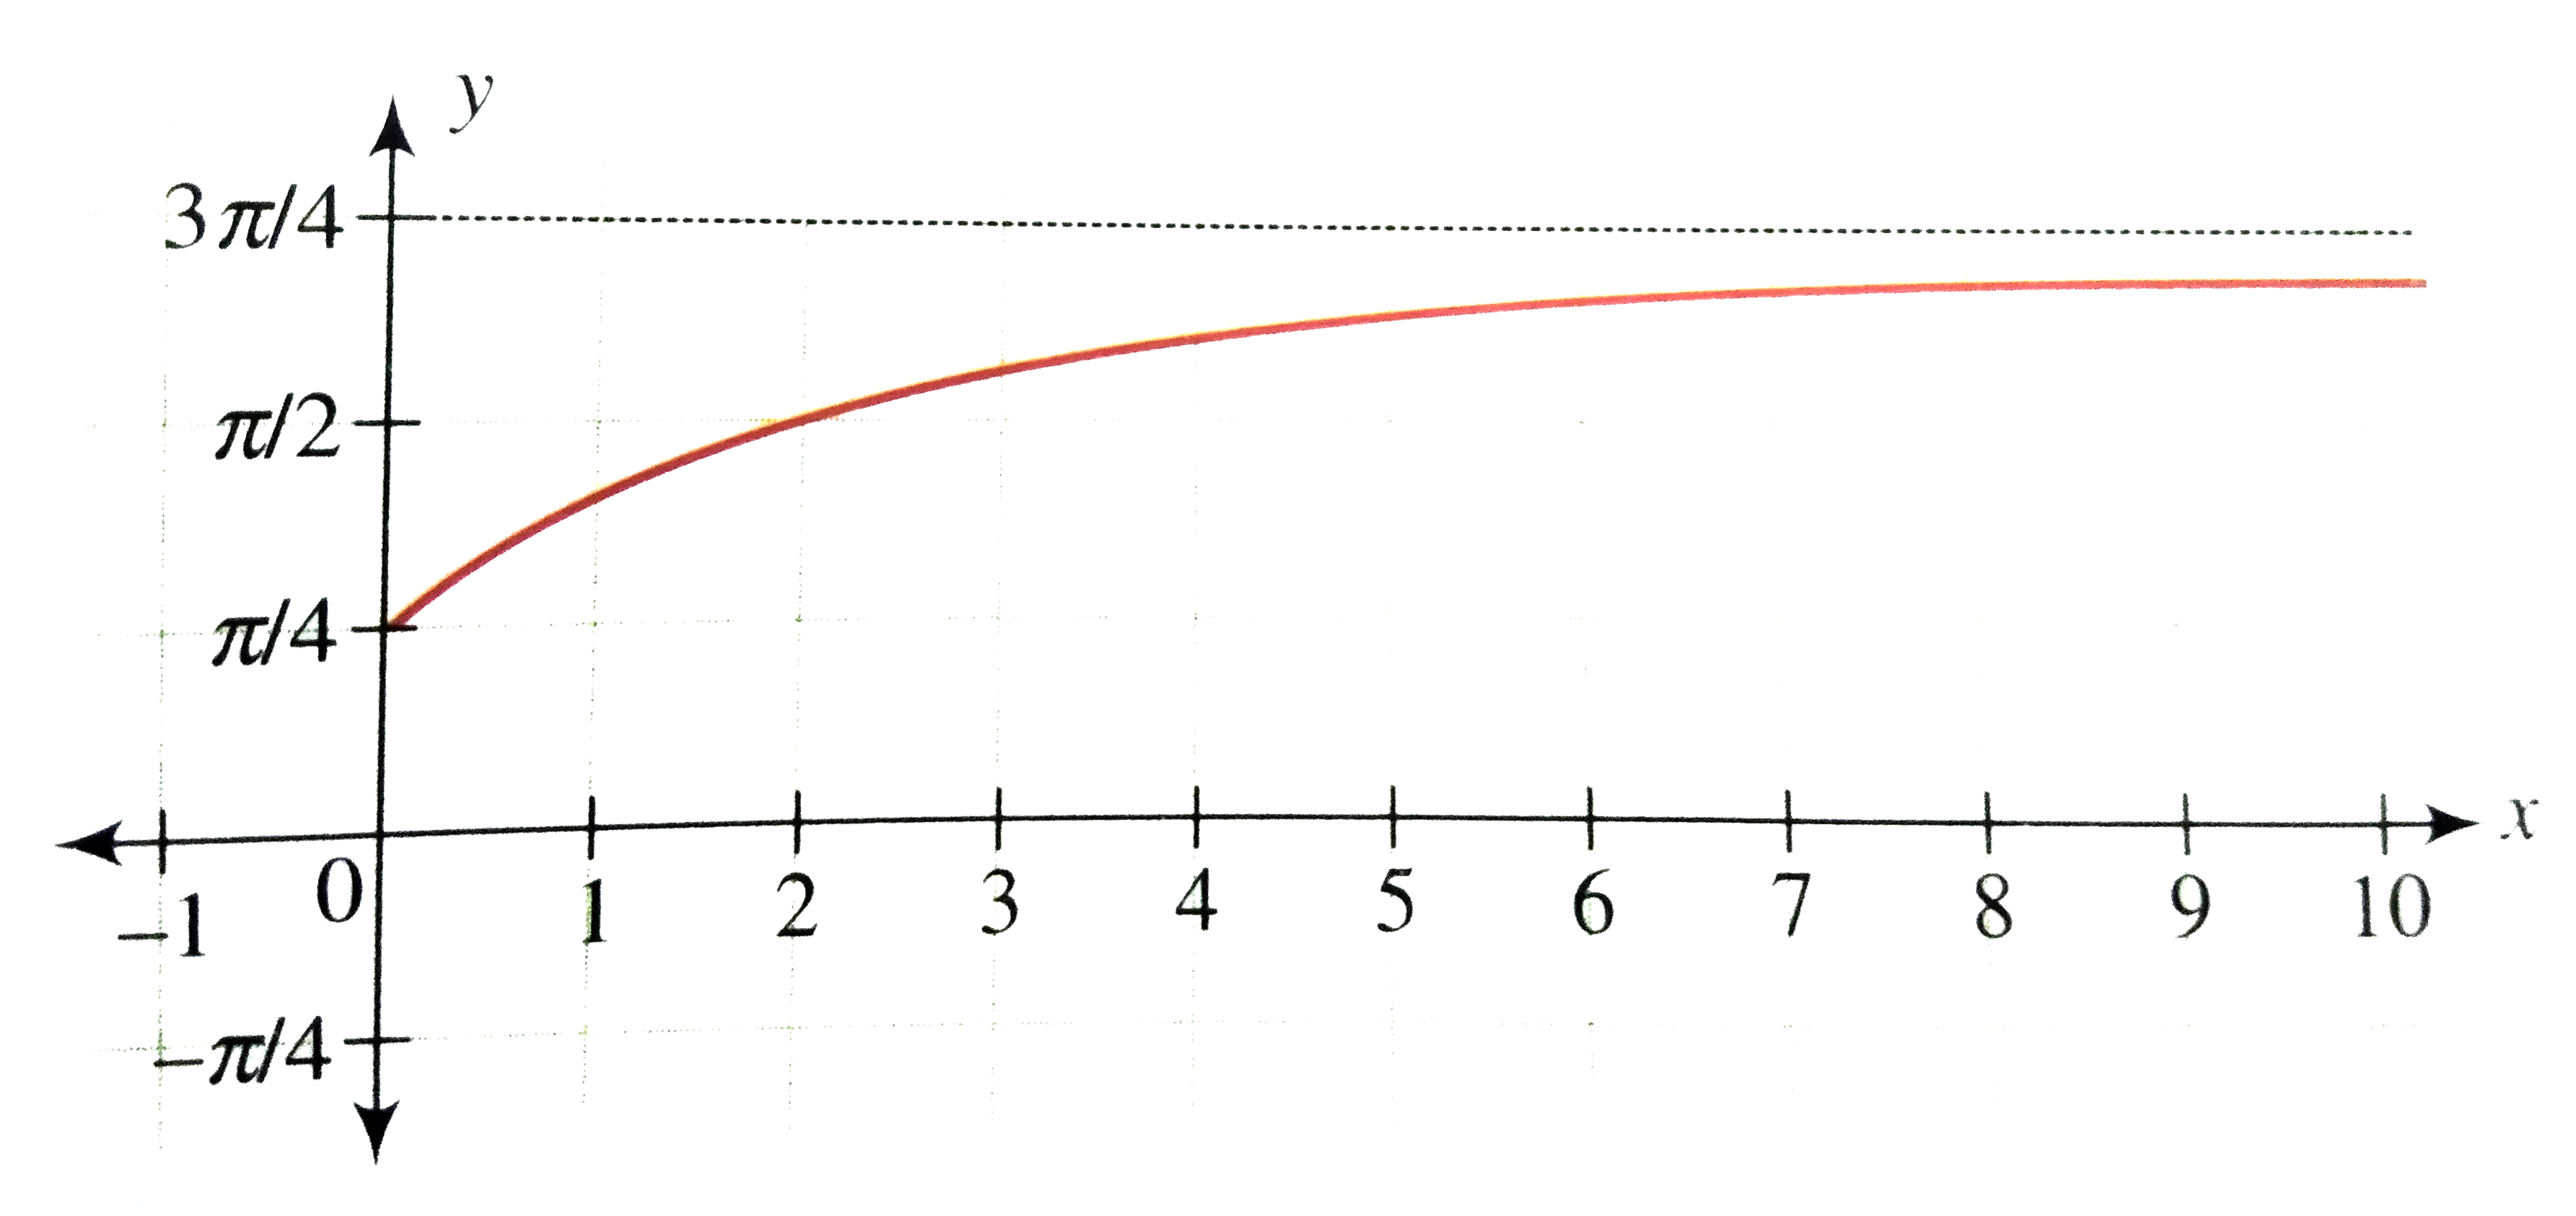
Draw the graph of f(x)=cot−1(2−|x|2+|x|).
Video Solution
Text Solution
We have f(x)=cot−1(2−|x|2+|x|)
=π2−tan−1(2−|x|2+|x|)
=π2−tan−1⎛⎜⎝1−|x|21−|x|2⎞⎟⎠
=π2−(tan−11−tan−1,|x|2)
=π4+tan−1,|x|2
Now f(x) is an even function.
We need to draw the graph for x≥0
For x≥0,f(x)=π4+tan−1,x2
Nowf(0)=π4
f'(x)=12(1+x24)>0 for all x >0
Hence f(x) is an incereasing function.
f'(x)=x4(1+x24)<0 for all x<0
Hence, the graph is concave downwarod.
Also when x→∞ f(x)→π4+π2=3π4
From the above discussion, the graph of y=f(x) for x>0 is as shown in the following figure

Since the function is even, the graph for all real values of x is as shown in the following figure.

|
Topper's Solved these Questions
- GRAPH OF INVERSE TRIGONOMETRIC FUNCTIONSBOOK - CENGAGE ENGLISHCHAPTER - GRAPH OF INVERSE TRIGONOMETRIC FUNCTIONSEXERCISE - Exercises
18 Videos
- GETTING STARTED WITH GRAPHSBOOK - CENGAGE ENGLISHCHAPTER - GETTING STARTED WITH GRAPHSEXERCISE - Exercises 1.18
1 Videos
- GRAPHICAL TRANSFORMATIONSBOOK - CENGAGE ENGLISHCHAPTER - GRAPHICAL TRANSFORMATIONSEXERCISE - ILLUSTRATION
78 Videos
Similar Questions
Draw the graph of y=cot−1(−x).
View SolutionDraw the graph of y=cot−1|x|.
View SolutionDraw the graph of y=−cot−1x.
View SolutionDraw the graph of y=cot−1(cotx)
View SolutionDraw the graph of f(x)=sec−1(secx)
View SolutionDraw the graph of f(x)=1x2−2x+2.
View SolutionDraw the graph of f(x)=x|x|.
View SolutionDraw the graph of f(x)=esinx.
View SolutionDraw the graph of f(x)=x2−5x+6x2−x
View SolutionDraw the graph of y=tan−1(2x1−x2)
View Solution
