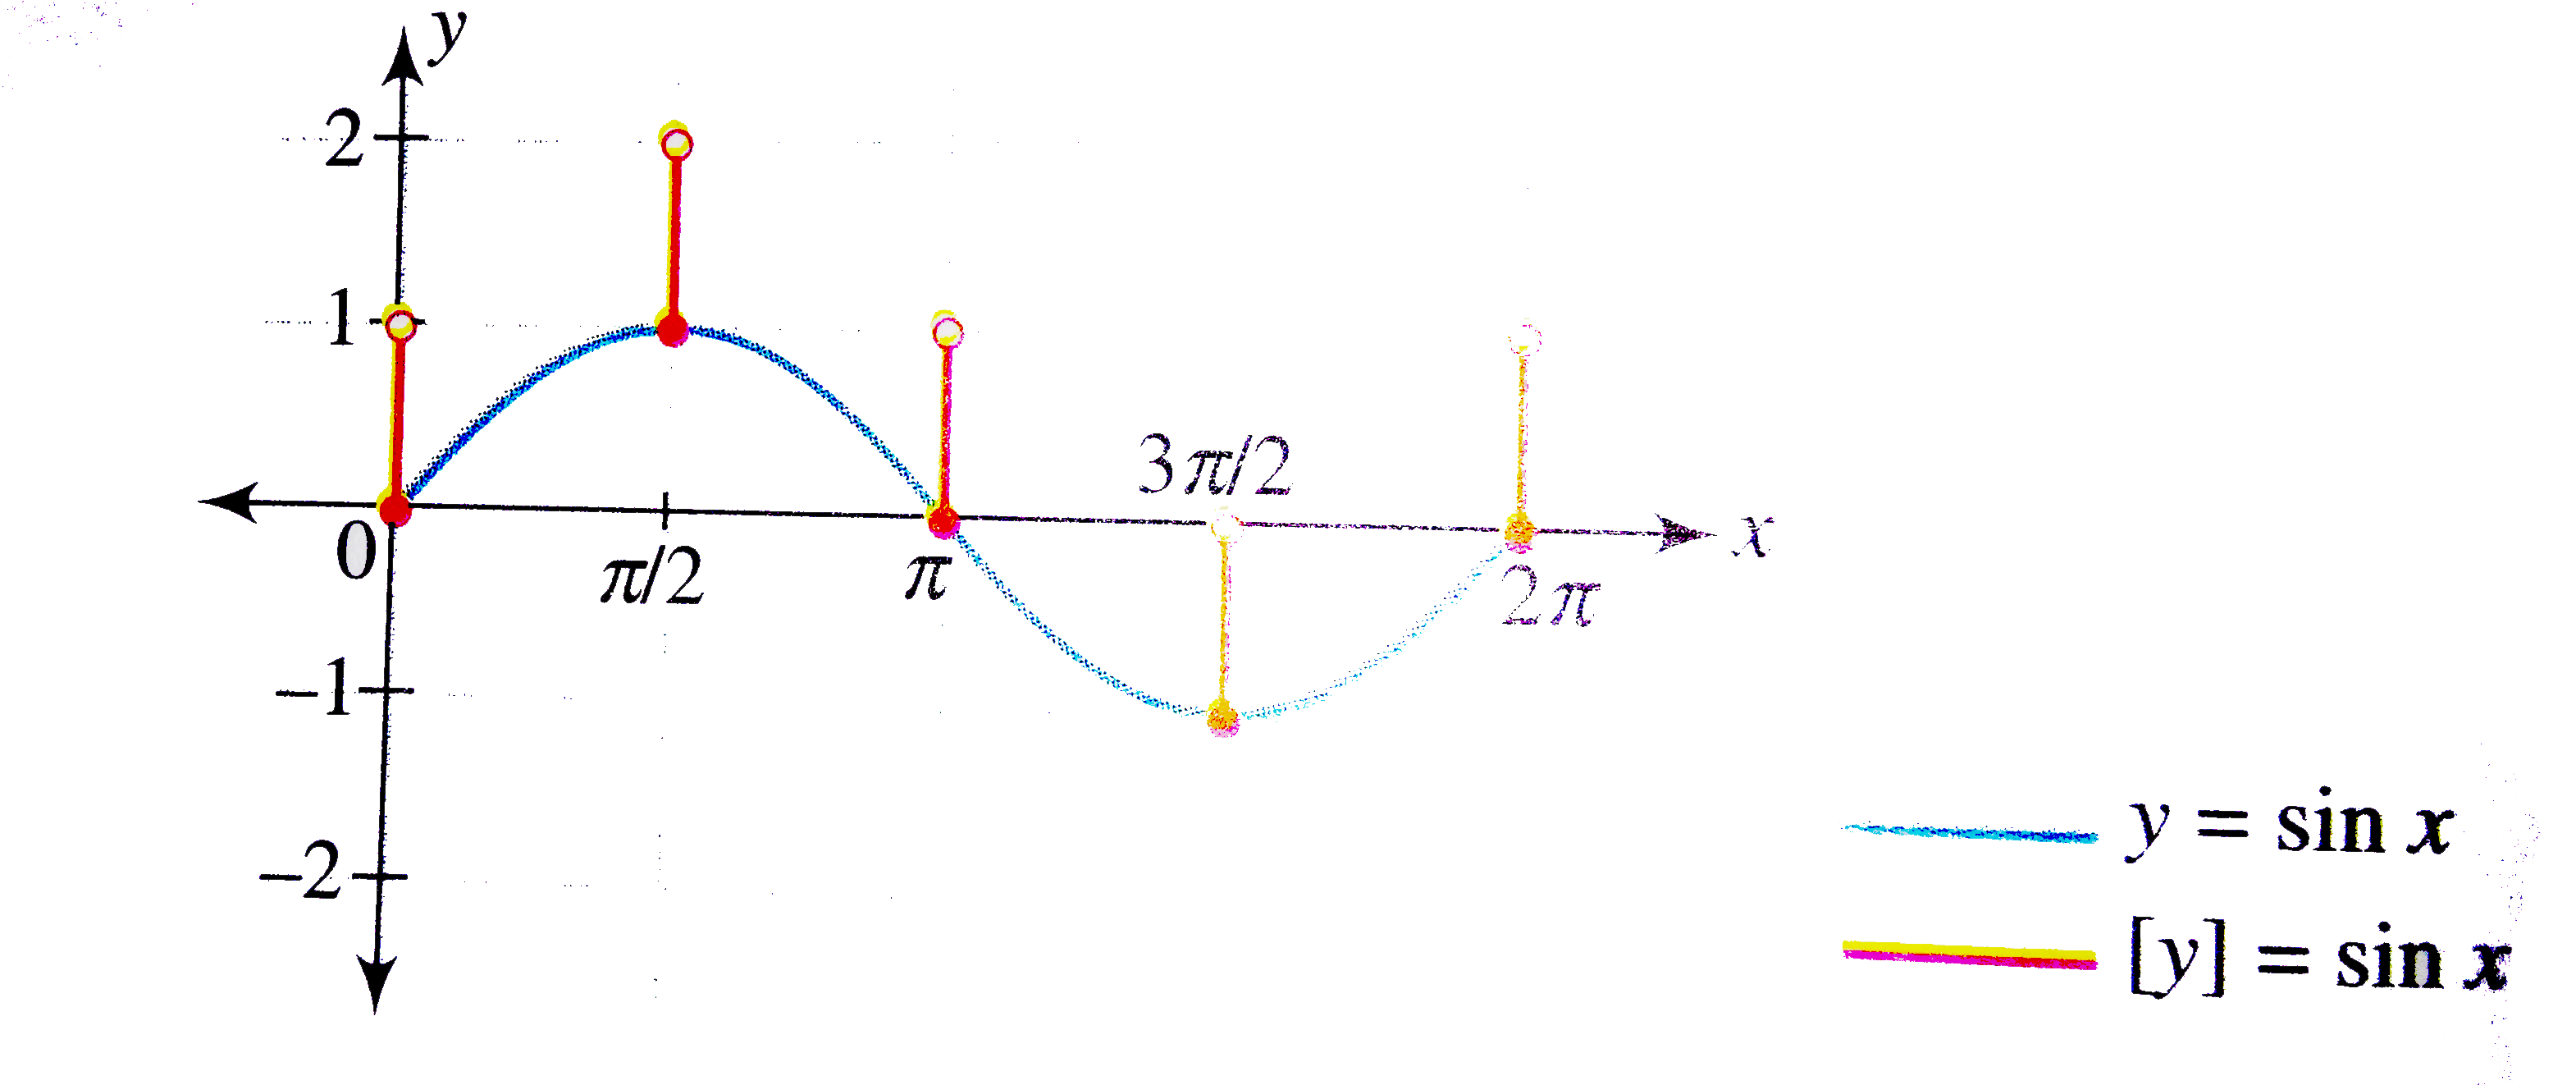
Draw the graph of [y]=sinx,x∈[0,2π] where [⋅] denotes the greatest integer function
We have [y] = sin x
This is satisfied by intergral values of sin x only. So
sin x = -1, 0, 1
When sinx=−1,x=(4n−1)π2,n∈Z
And [y]=−1∴−1≤y<0
When sinx=1,x(4n+1)π2,n∈Z
And [y]=1∴1≤y<2
When sinx=0,x=nπ,n∈Z
And [y]=0∴0≤y<1
Hence the graph of the function is as shown in the following figure.

Drawing the graph of g(x)=f(x)sinx
We have g(x)=f(x)sinx.
Since −1≤sinx≤1, we have −f(x)≤f(x)sinx≤f(x).
Thus the graph of g(x)=f(x) sin x lies between th graphs of y=f(x) and y = -f(x). So the draw the graph of y = g(x), we first draw the graph of y = f(x) and y = -f(x) and plot the points of the graph for quadrant angles, i.e. x=...−π,−π/2,0,π/2,π,3π/2,2π...
g(π/2)=f(π/2) sin (π/2)=f(π/2), thus the point (π/2,f(π/2)) lies on the graph of y = f(x)
g(3π/2)=f(3π/2) sin (3π/2)=−f(3π/2), thus the point (3π/2,−f(3π/2)) lies on the graph of y = -f(x).
Similarly, for x=5π/2,9π/2,... points of y = g(x) lie on the graph of y = f(x), and for x=3π/2,7π/2,... points of y = g(x) lie on the graph of y = -f(x).
Topper's Solved these Questions
- GRAPHS OF TRIGONOMETRIC FUNCTIONSBOOK - CENGAGECHAPTER - GRAPHS OF TRIGONOMETRIC FUNCTIONSEXERCISE - Exercise
22 Videos
- GRAPHS OF ELEMENTARY FUNCTIONS BOOK - CENGAGECHAPTER - GRAPHS OF ELEMENTARY FUNCTIONS EXERCISE - Exercise
34 Videos
- HIGHT AND DISTANCE BOOK - CENGAGECHAPTER - HIGHT AND DISTANCE EXERCISE - JEE Previous Year
3 Videos
Similar Questions
Draw the graph of [y]=cosx,x∈[0,2π], where [⋅] denotes the greatest integer function.
View SolutionDraw the graph of [y]=cosx,x∈[0,2π], where [⋅] denotes the greatest integer function.
View SolutionDraw the graph of y=[sinx],x∈[0,2π], where [⋅] represents the greatest integer function.
View SolutionDraw the graph of y=[sinx],x∈[0,2π], where [⋅] represents the greatest integer function.
View SolutionDraw the graph of y=[cosx],x∈[0,2π], where [⋅] represents the greatest integer function.
View SolutionDraw the graph of y=[cosx],x∈[0,2π], where [⋅] represents the greatest integer function.
View SolutionDraw the graph of f(x)=[x2],x∈[0,2), where [⋅] denotes the greatest integer function.
View SolutionDraw the graph of f(x)=[x2],x∈[0,2), where [⋅] denotes the greatest integer function.
View SolutionDraw the graph of f(x)=cosπ[x], where [⋅] represents the greatest integer function. Find the period of the function.
View SolutionDraw the graph of f(x)=cosπ[x], where [⋅] represents the greatest integer function. Find the period of the function.
View Solution
