Draw the graph of y=tan2x.
Text Solution
We have y=f(x)=tan2x
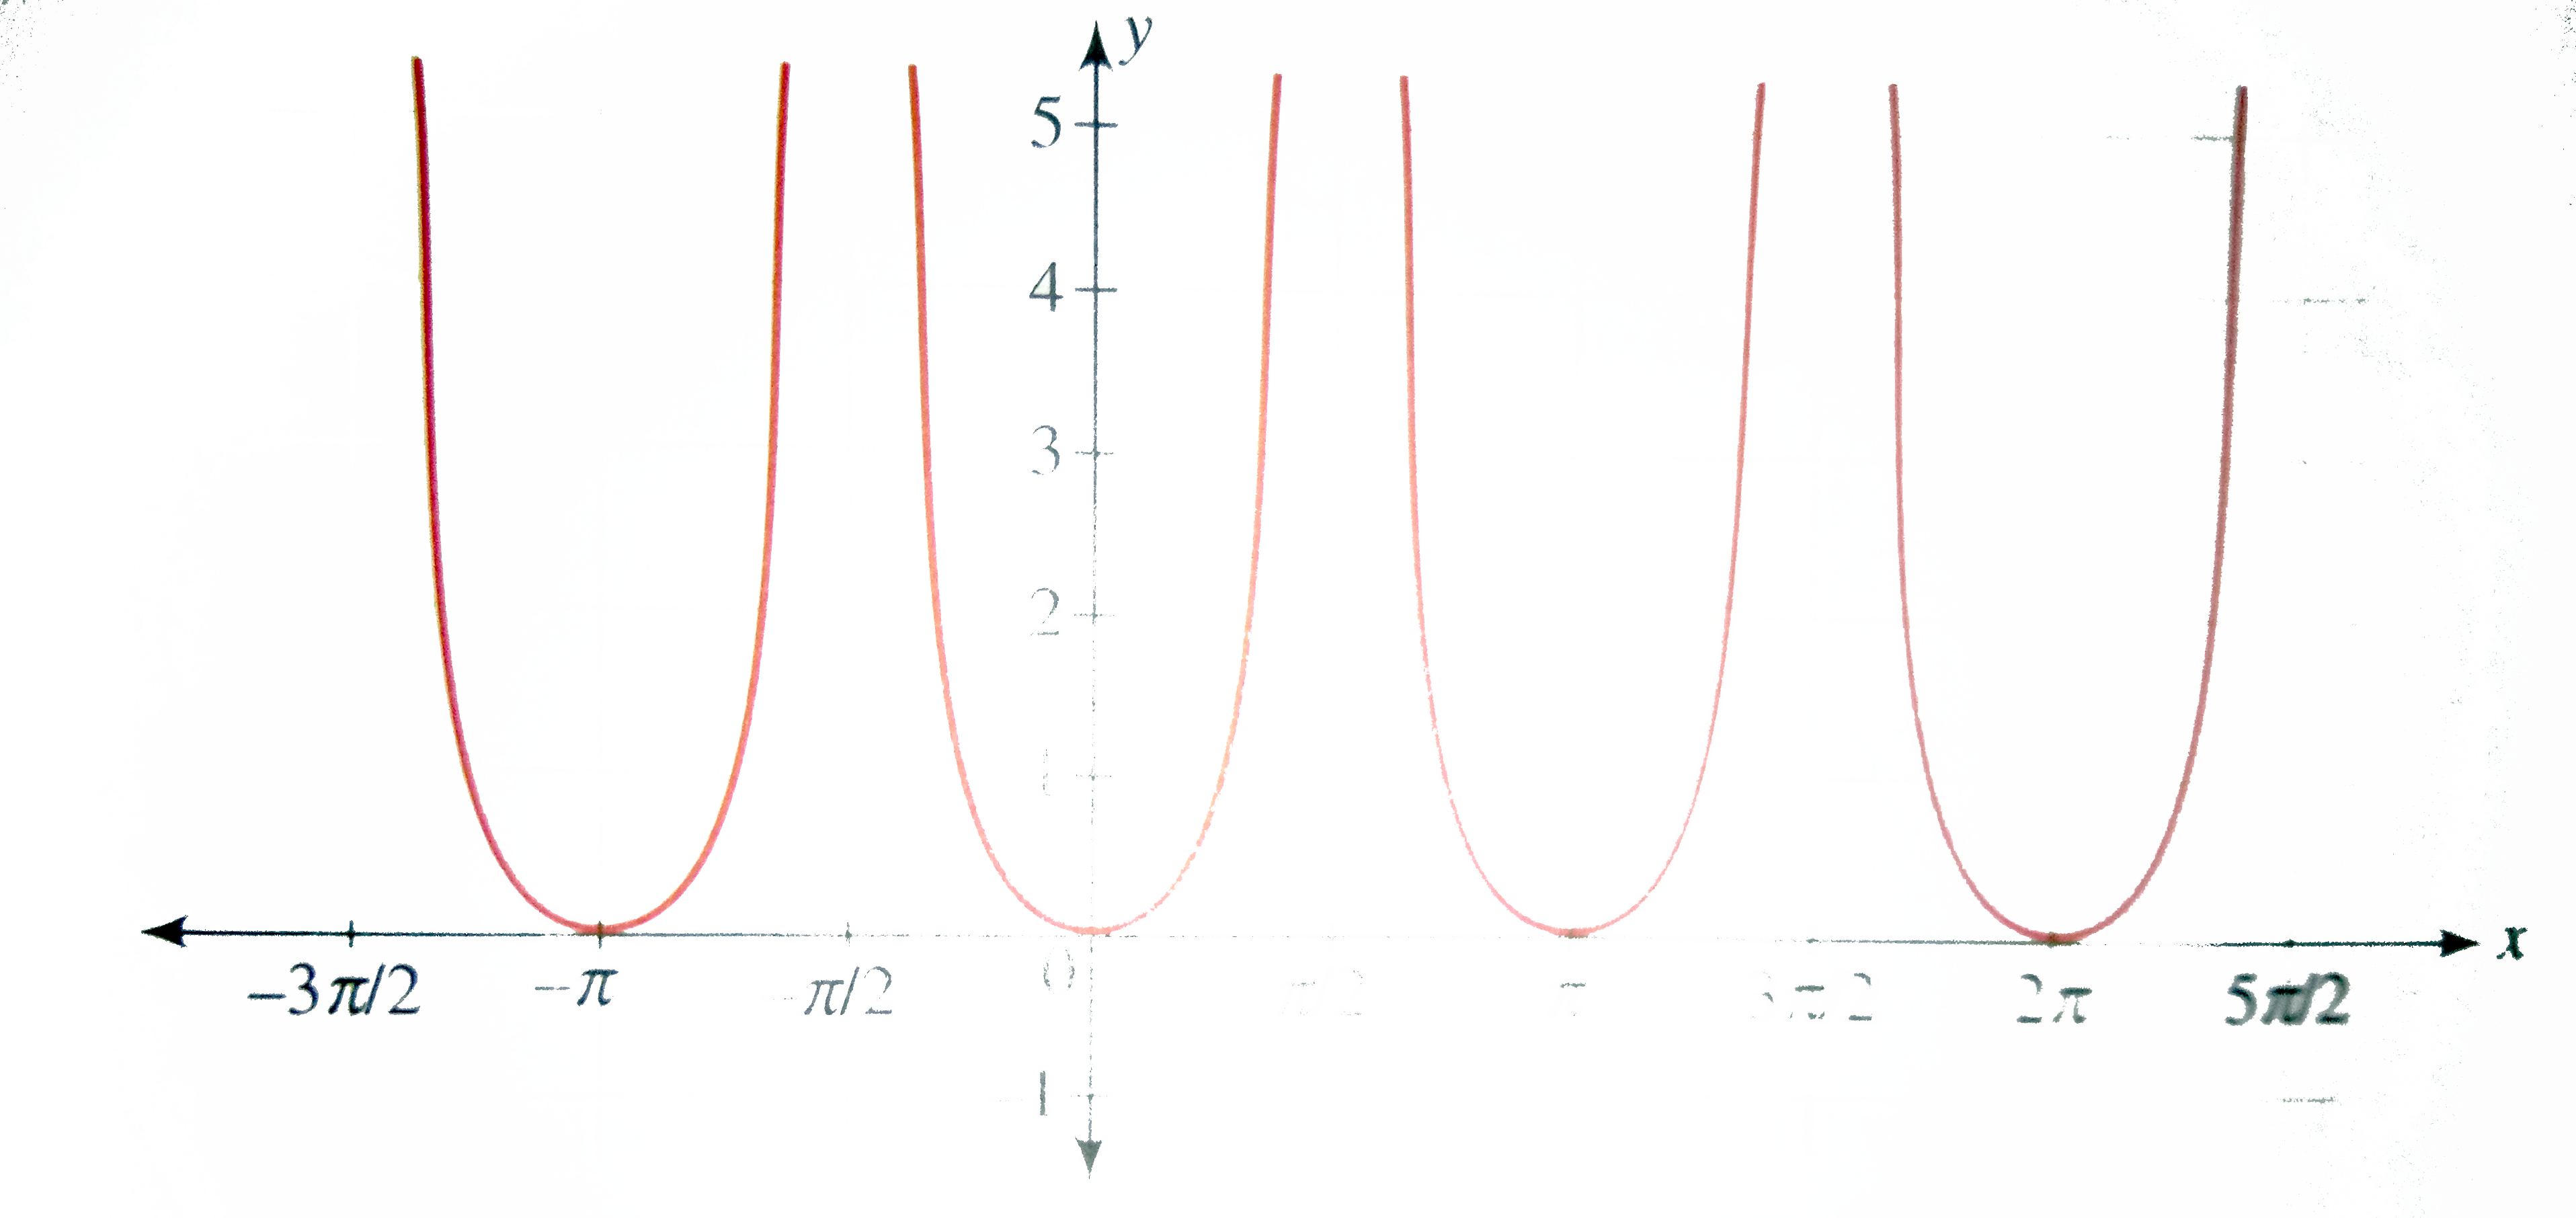
Period of the function is π.
Function is even, so the graph is symmetrical above the x - axis.
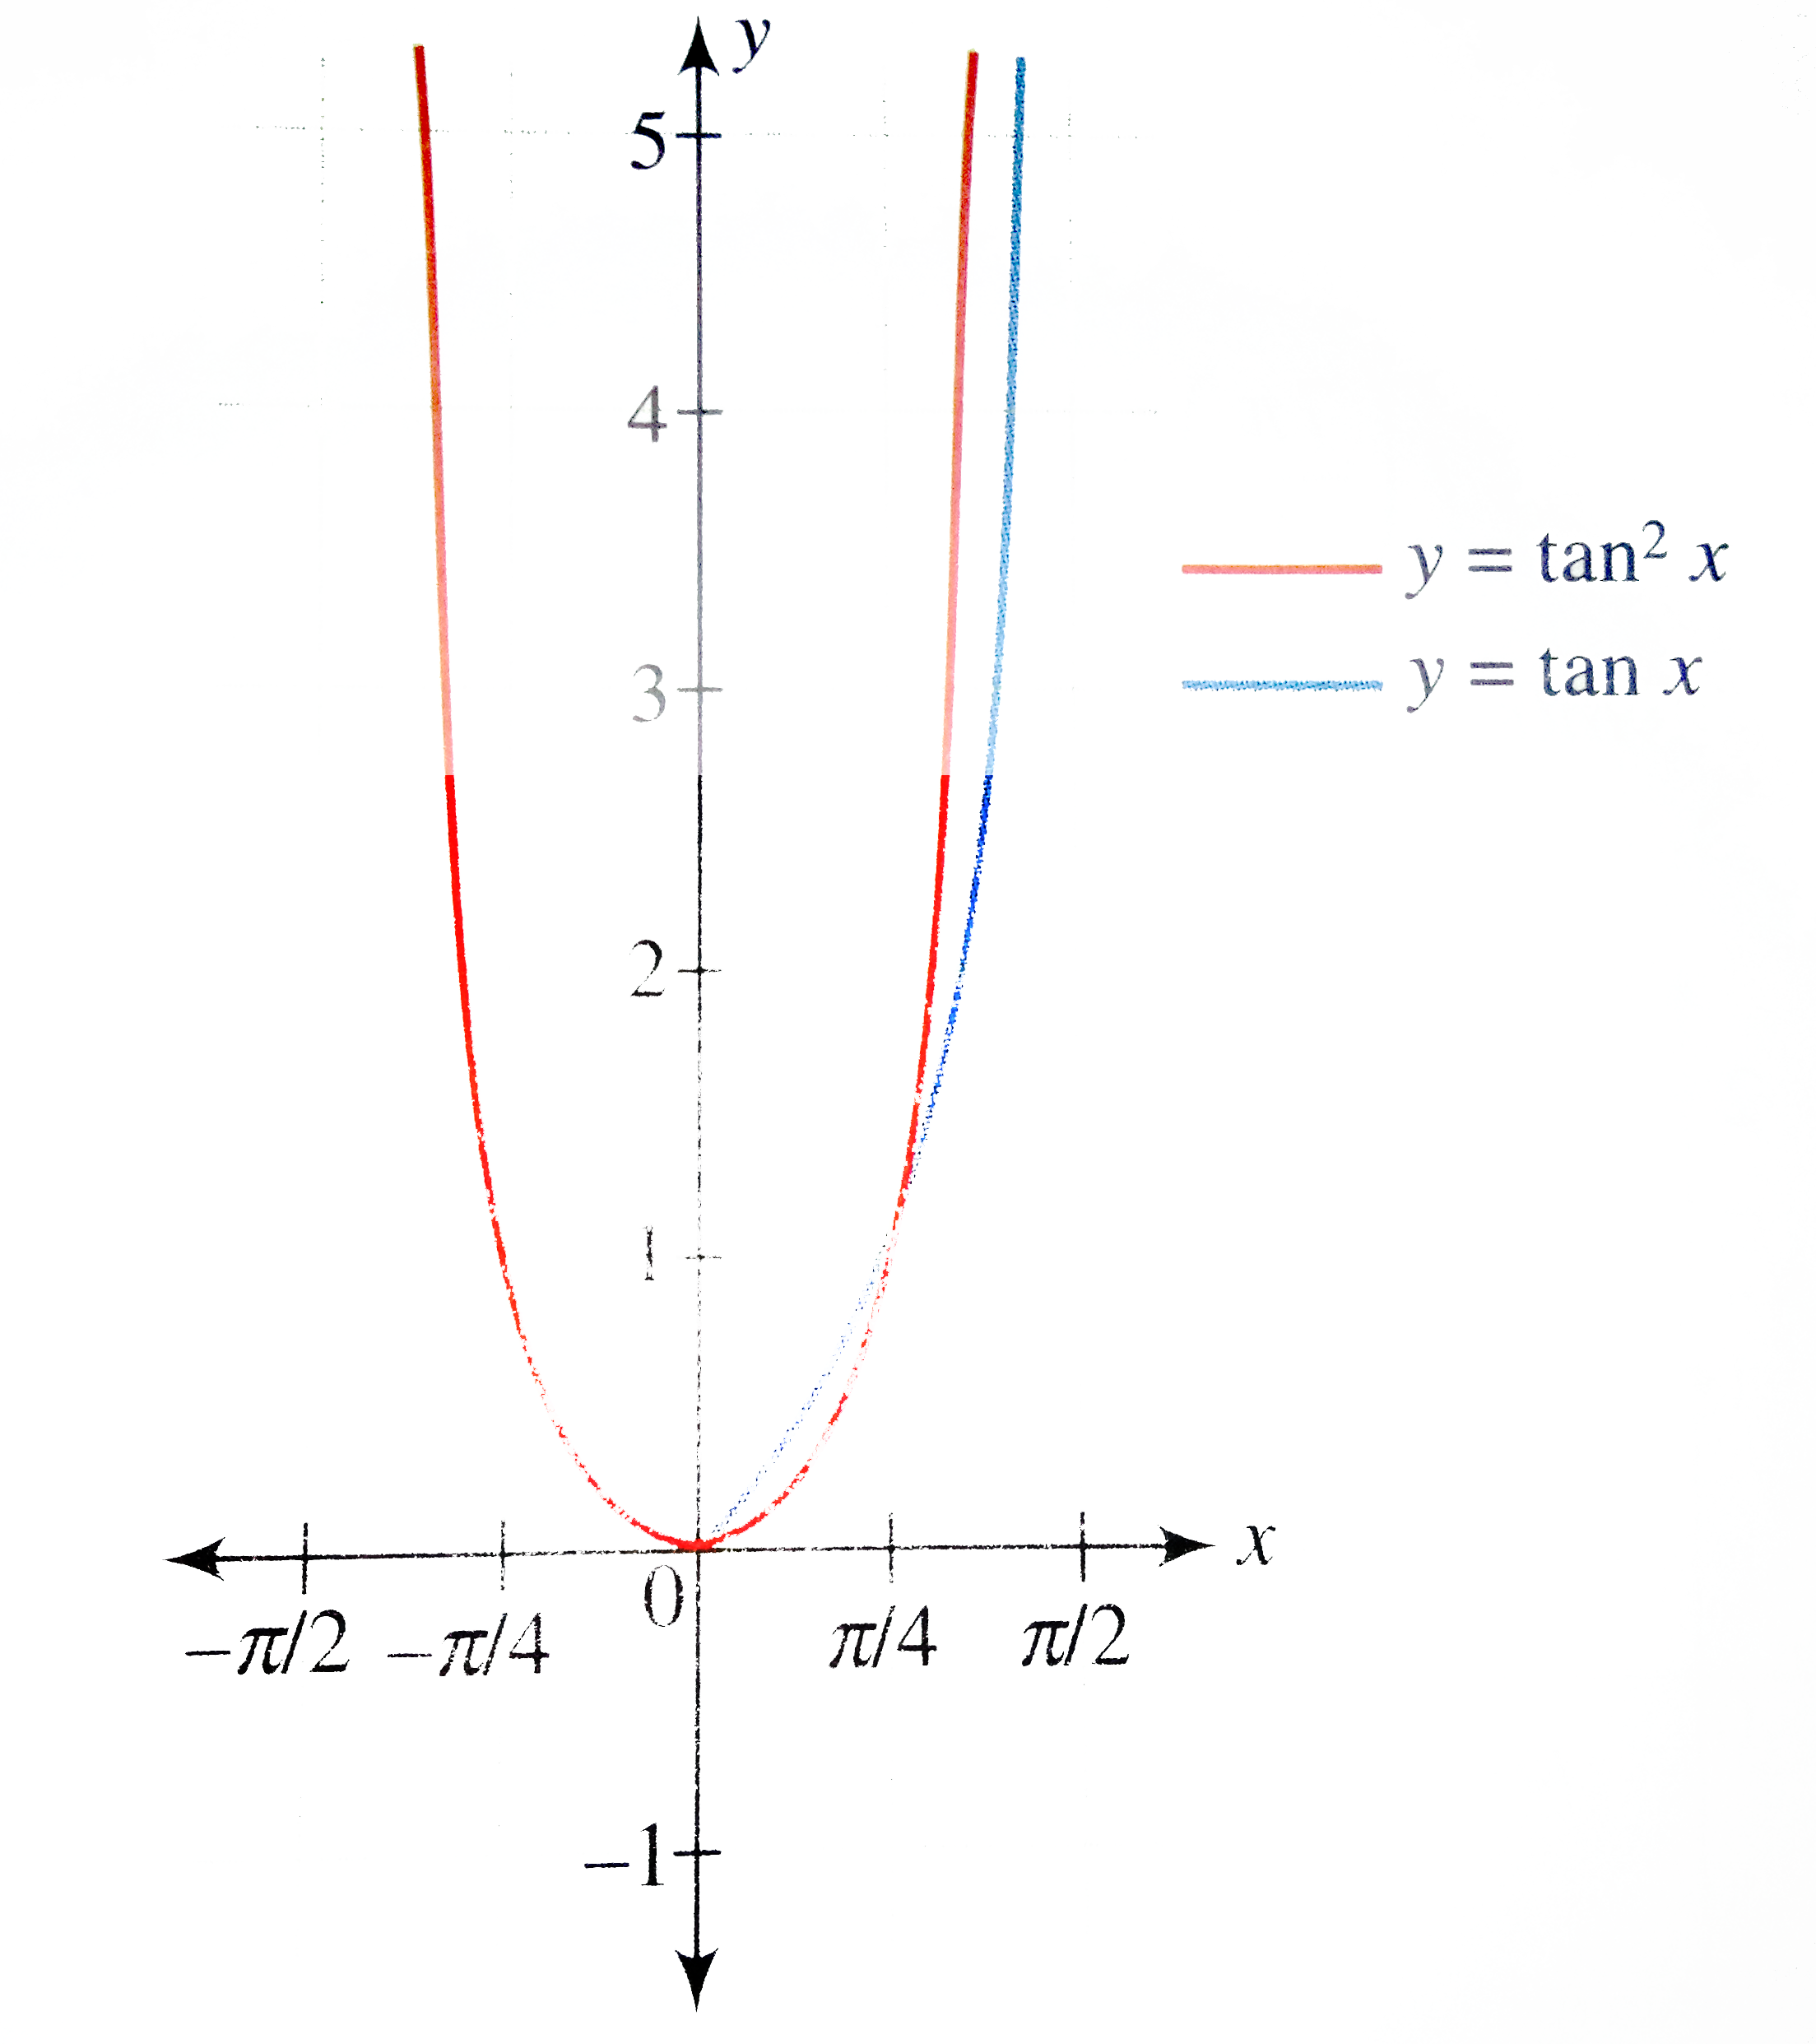
Let us draw the graph for 0<x<π/2.
For 0<x<π/4,0<tanx<1
∴ tan2x<tanx
For x>π/4
tanx>1
∴ tan2x>tanx
Hence the graph of y=tan2x lies below and above the graph of y = tan x for x∈(0,π/4) and x∈(π/4,π/2).
So the graph of the function for x∈(−π/2,π/2) is as shown in the following figure.

Since the function has period π , the graph of the function is as shown in the following figure.

|
Topper's Solved these Questions
- GRAPHS OF TRIGONOMETRIC FUNCTIONSBOOK - CENGAGECHAPTER - GRAPHS OF TRIGONOMETRIC FUNCTIONSEXERCISE - Exercise
22 Videos
- GRAPHS OF ELEMENTARY FUNCTIONS BOOK - CENGAGECHAPTER - GRAPHS OF ELEMENTARY FUNCTIONS EXERCISE - Exercise
34 Videos
- HIGHT AND DISTANCE BOOK - CENGAGECHAPTER - HIGHT AND DISTANCE EXERCISE - JEE Previous Year
3 Videos
Similar Questions
Draw the graph of y=2x.
View SolutionDraw the graph of y=2x.
View SolutionDraw the graph of y=tan−1(tanx)
View SolutionDraw the graph of y=tan−1(tanx)
View SolutionDraw the graph of y=tan(3x).
View SolutionDraw the graph of y=tan(3x).
View SolutionDraw the graph of y≤x+2.
View SolutionDraw the graph of y=tan−1|x|.
View SolutionDraw the graph of y=tan−1|x|.
View SolutionDraw the graph of y = tan x and find the period.
View Solution
