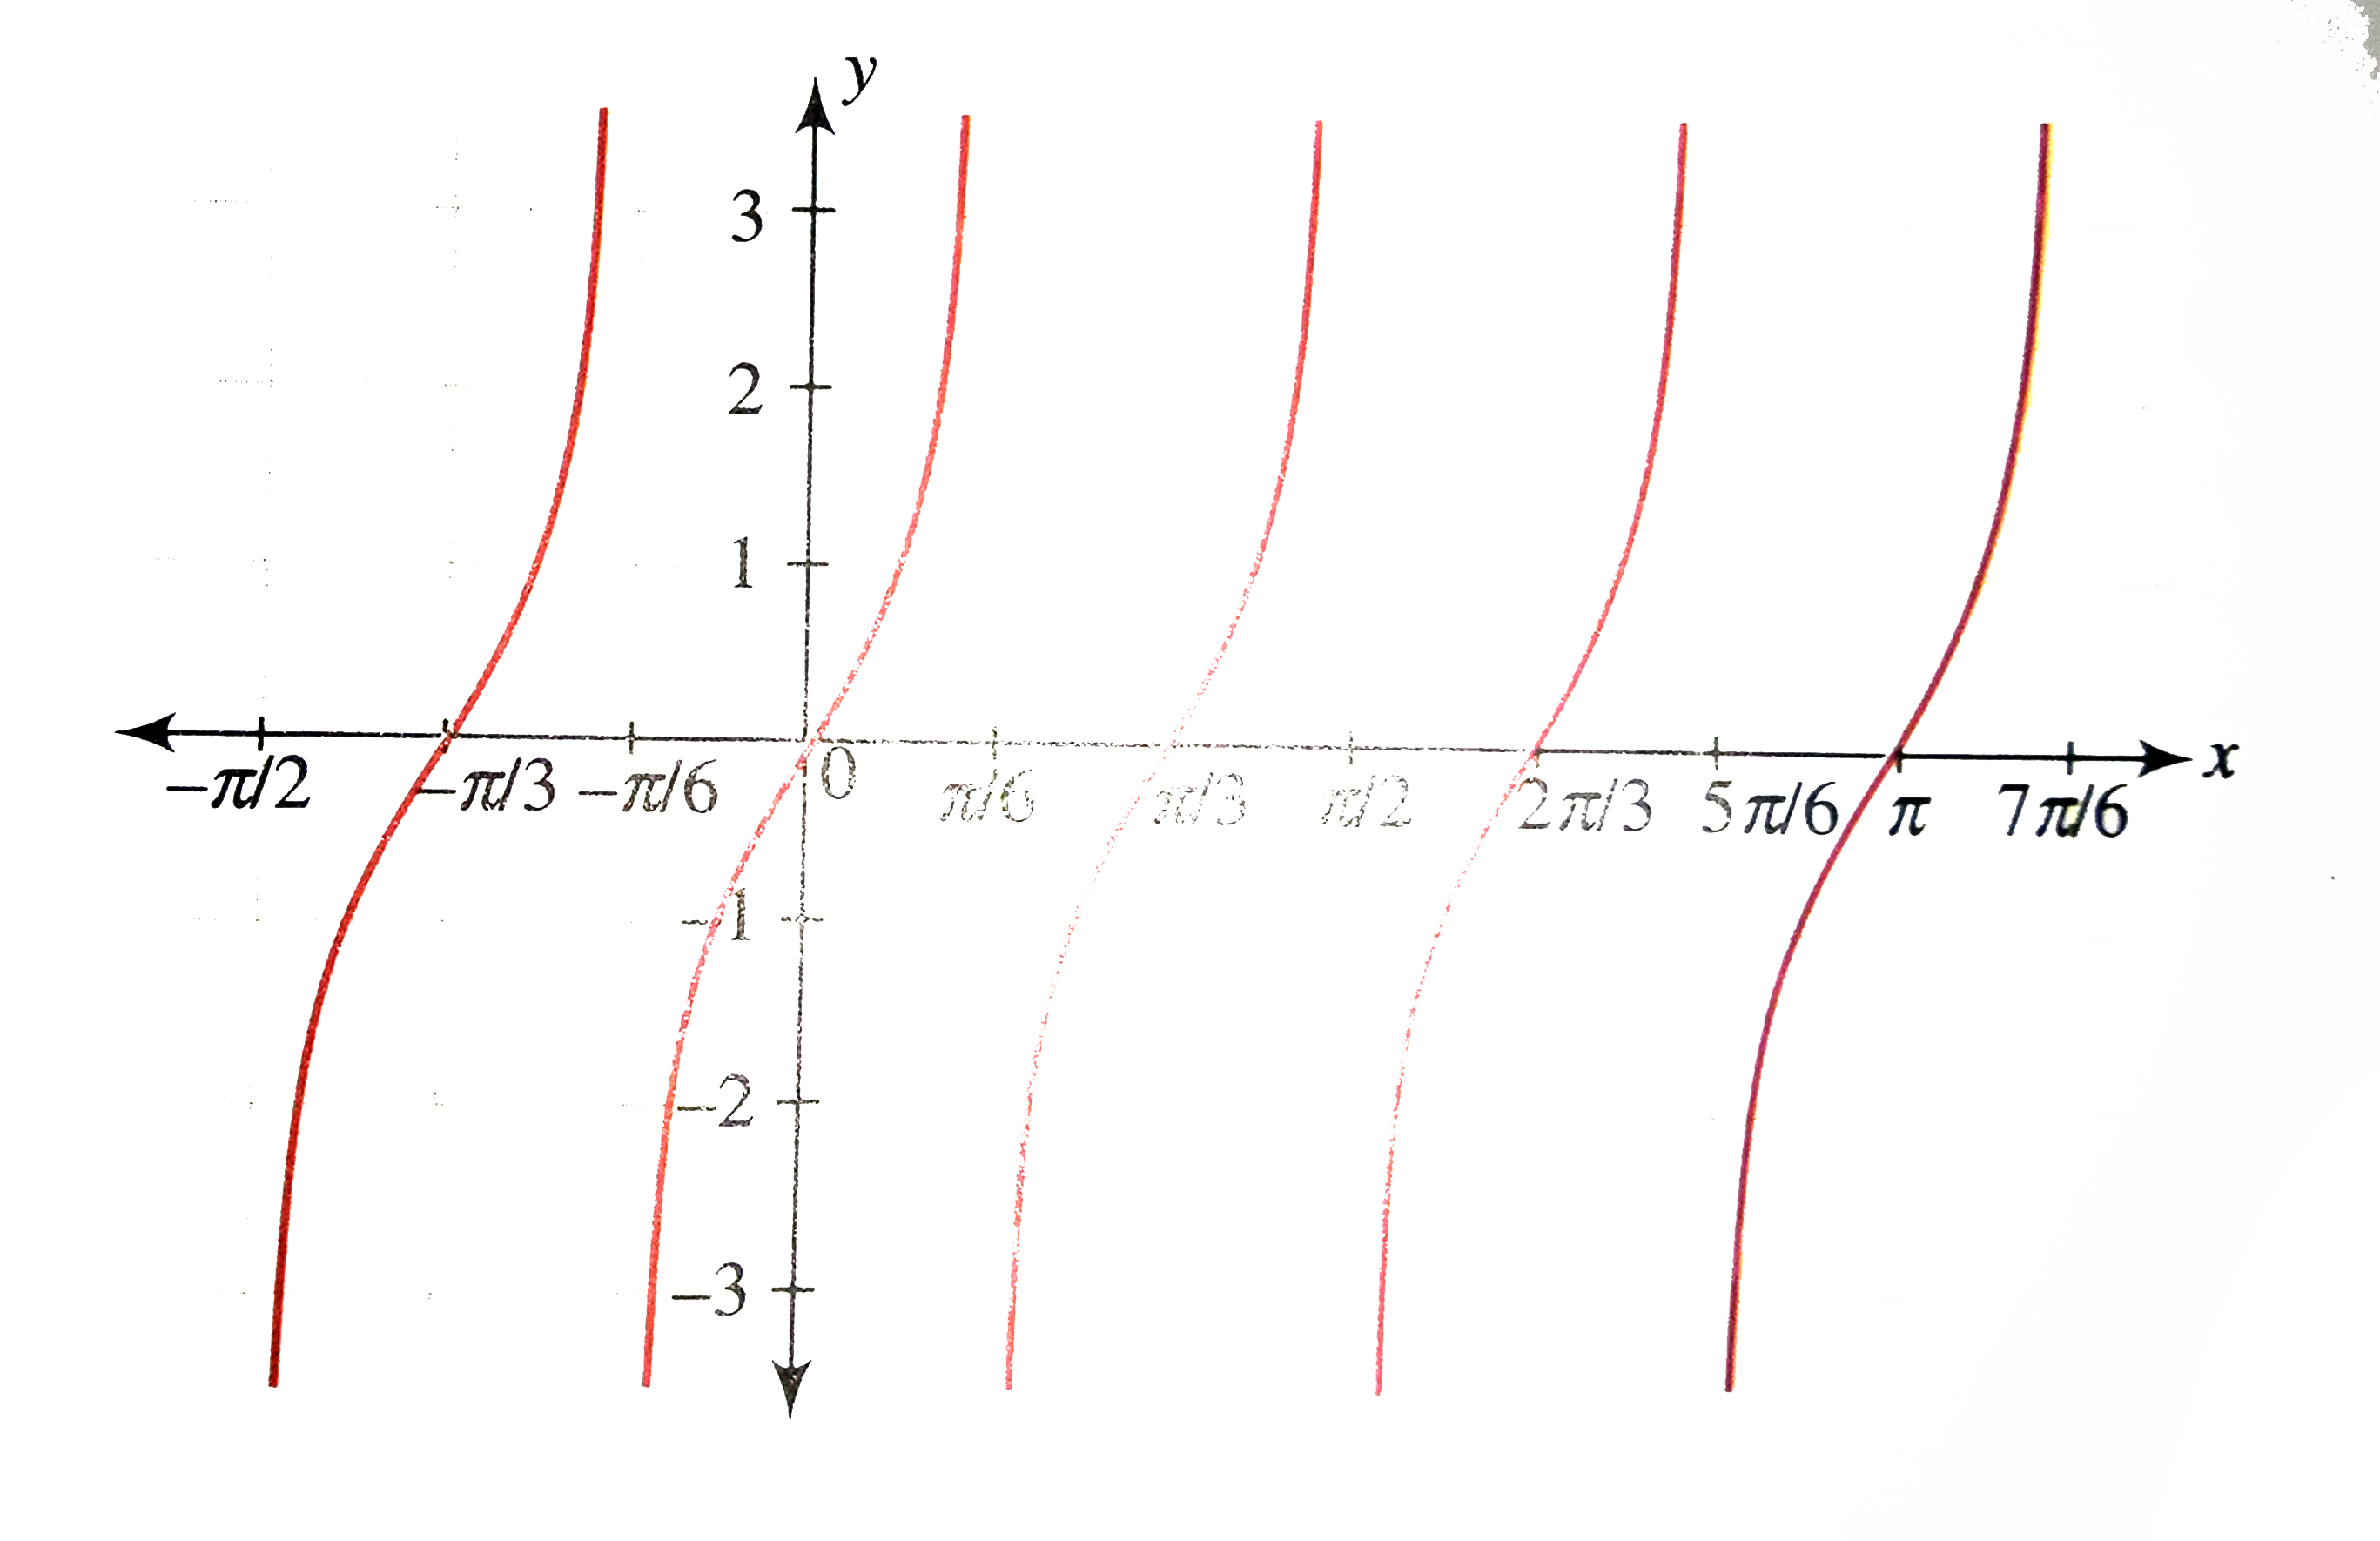
Draw the graph of y=tan(3x).
Video Solution
Text Solution
We have y=tan(3x).
Since the period of y=tan(3x) is π3, it takes its all values in the interval of length π3.

|
Topper's Solved these Questions
- GRAPHS OF TRIGONOMETRIC FUNCTIONSBook:CENGAGEChapter:GRAPHS OF TRIGONOMETRIC FUNCTIONSExercise:Exercise
Explore 22 Videos
- GRAPHS OF ELEMENTARY FUNCTIONS Book:CENGAGEChapter:GRAPHS OF ELEMENTARY FUNCTIONS Exercise:Exercise
Explore 34 Videos
- HIGHT AND DISTANCE Book:CENGAGEChapter:HIGHT AND DISTANCE Exercise:JEE Previous Year
Explore 3 Videos
Similar Questions
Draw the graph of y=|x|
View SolutionDraw the graph of y=2x.
View SolutionDraw the graph of y=tan−1(3x−x31−3x2).
View SolutionDraw the graph of y=tan−1(tanx)
View SolutionDraw the graph of y=tan−1|x|.
View SolutionDraw the graph of y=tan2x.
View SolutionDraw the graph of y=tan−1(2x1−x2)
View SolutionDraw the graph of y=tan−1x−cot−1x.
View SolutionDraw the graph of y=tan−1x+cot−1x
View SolutionDraw the graph of y=−x
View Solution