Evaluate : , where represents the greatest integer function.
Video Solution
Text Solution
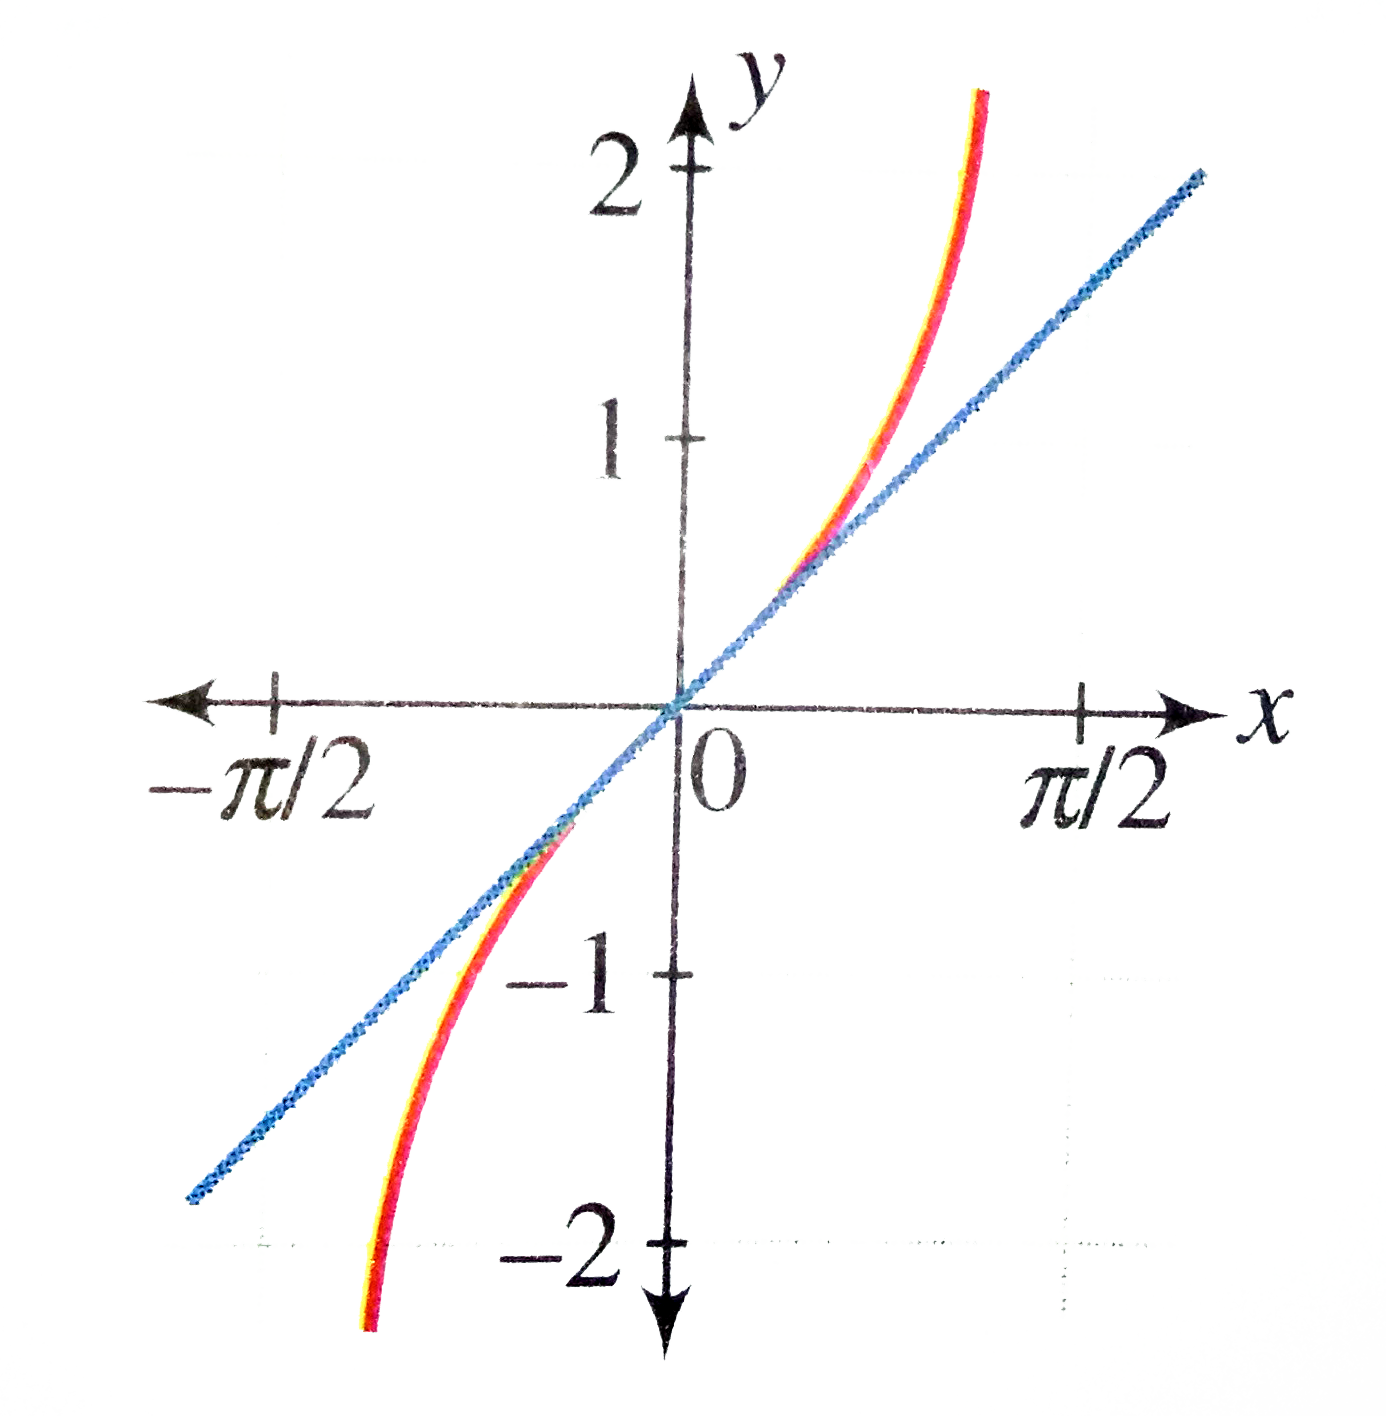
Let us first draw the graph of y = x and y = tan x.
For , i.e. the slope of the line is 1 for all real x.
For
Thus, both y = x and y = tan x have slope '1' at x = 0, hence the graphs touch each other.
Moving from '0' to the values of increase from '1' to .
Thus, the graph pf y = tan x lies below the graph of y = x.
The graphs of y = x and y = tan x are plotted as follows.

From the graph, when , the graph of y = tan x is above the graph of y = x
or
When , the graph of y = x is above the graph of y = tan x
or (as x is negative)
Thus,
|
Topper's Solved these Questions
- GRAPHS OF TRIGONOMETRIC FUNCTIONSBook:CENGAGEChapter:GRAPHS OF TRIGONOMETRIC FUNCTIONSExercise:Exercise
Explore 22 Videos
- GRAPHS OF ELEMENTARY FUNCTIONS Book:CENGAGEChapter:GRAPHS OF ELEMENTARY FUNCTIONS Exercise:Exercise
Explore 34 Videos
- HIGHT AND DISTANCE Book:CENGAGEChapter:HIGHT AND DISTANCE Exercise:JEE Previous Year
Explore 3 Videos
Similar Questions
Knowledge Check
The value of limx→0[xsinx] , where [.] represents the greatest integer function,is
A1B0C-1Dnone of theselimx→0[(1−ex)sinx|x|] is (where [.] represents the greatest integer function )
A1B2C3Dnone of these
Evaluate: [(lim)x→0tan−1xx], where [.]represent the greatest integer function
View SolutionProve that [limx→0sinxx]=0, where [.] represents the greatest integer function.
View SolutionEvaluate: (lim)x→0tanxx where [.] represents the greatest integer function
View SolutionEvaluate: (lim)x→0sinxx,where[.] represents the greatest integer function.
View Solutionlimx→0tan2[x][x]2, where [] represents greatest integer function, is
View SolutionProve that [limx→0sinx.tanxx2]=1,where [.] represents greatest integer function.
View Solution
