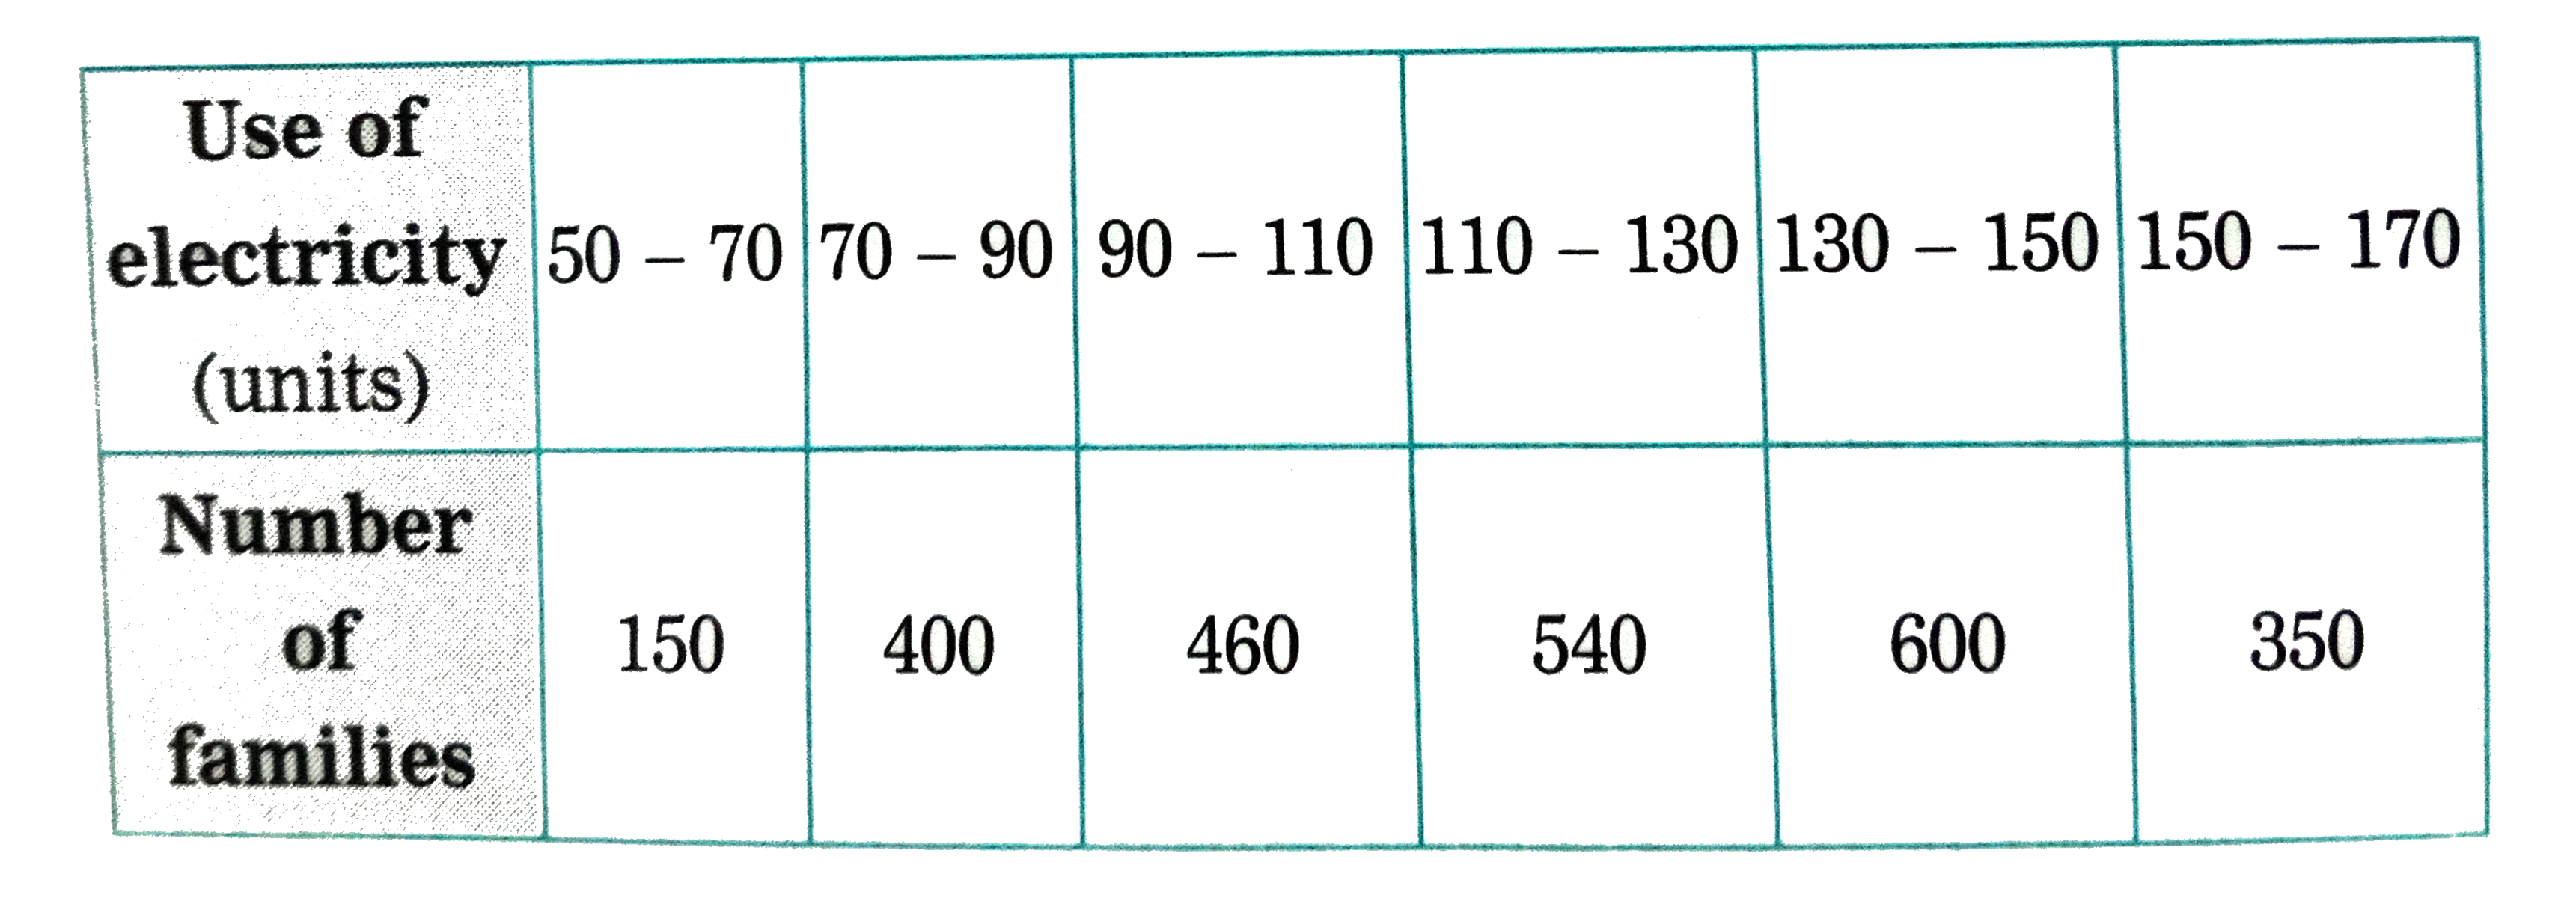
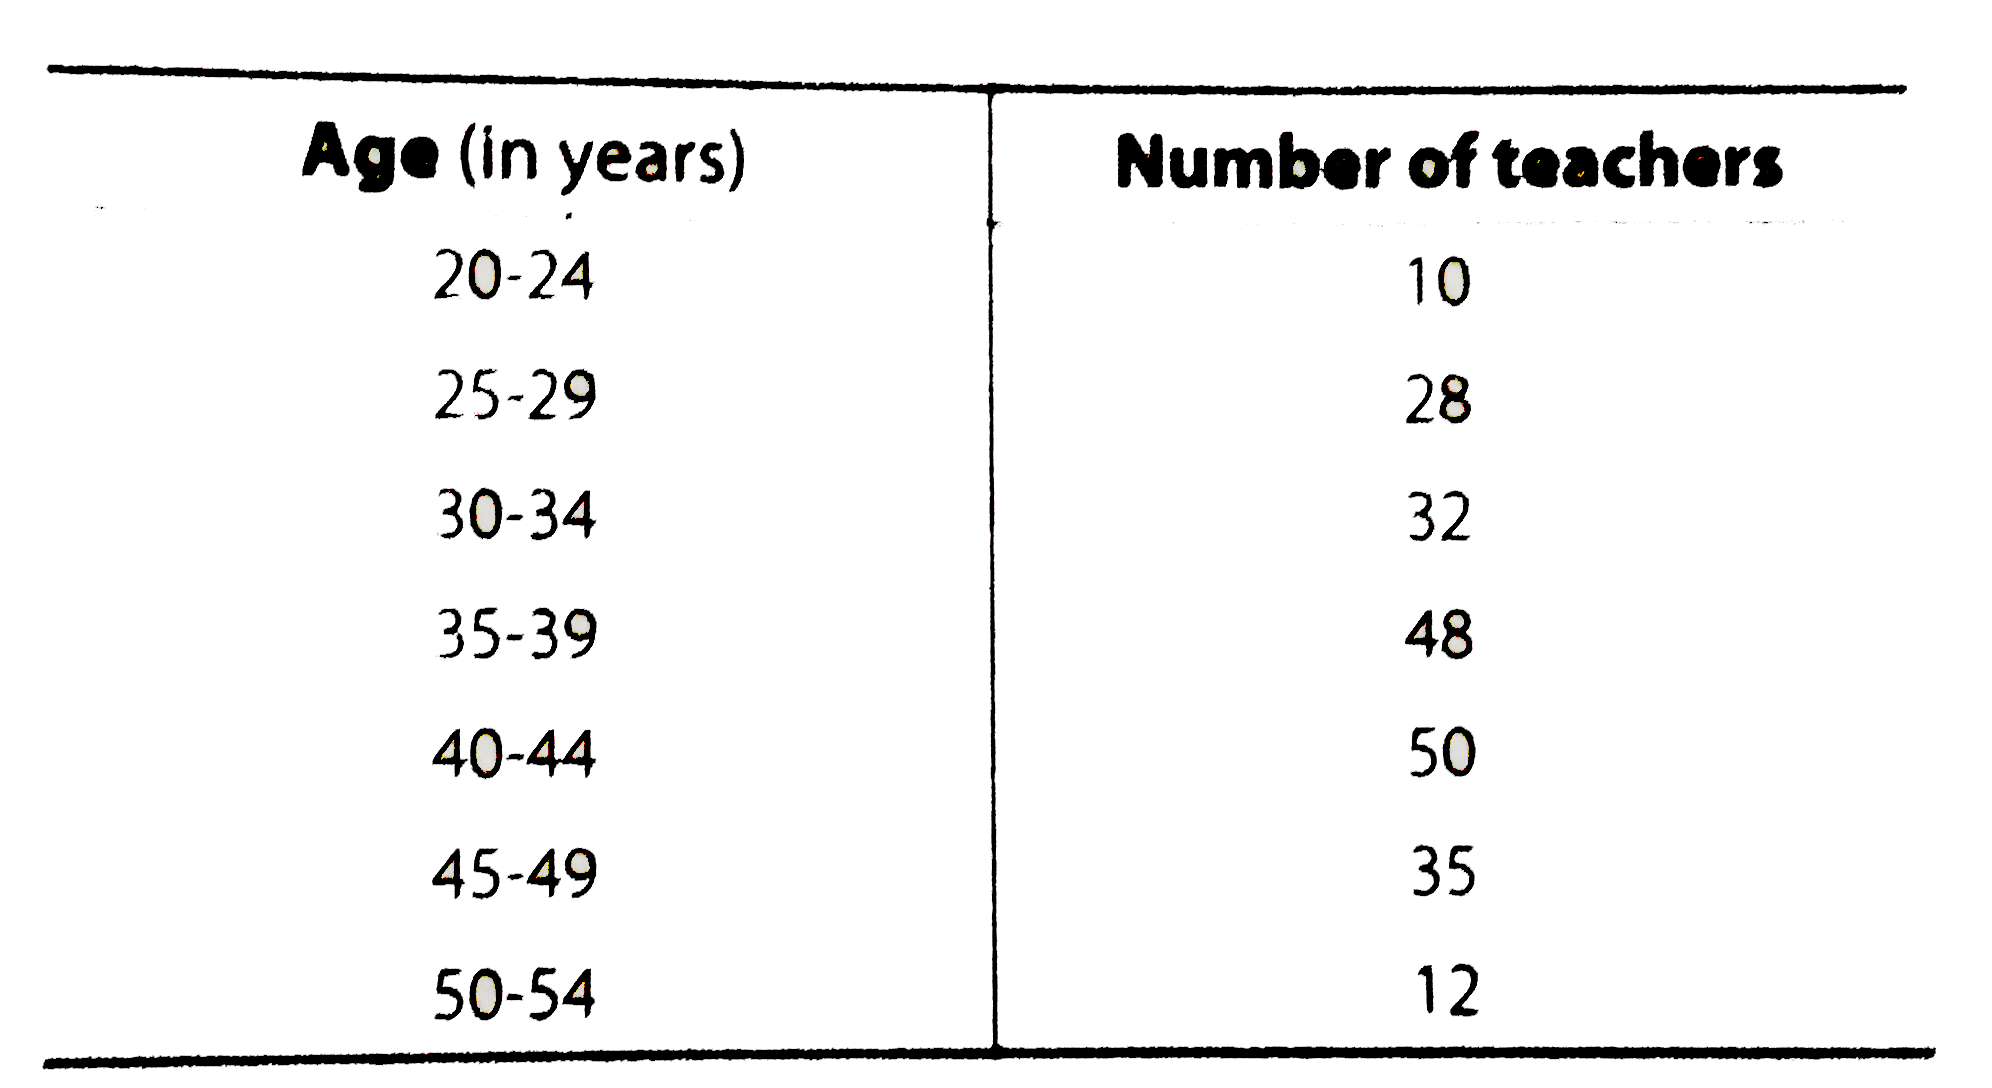
For each of the following frequencies distribution draw histogram :
(1) Profit per shop (Rs.) Number of shops 0−100 12 100−200 18 200−300 27 300−400 20 400−500 17 500−600 6
(2) 
Step by step video & image solution for For each of the following frequencies distribution draw histogram : (1) {:("Profit per shop (Rs.) ","Number of shops"),(" "0-100," "12),(" "100-200," "18),(" "200-300," "27),(" "300-400," "20),(" "400-500," "17),(" "500-600," "6):} (2) by Maths experts to help you in doubts & scoring excellent marks in Class 10 exams.
Topper's Solved these Questions
- BOOK - NAVNEET PUBLICATION - MAHARASHTRA BOARDCHAPTER - STATISTICSEXERCISE - Challenging Questions2videos
STATISTICS
- BOOK - NAVNEET PUBLICATION - MAHARASHTRA BOARDCHAPTER - SIMILARITYEXERCISE - SUBJECTIVE TYPE20videos
SIMILARITY
- BOOK - NAVNEET PUBLICATION - MAHARASHTRA BOARDCHAPTER - THEOREMS EXERCISE - CIRCLE15videos
THEOREMS
Similar Questions
Draw a histogram for the following frequency distribution.
 View Solution
Draw the Histogram for the following frequency distribution.
 View Solution
Draw the histogram for the following frequency distribution :
 View Solution
Draw a histogram of the following frequency distribution and use it to calculate the mode
View SolutionDraw a histogram to represent the following grouped frequency distribution.
 View Solution
Draw a histogram for the frequency distribution of the following data:
 View Solution
Draw a histogram for the frequency distribution of the following data:
 View Solution
Draw histogram and frequency polygon for the following distribution :
 View Solution
Drawing the histogram of a continuous grouped frequency distribution.
View SolutionDraw a histogram and frequency polygen to represent the following frequency distribution :
View Solution

