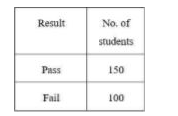
Given below is the result of an annual examination of a class, showing the percentage of students in each category .

Represent the above data by a pie chart.
Step by step video & image solution for Given below is the result of an annual examination of a class, showing the percentage of students in each category . Represent the above data by a pie chart. by Maths experts to help you in doubts & scoring excellent marks in Class 8 exams.
Updated on:21/07/2023Topper's Solved these Questions
- PIE CHARTS BOOK - RS AGGARWALCHAPTER - PIE CHARTS EXERCISE - Exercise 24B
4 Videos
- PIE CHARTS BOOK - RS AGGARWALCHAPTER - PIE CHARTS EXERCISE - Exercise 24B
4 Videos
- PERCENTAGEBOOK - RS AGGARWALCHAPTER - PERCENTAGEEXERCISE - TEST PAPER -9 ( TRUE AND FALSE )
4 Videos
- PLAYING WITH NUMBERSBOOK - RS AGGARWALCHAPTER - PLAYING WITH NUMBERSEXERCISE - Test Paper-5
11 Videos
Similar Questions
Knowledge Check
The following table shows the results of the students who have attended an examination . What percentage of students passed
 A0.3B0.4C0.6D0.5
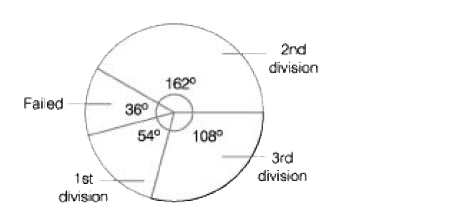
The following pie chart shows the performance in an examination in a particular year for 360 students. The percentage of students who have failed in the examination is
 A0.2B0.36C0.1D0.3
In a school, there are five sections of Class VI. The number of students in each section is given below:

Represent the above data using a bar graph.
View SolutionDraw a pictograph for representing the number of students in each class based on the given data.

View SolutionThe table shows the marks Porpu obtained in an Examination.Subject Math Science English Hindi. Science Computer. Represent the above data by a pie chart.97
View SolutionThe marks obtained by a student in an examination are given below :

Represent the data using a pie diagram.
View SolutionThe marks obtained by a student in an examination are given below:

Represent the data using pie diagram
View SolutionThe marks obtained by a student in an examination are given below:

Represent the data using pie diagram.
View Solution

