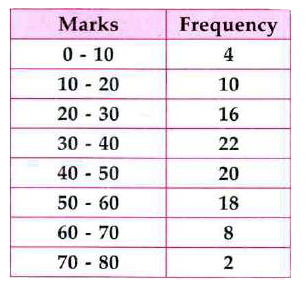
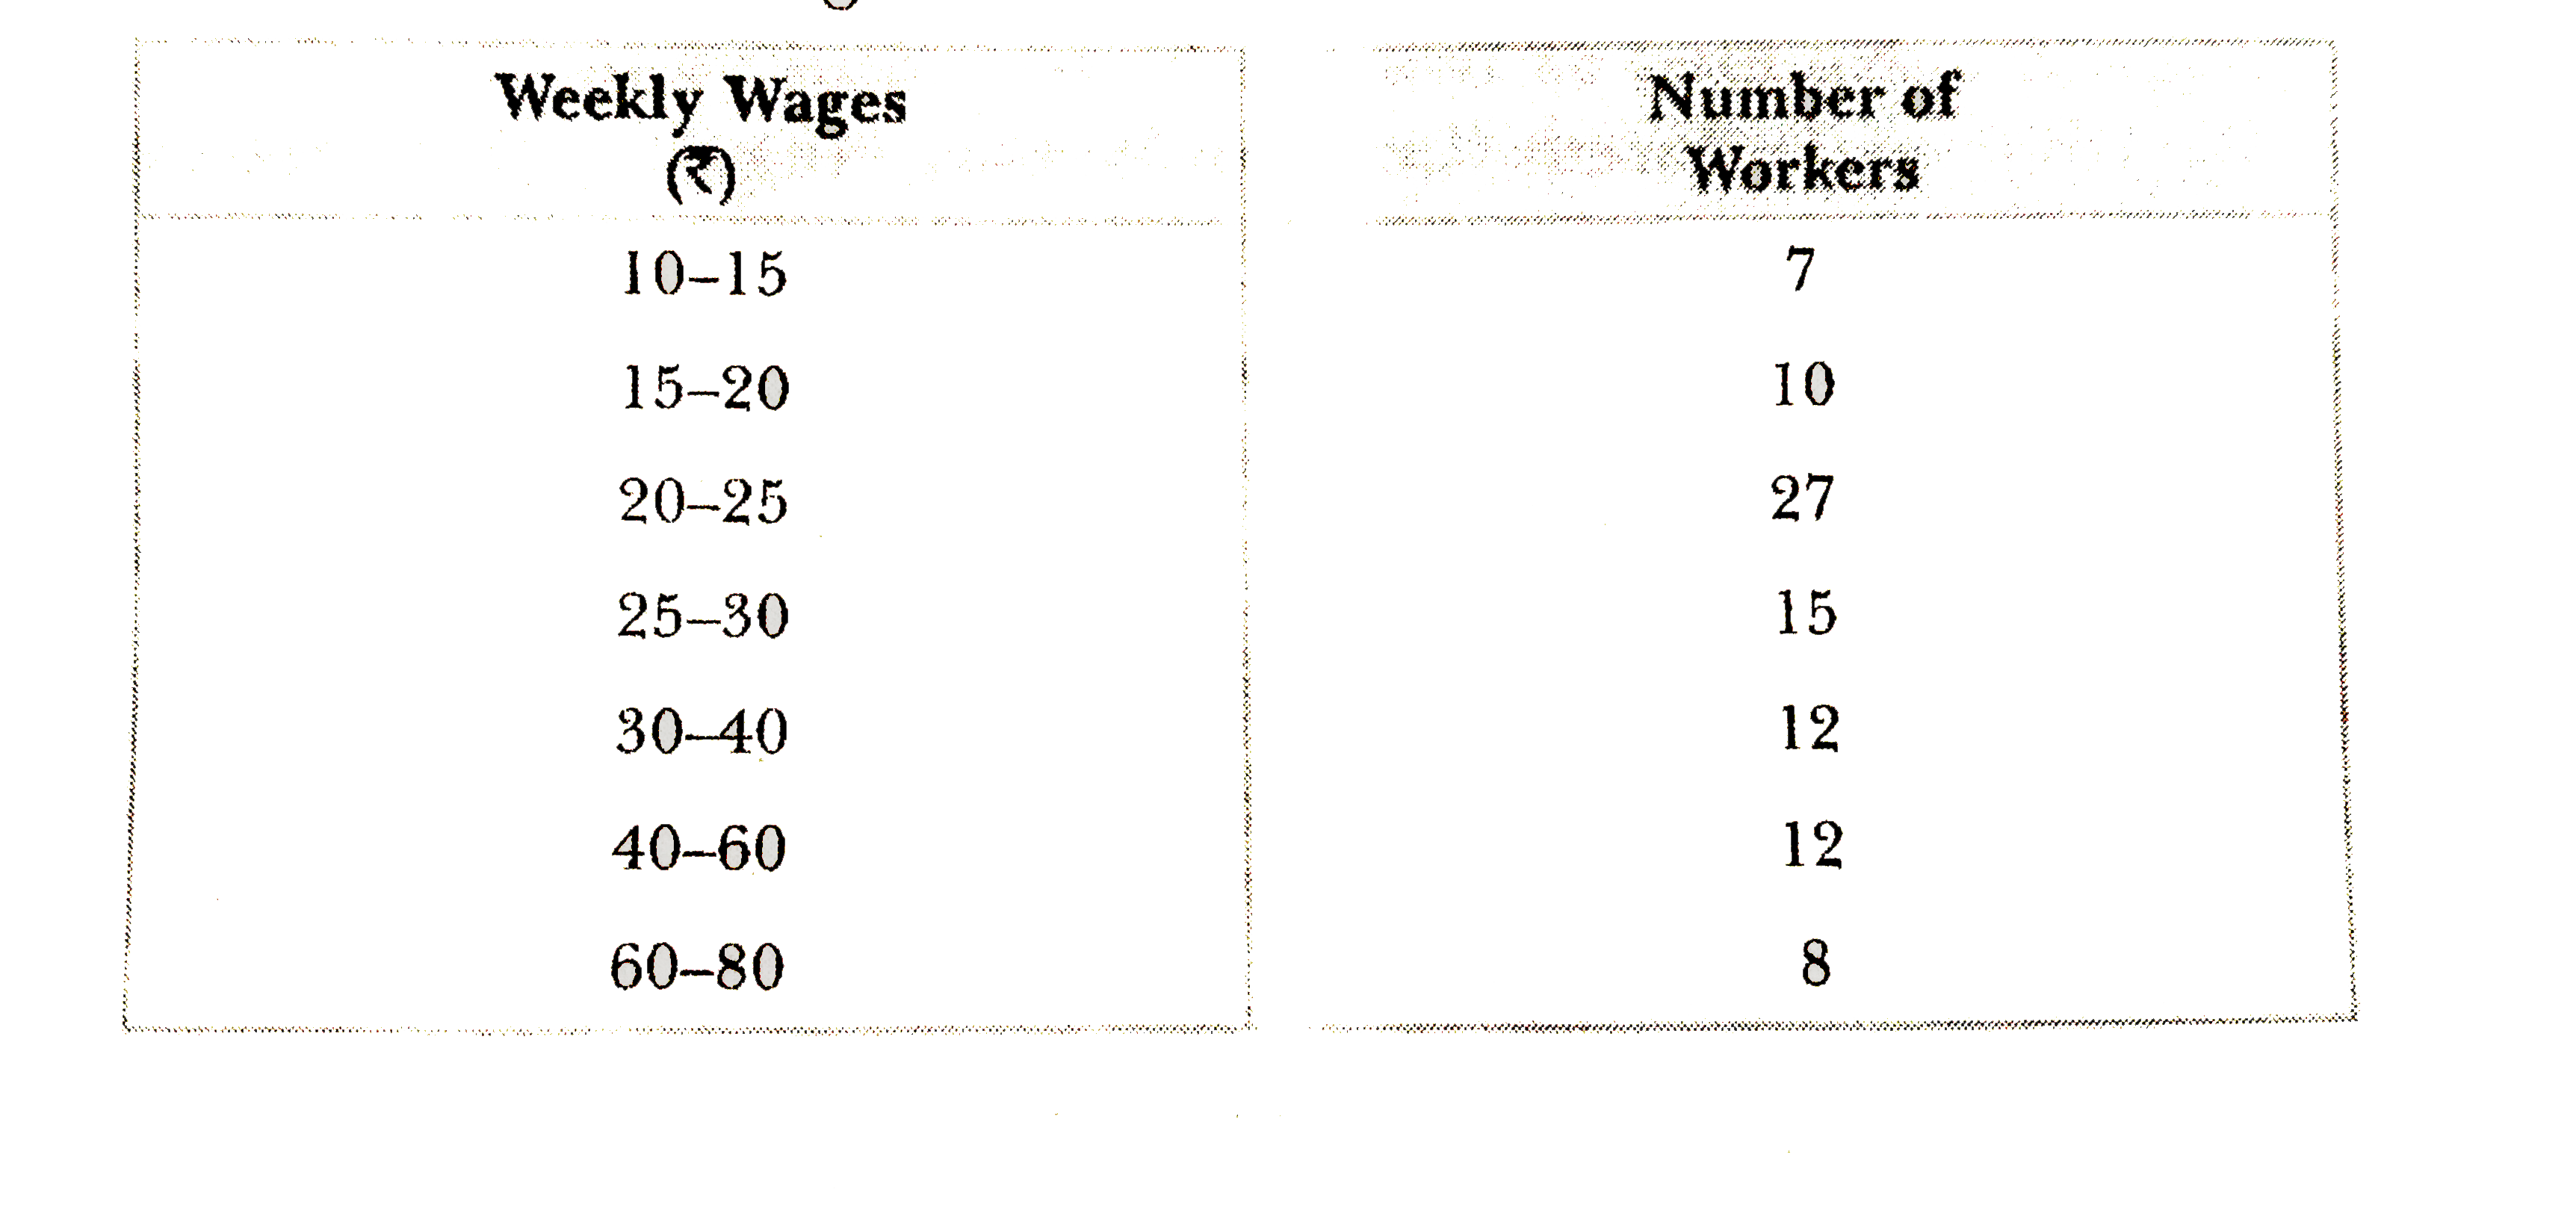
In the following table, the investment made by 210 families is shown. Present it in the form of a histogram.

Step by step video & image solution for In the following table, the investment made by 210 families is shown. Present it in the form of a histogram. by Maths experts to help you in doubts & scoring excellent marks in Class 10 exams.
Topper's Solved these Questions
- BOOK - TARGET PUBLICATIONCHAPTER - STATISTICSEXERCISE - Practise Set 6.52videos
STATISTICS
- BOOK - TARGET PUBLICATIONCHAPTER - STATISTICSEXERCISE - Practise Set 6.66videos
STATISTICS
- BOOK - TARGET PUBLICATIONCHAPTER - STATISTICSEXERCISE - Practise Set 6.34videos
STATISTICS
- BOOK - TARGET PUBLICATIONCHAPTER - SIMILARITY EXERCISE - Chapter Assessment19videos
SIMILARITY
- BOOK - TARGET PUBLICATIONCHAPTER - TRIGONOMETRY EXERCISE - Chapter Assessment18videos
TRIGONOMETRY
Similar Questions
Knowledge Check
- Question 1 - Select One
The process of presenting data in the form of a table in called:
AorganisationBclassificationCpresentationDtabulation
Present the following data in the form of a histogram :
 View Solution
The table below shows number of students of students of a college corresponding to different range of marks in Statistics. Present the information in the form of a histogram.
 View Solution
The following table gives the marks scored by 100 students in an entrance examination

Represent this data in the form of a histogram.View SolutionIn the following table, the information is given about the number of famillies and the sivlings in each family. Find the mode of the numberof siblings.
 View Solution
The following data shows the number of children in 20 families

Make a frequency table for above dataView SolutionThe following table shows the number of illitrate persons in the age group (10-58 Years) in a town. Represents the given data by means of a histogram.
 View Solution
Present the data given in the table below in a histogram :
 View Solution


