Read the bar graph given below :
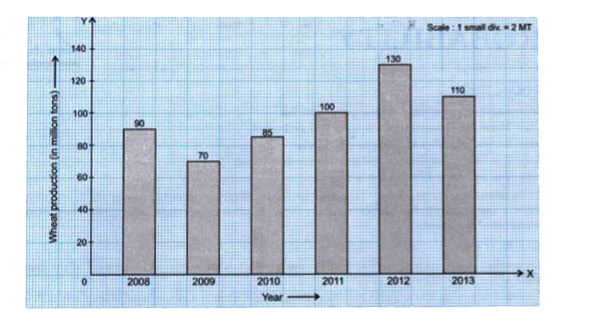
Find the percentage increase in wheat production in the year 2012.
35
30
40
25
The correct Answer is:B
Step by step video & image solution for Read the bar graph given below : Find the percentage increase in wheat production in the year 2012. by Maths experts to help you in doubts & scoring excellent marks in Class 7 exams.
Updated on:21/07/2023Topper's Solved these Questions
Similar Questions
Read the bar graph given below :
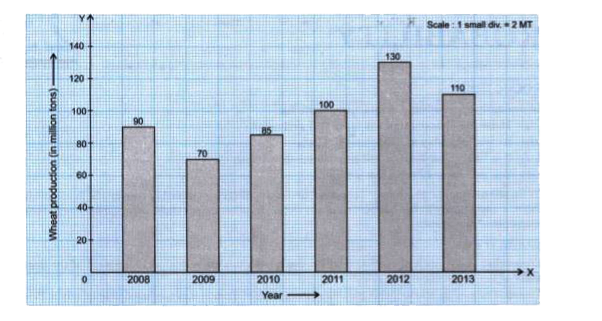
In which year there was maximum increase in production of wheat?
View SolutionRead the bar graph given below :
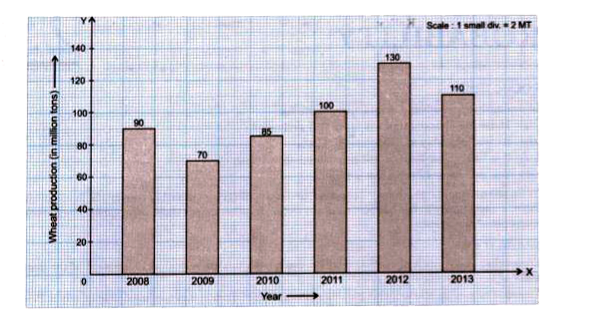
What was the wheat production in 2010?
View SolutionRead the bar graph given below :
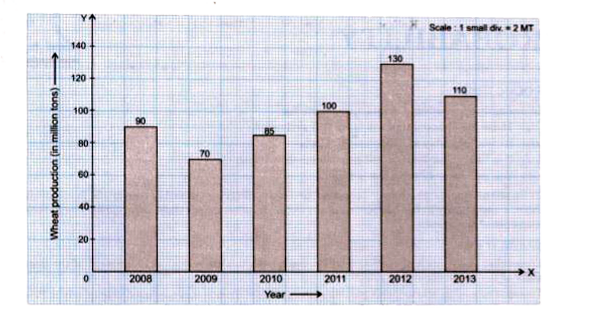
In which year the production was minimum?
View SolutionRead the bar graph given below :
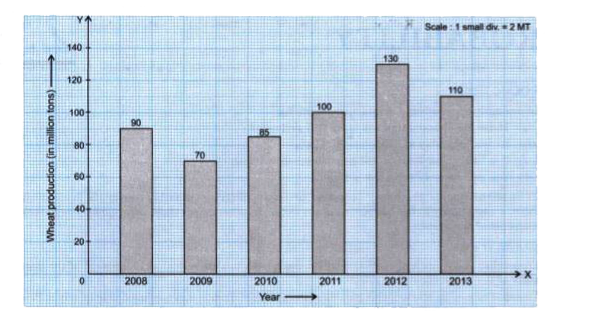
What information is given by the bar graph?
View SolutionAsha's mother told her that when she was a child, the price of wheat was Rs2/kg. The price of wheat today is Rs36/kg. Find the percentage increase in the price of the wheat.
View SolutionComplete the given reaction and find the percentage weight of carbon in the product.

View SolutionFind the percentage of water in the following
Rice and wheat grains
View SolutionRead the statement given below and find the incorrect statement
View SolutionObserve the bar graph given below :
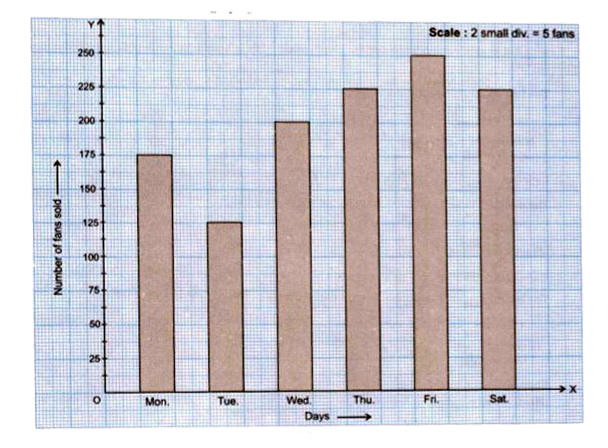
Read the bar graph carefully and answer the following questions :
What information is given by the bar graph?
View SolutionRead the bar graph given in Figure and answer the following questions: What information is given by the bar graph? What was the expenditure on health and family planning in year 1982-83 In which year is the increase in expenditure maximum over the expenditure in previous year? What is the maximum increase?
View Solution
