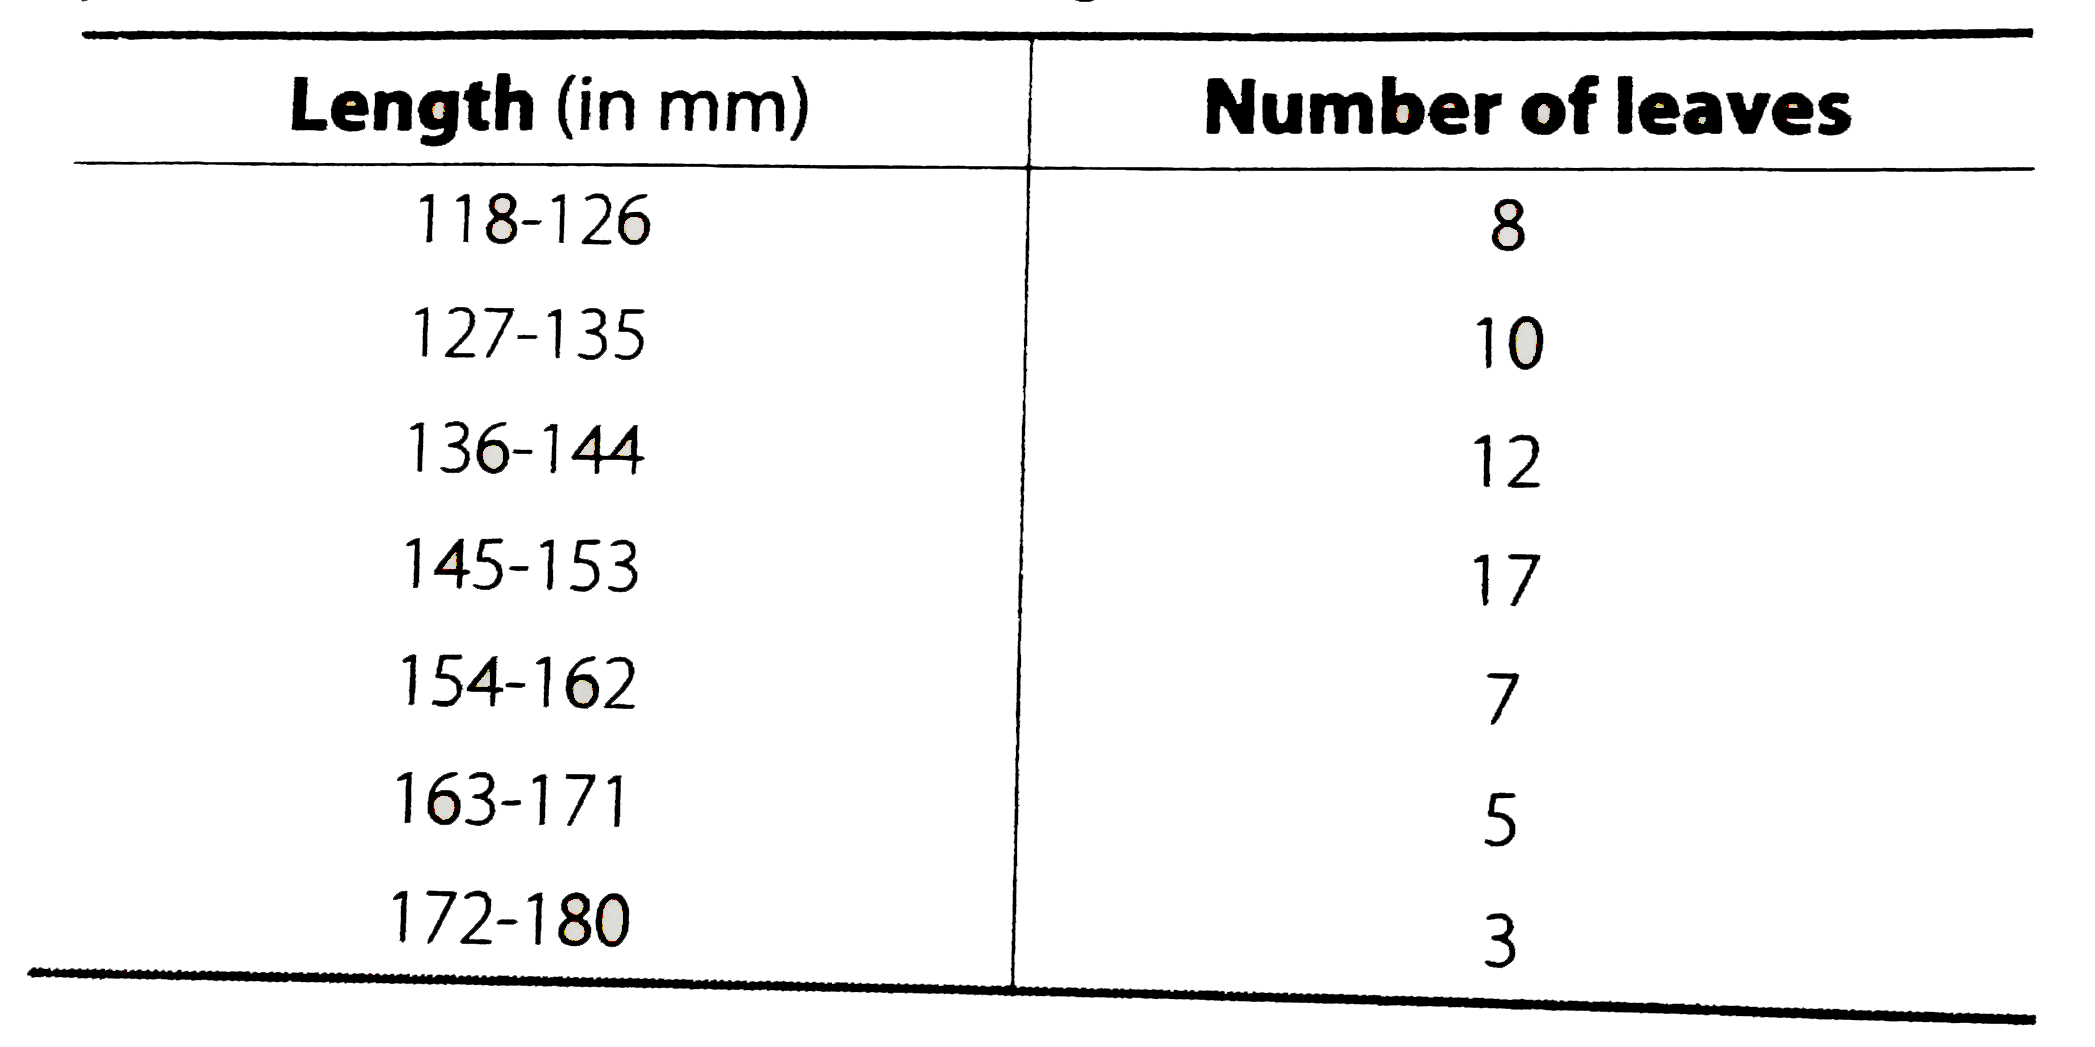
Represent
the following data by means of historgram.

Video Solution
Text Solution
Since the class intervals are of unequal width, we use Adjusted Frequency
Adjusted Frequency= (Minimum class sizeclass size)×Frequency of class


|
Topper's Solved these Questions
Similar Questions
Knowledge Check
The mean of the following data is
 A49.5B50.5C51.5D55.5
Represent the following data using a histogram.

View SolutionThe marks obtained by 60 students of a class in a methematics test are given

Represent the above data by means of a histogram.
View SolutionRepresent the following data by frequency curve :

View SolutionThe lengths of 62 levels of a plant are measured in millimetres and the data is represented in the following table

Draw a histrogram to represent the data above.
View SolutionFind the mean of following data :

View SolutionFind the mean of the following data.

View SolutionFind the mean of the following data:
View Solution


