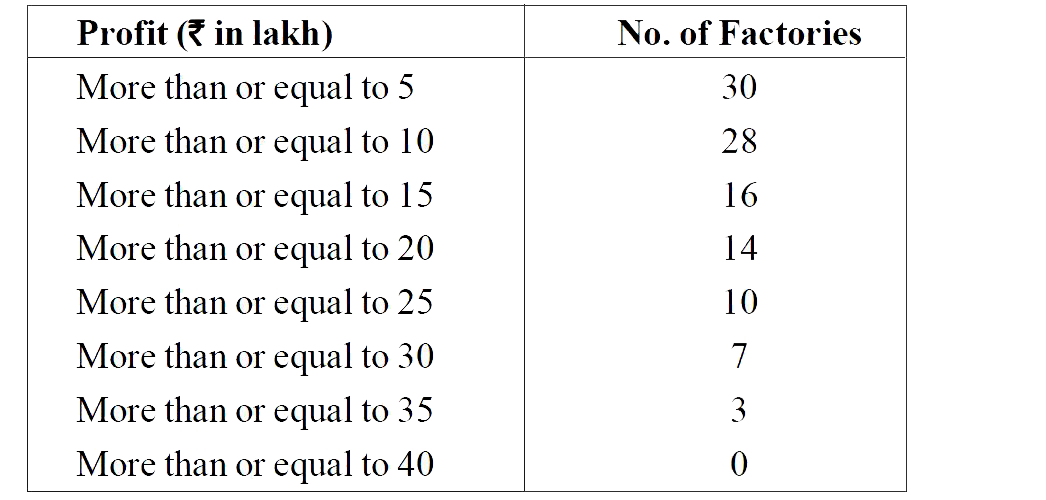
The annual profits earned by 30 shops of a shopping complex in a locality give rise to the following distribution:Draw both ogives for the data above. Hence obtain the median profit.
Please refer to video to draw ogives of the given data.
From the graph, we can see that ogive of both 'more than' and 'less than' intersect at a point where x=17.5.
So, Median profit is 17.5.
Topper's Solved these Questions
- STATISTICSBOOK - NCERT ENGLISHCHAPTER - STATISTICSEXERCISE - EXERCISE 14.4
3 Videos
- STATISTICSBOOK - NCERT ENGLISHCHAPTER - STATISTICSEXERCISE - Exercise 14.3
7 Videos
- SOME APPLICATIONS OF TRIGONOMETRYBOOK - NCERT ENGLISHCHAPTER - SOME APPLICATIONS OF TRIGONOMETRYEXERCISE - SOLVED EXAMPLES
7 Videos
- SURFACE AREAS AND VOLUMESBOOK - NCERT ENGLISHCHAPTER - SURFACE AREAS AND VOLUMESEXERCISE - Exercise 13.3
9 Videos
Similar Questions
The annual profits earned by 30 shops of a shopping complex in a locality give rise to the following distribution: Profit (in lakhs in Rs) Number of shops (frequency) More than or equal to 5 30 More than or equal to 10 28 More than or equal to 15 16 More than or equal to 20 14 More than or equal to 25 10 More than or equal to 30 7 More than or equal to 35 3 Draw both ogives for the above data and hence obtain the median.
View SolutionThe annual profit earned by 30 factories in an industrial area is given below
Draw both ogives for the data and hence find the median.

View SolutionFor the following data, draw a 'less than' ogive and hence find the median of the distribution.

View SolutionFor the following data, draw a 'less than' ogive and hence find the median of the distribution.

View Solutionfor the following data, draw a less than ogive and hence find the median of the distribution.
View SolutionIn a study of the cases of diabetes the following data was obtained.

Draw a less than ogive for above data .
View SolutionFor the following frequency distribution, draw a cumulative frequency curve of more than type and hence obtain the median value:

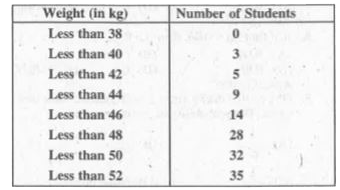
View SolutionDuring the medical check up of 35 students of a class, their weights were recorded as follows :
Draw a less then type ogive for the given data. Hence obtain the median weight from the graph and verify the result by using the formula.

View SolutionDuring the medical check-up of 35 students of a class, their weights were recorded as follows: Draw a less than type ogive for the given data. Hence obtain the median weight from the graph and verify the result by using the formula. weight (in kg)=38-40 40-42 42-44 44-46 46-48 48-50 50-52 No. of students=3 2 4 5 14 4 3
View SolutionDuring the medical check-up of 35 students of a class, their weights were recorded as follows:Draw a less than type ogive for the given data. Hence obtain the median weight from the graph and verify the result by using the formula.
View Solution
