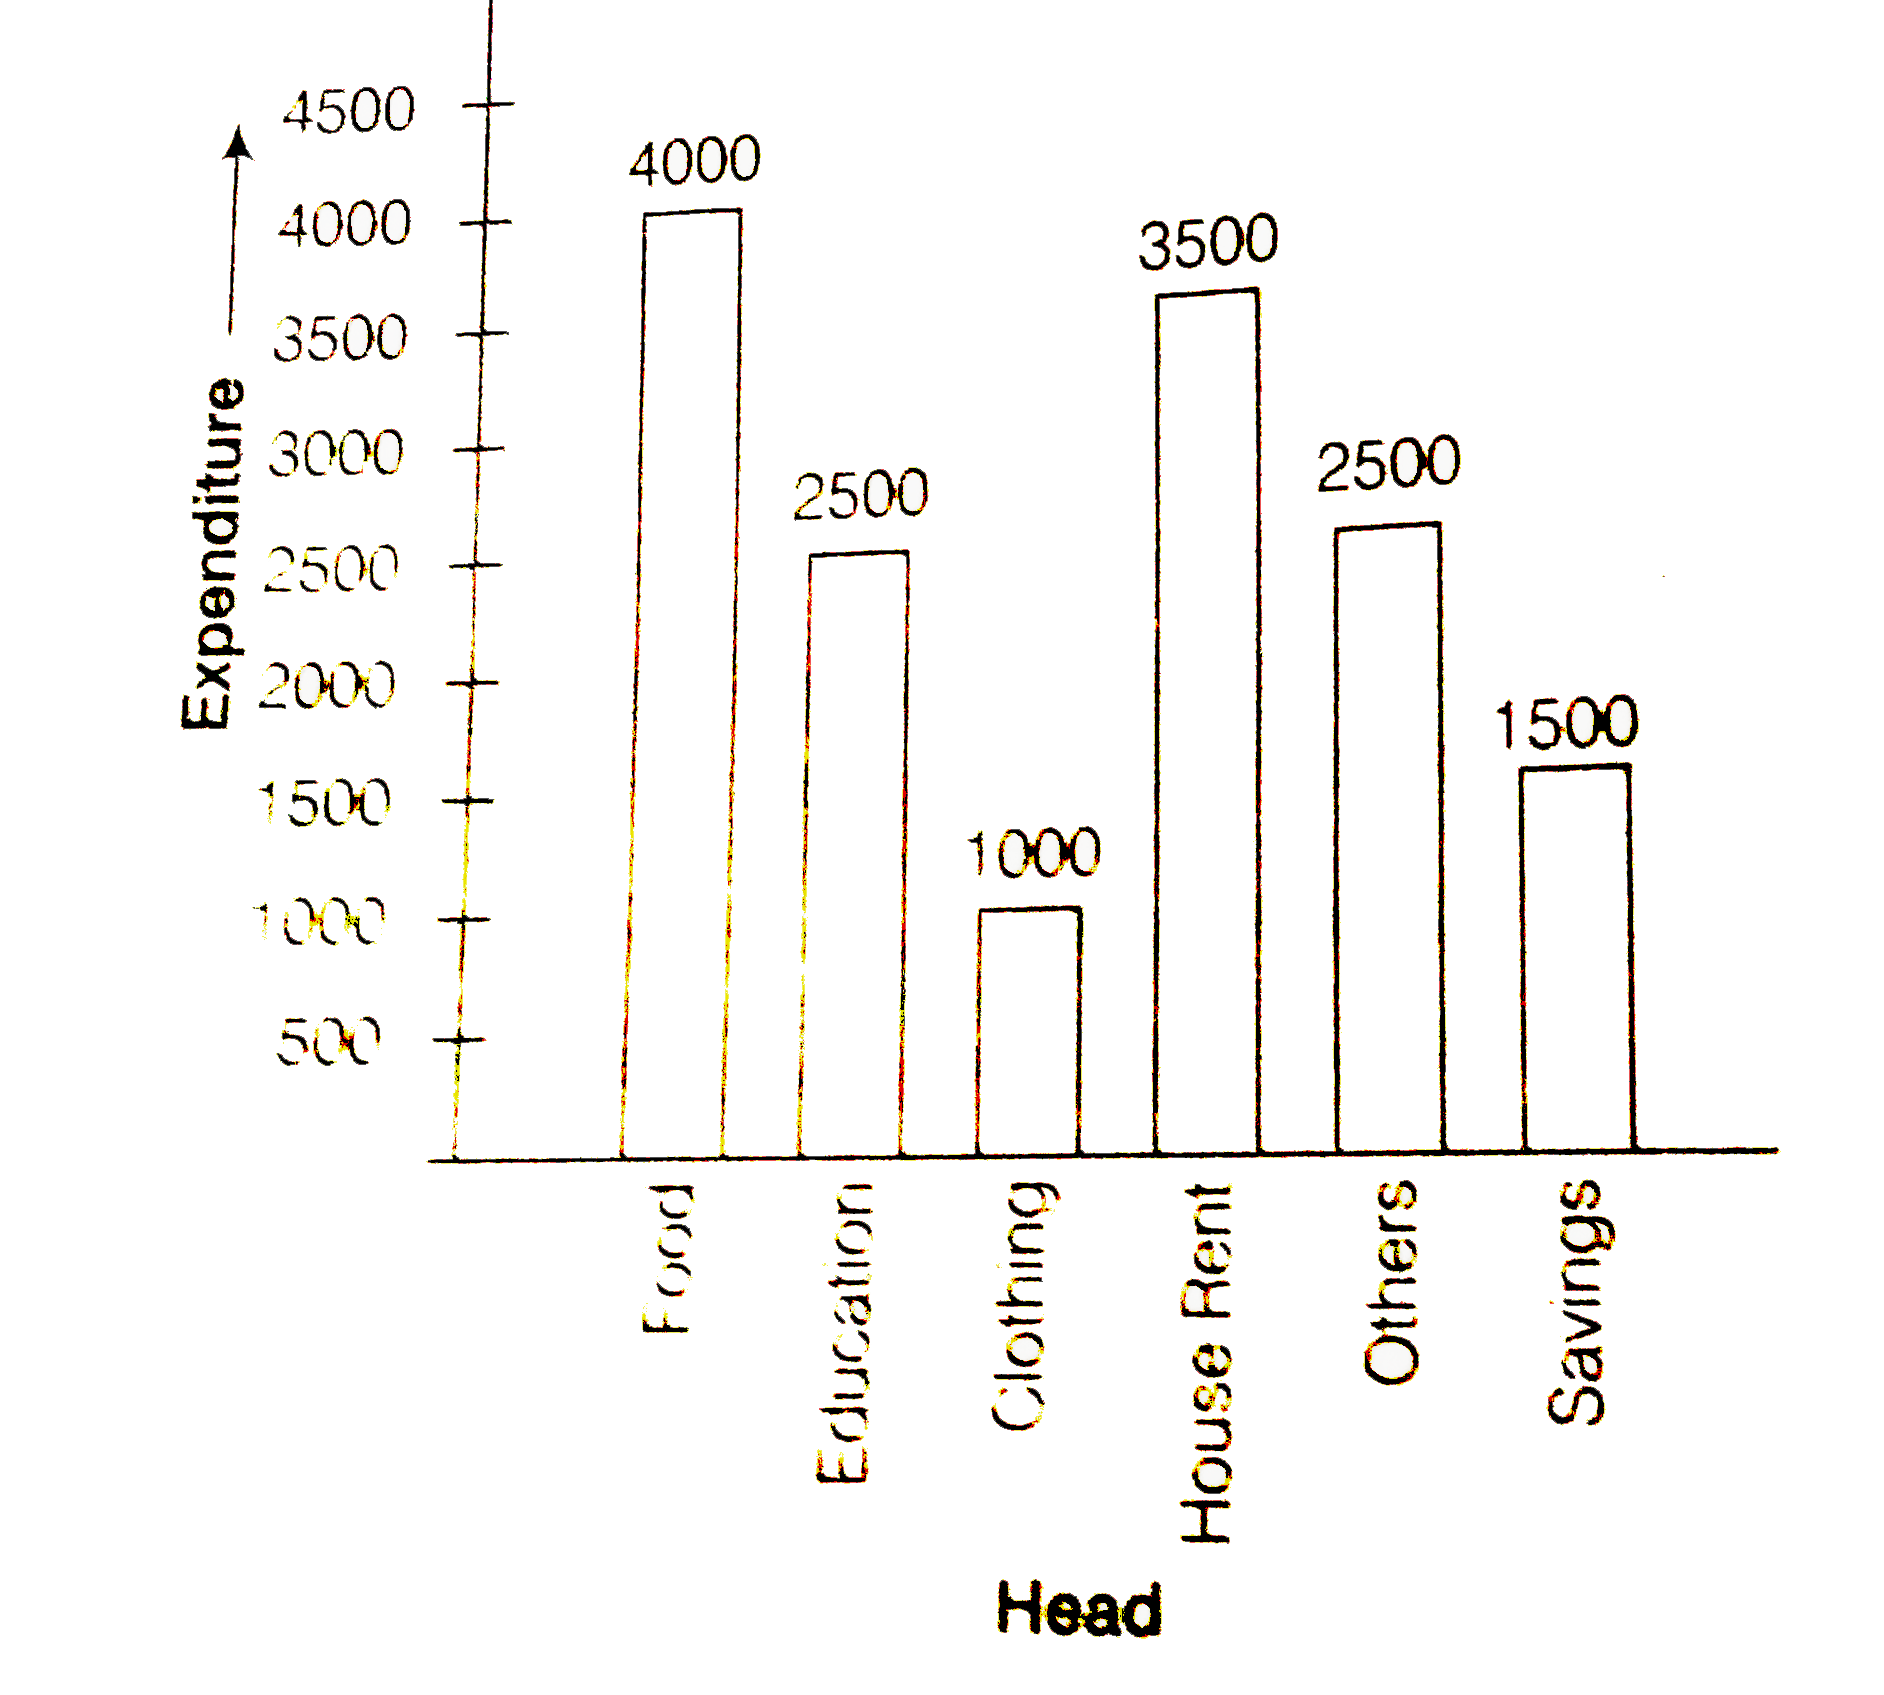
The expenditure of a family of different heads in a month is given below

Draw a bar graph to represent the data above.
We draw a bar graph of this data in the following steps.
Steps I We represent the heads(variable) on the horizontal axis choosing any scale, as the width of the bar is not important. But for clarity, we take equal widths for all bars and maintain equal gaps in between them. Let one head be represented by one unit.
Step II We represent the expenditure on the veritcal axis. Since, the maximum expenditure is Rs 4000. We can choosethe scale as 1 unit = Rs 500.
Step III To represent our first head i.e., food, we draw a reactangular bar with width 1 unit and height 8 units.
Step IV Similarly, other heads are represented a leaving a gap of 12 unit in between two consecutive bars.
The bars graphs for given data is shown below.

Topper's Solved these Questions
- STATISTICS AND PROBABILITYBOOK - NCERT EXEMPLAR ENGLISHCHAPTER - STATISTICS AND PROBABILITYEXERCISE - LONG ANSWER TYPE QUESTIONS
12 Videos
- STATISTICS AND PROBABILITYBOOK - NCERT EXEMPLAR ENGLISHCHAPTER - STATISTICS AND PROBABILITYEXERCISE - VERY SHORT ANSWER TYPES QUESTIONS
10 Videos
- QUADRILATERALS BOOK - NCERT EXEMPLAR ENGLISHCHAPTER - QUADRILATERALS EXERCISE - LONG ANSWER TYPE QUESTIONS
18 Videos
- TRIANGLESBOOK - NCERT EXEMPLAR ENGLISHCHAPTER - TRIANGLESEXERCISE - LONG ANSWER TYPE QUESTIONS
21 Videos
Similar Questions
The approximate speeds of some objects are given below. Draw a bar graph to represent them.

View SolutionThe approximate speeds of some objects are given below. Draw a bar graph to represent them:

View SolutionDraw a bar graph from the following data:

View SolutionThe following data on the number of girls (to the nearest ten) per thousand boys in different sections of Indian society is given below. Draw bar graph for the the data given below.
View SolutionThe percentage of marks obtained, in different subjects by Ashok Sharma (in an examination) are given below. Draw a bar graph to represent it.

View SolutionIn a school, there are five sections of class VII. The number of students in each section is given below. Construct a bar graph representing this data: Section, A, B, C, D, E No. of Students, 40, 48, 52, 45, 30
View SolutionIn a school, there are five sections of class IX. The number of students in each section is given below. Construct a bar graph representing this data: Section: A B C D E No. of Students 40 48 52 45 30
View SolutionThe number of Mathematics books sold by a shopkeeper on six consecutive days is shown below Draw a bar graph to represent the above information choosing the scale of your choice.
View SolutionThe following data shows the expenditure of a person on different items during a month. Represent the data by a pie-chart. Items of expenditure, Rent, Education, Food, Clothing, Others Amount (in Rs.), 2700, 1800, 2400, 1500, 2400
View SolutionIn a class of 40 students, the marks obtained (out of 50) are as given below:

Draw a histogram to represent the given data.
View Solution
