In a school, there are five sections of class VII. The number of students in each section is given below. Construct a bar graph representing this data: Section, A, B, C, D, E No. of Students, 40, 48, 52, 45, 30
To construct a bar graph representing the number of students in each section of class VII, follow these steps:
Step 1: Organize the Data
Create a table to organize the data for the sections and the number of students.
| Section | Number of Students |
|---------|--------------------|
| A | 40 |
| B | 48 |
| C | 52 |
| D | 45 |
| E | 30 |
Step 2: Draw the Axes
Draw two perpendicular lines to represent the axes of the bar graph. The horizontal axis (x-axis) will represent the sections (A, B, C, D, E), and the vertical axis (y-axis) will represent the number of students.
Step 3: Label the Axes
Label the x-axis with the sections (A, B, C, D, E) and the y-axis with numbers representing the number of students. You can mark the y-axis with intervals (for example, 0, 10, 20, 30, 40, 50, 60).
Step 4: Determine the Height of Each Bar
For each section, determine the height of the bar based on the number of students:
- Section A: 40 students
- Section B: 48 students
- Section C: 52 students
- Section D: 45 students
- Section E: 30 students
Step 5: Draw the Bars
Draw vertical bars for each section corresponding to the number of students:
- For Section A, draw a bar up to 40 on the y-axis.
- For Section B, draw a bar up to 48 on the y-axis.
- For Section C, draw a bar up to 52 on the y-axis.
- For Section D, draw a bar up to 45 on the y-axis.
- For Section E, draw a bar up to 30 on the y-axis.
Step 6: Finalize the Graph
Make sure all bars are of equal width and are spaced evenly. Label each bar with the number of students it represents for clarity.
Step 7: Review the Graph
Check the graph to ensure that all sections and their corresponding number of students are accurately represented.
---
Create a table to organize the data for the sections and the number of students.
|---------|--------------------|
| A | 40 |
| B | 48 |
| C | 52 |
| D | 45 |
| E | 30 |
Draw two perpendicular lines to represent the axes of the bar graph. The horizontal axis (x-axis) will represent the sections (A, B, C, D, E), and the vertical axis (y-axis) will represent the number of students.
Label the x-axis with the sections (A, B, C, D, E) and the y-axis with numbers representing the number of students. You can mark the y-axis with intervals (for example, 0, 10, 20, 30, 40, 50, 60).
For each section, determine the height of the bar based on the number of students:
- Section A: 40 students
- Section B: 48 students
- Section C: 52 students
- Section D: 45 students
- Section E: 30 students
Draw vertical bars for each section corresponding to the number of students:
- For Section A, draw a bar up to 40 on the y-axis.
- For Section B, draw a bar up to 48 on the y-axis.
- For Section C, draw a bar up to 52 on the y-axis.
- For Section D, draw a bar up to 45 on the y-axis.
- For Section E, draw a bar up to 30 on the y-axis.
Make sure all bars are of equal width and are spaced evenly. Label each bar with the number of students it represents for clarity.
Check the graph to ensure that all sections and their corresponding number of students are accurately represented.
Topper's Solved these Questions
Similar Questions
In a school there are five sections of class IX. The number of students in each section is given below.
Construct a bar graph.

View SolutionIn a school, there are five sections of class IX. The number of students in each section is given below. Construct a bar graph representing this data: Section: A B C D E No. of Students 40 48 52 45 30
View SolutionThe daily pocket expenses of 206 students in a school are given below.

Construct a frequency polygon representing the above data.
View SolutionThe marks obtained (out of 100) by a class of 80 students are given below:

Construct a histogram to represent the data above
View SolutionIn a class of 40 students, the marks obtained (out of 50) are as given below:

Draw a histogram to represent the given data.
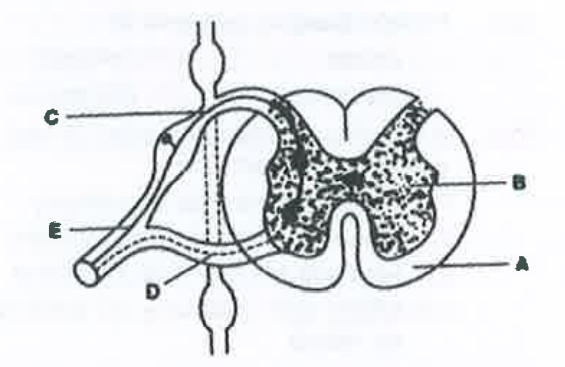
View SolutionIn a cross section of the spinal cord A, B, C, D and E represent

View SolutionThe number of students in section X A and X B are 30 and 35 respectively. The mean scores of students in the mathematices test are as follows:

View SolutionThere are 100 students in class VII in a school. 40 students are in Section A, 33 in Section B, and the remaining students are in Section C. Find what percentage of students are there in each section.
View SolutionIn a school there are two sections section A and section B of class X . There are 32 students in section A and 36 students in section B . Determine the minimum number of books required for their class library so that they can be distributed equally among students of section A or section B .
View SolutionIn a school there are two sections - section A and section B of Class VI. There are 32 students in section A and 36 in section B. Determine the minimum number of books required for their class library so that they can be distributed equally among students of section A or section B.
View Solution
