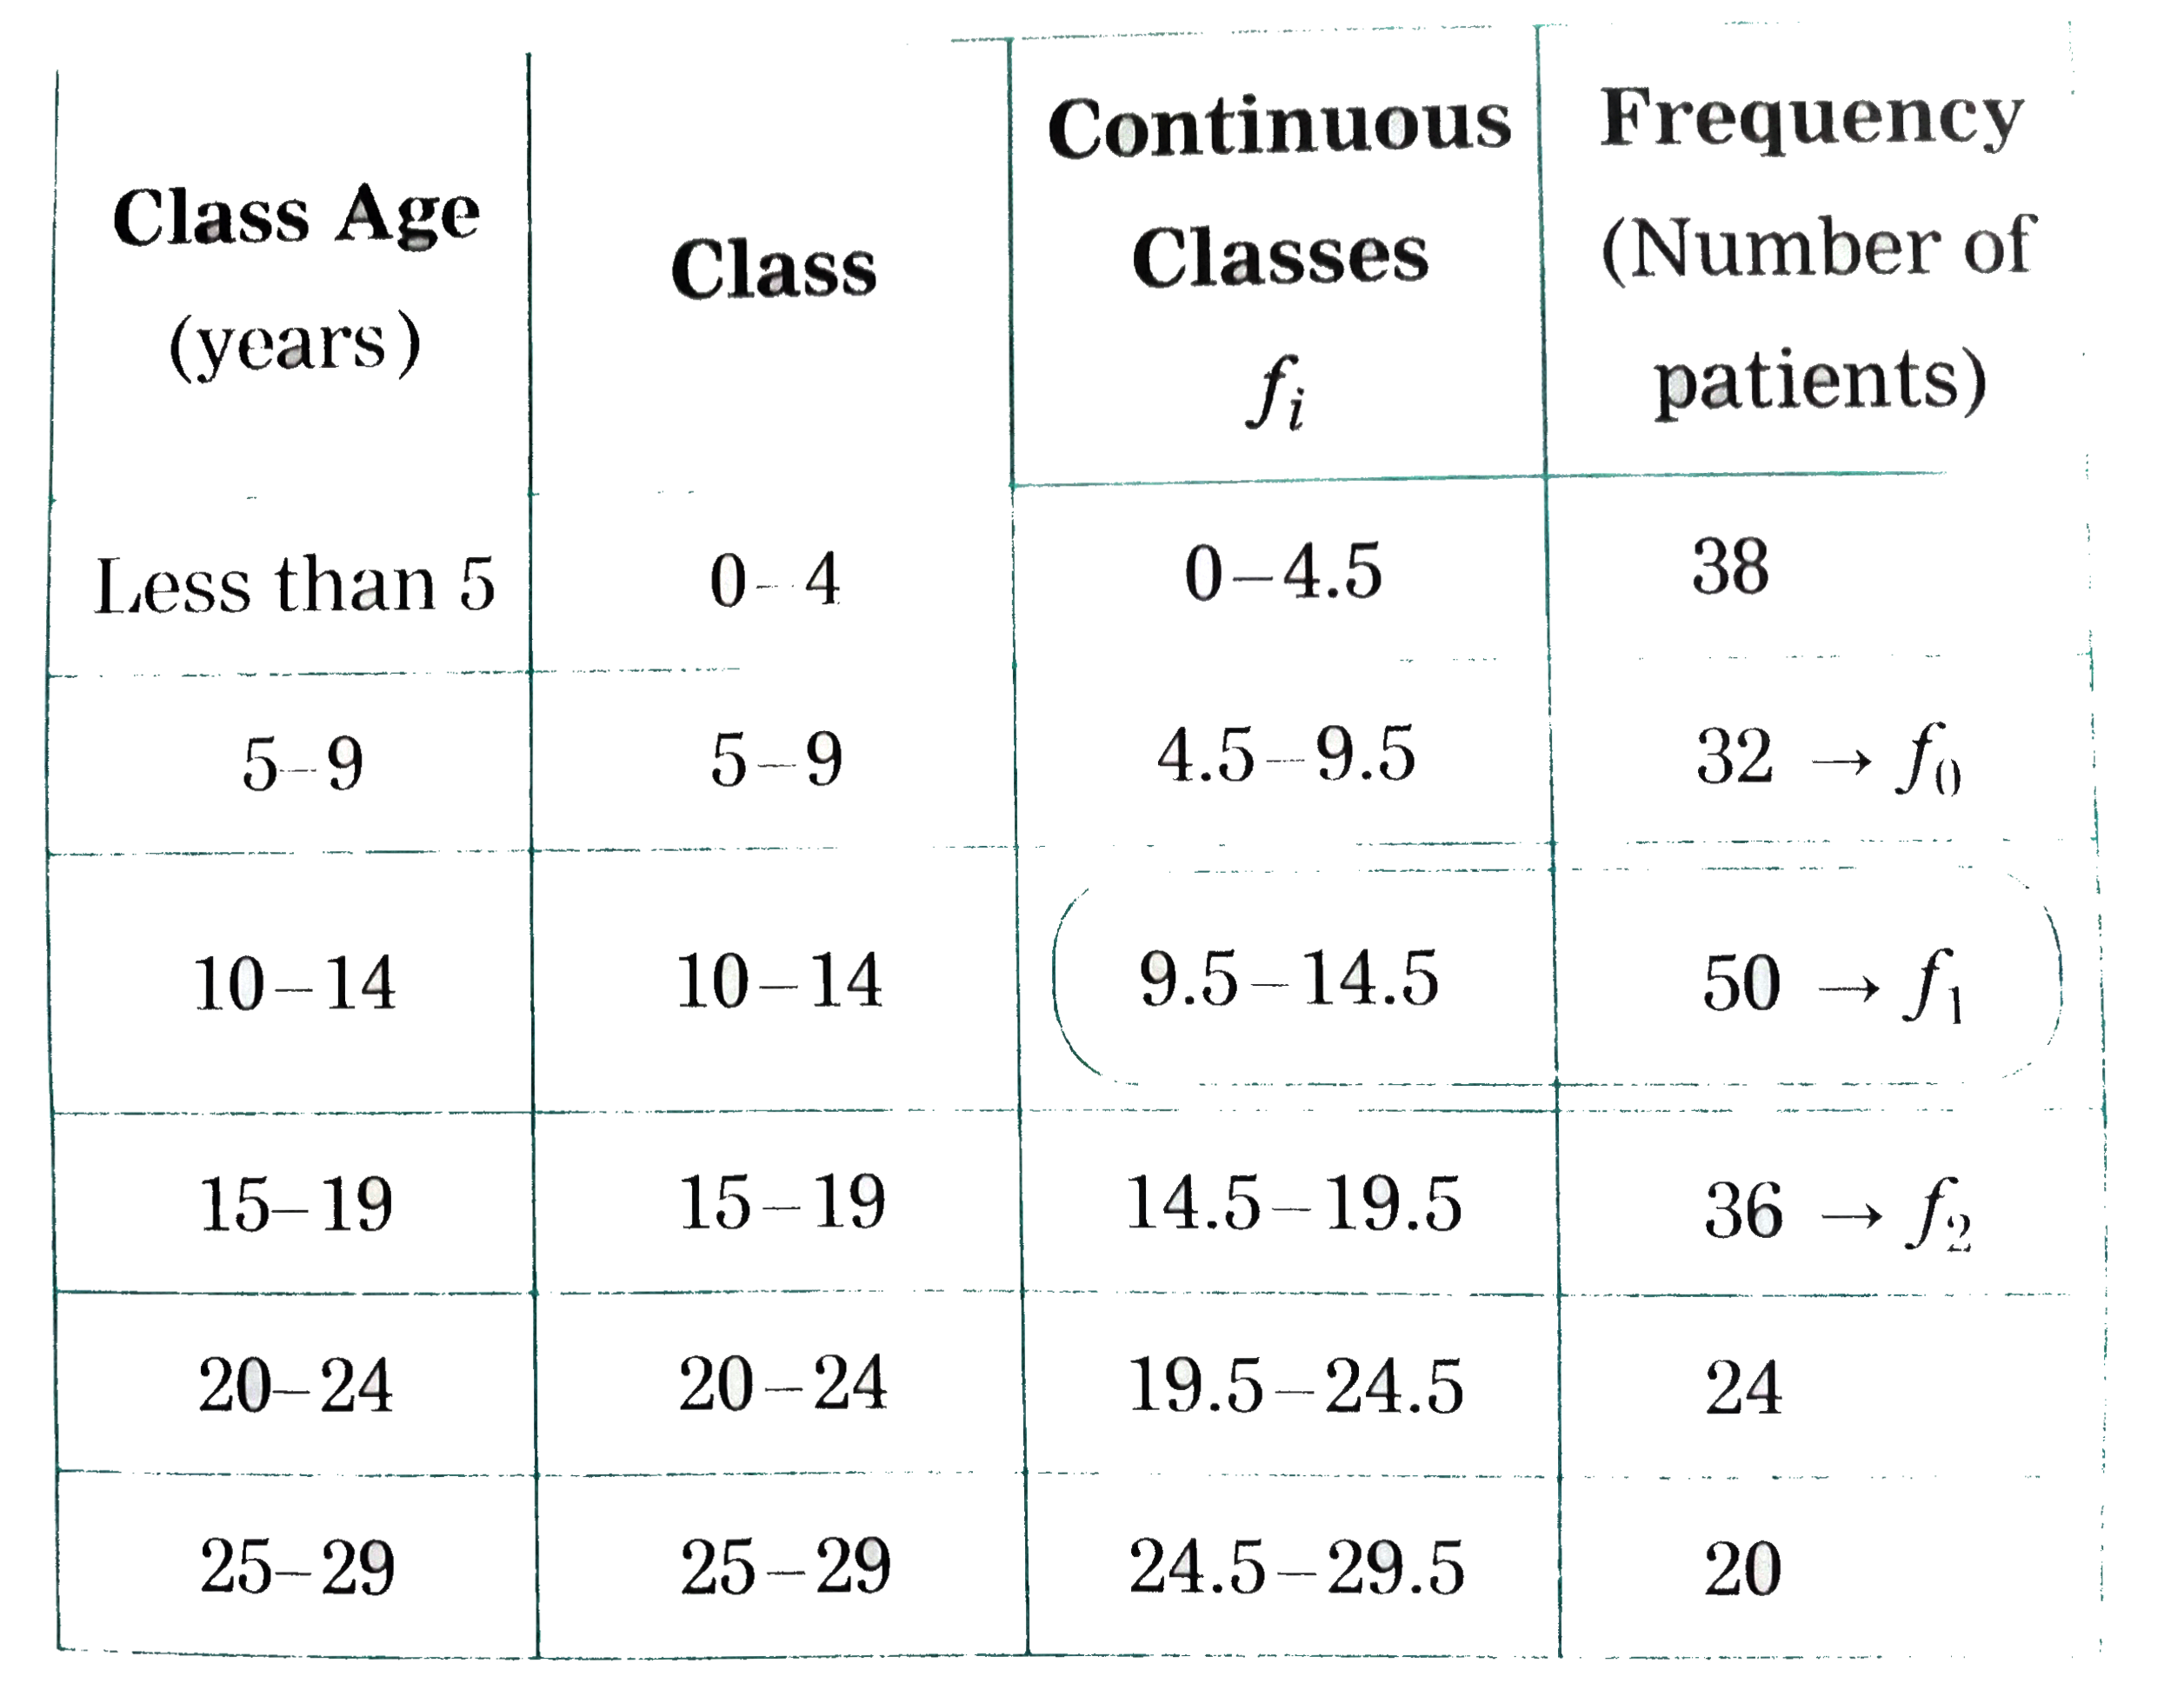
The following frequency distribution table gives the ages of 200 patients treated in a hospital in a week. Find the mode of ages of the patients.

The correct Answer is:The mode of the ages of the patients is years.
Less than 5 means 0 to 4. The age cannot be negative.
In the table, the classes are not continuous .
We get the following frequency districution table agter making the classes continuous .

From the table, the modal class is .
Mode
.
Topper's Solved these Questions
- STATISTICSBOOK - NAVNEET PUBLICATION - MAHARASHTRA BOARDCHAPTER - STATISTICSEXERCISE - PRACTICE SET 6.4
4 Videos
- STATISTICSBOOK - NAVNEET PUBLICATION - MAHARASHTRA BOARDCHAPTER - STATISTICSEXERCISE - PRACTICE SET 6.5
3 Videos
- STATISTICSBOOK - NAVNEET PUBLICATION - MAHARASHTRA BOARDCHAPTER - STATISTICSEXERCISE - PRACTICE SET 6.2
4 Videos
- SIMILARITYBOOK - NAVNEET PUBLICATION - MAHARASHTRA BOARDCHAPTER - SIMILARITYEXERCISE - SUBJECTIVE TYPE
20 Videos
- THEOREMS BOOK - NAVNEET PUBLICATION - MAHARASHTRA BOARDCHAPTER - THEOREMS EXERCISE - CIRCLE
15 Videos
Similar Questions
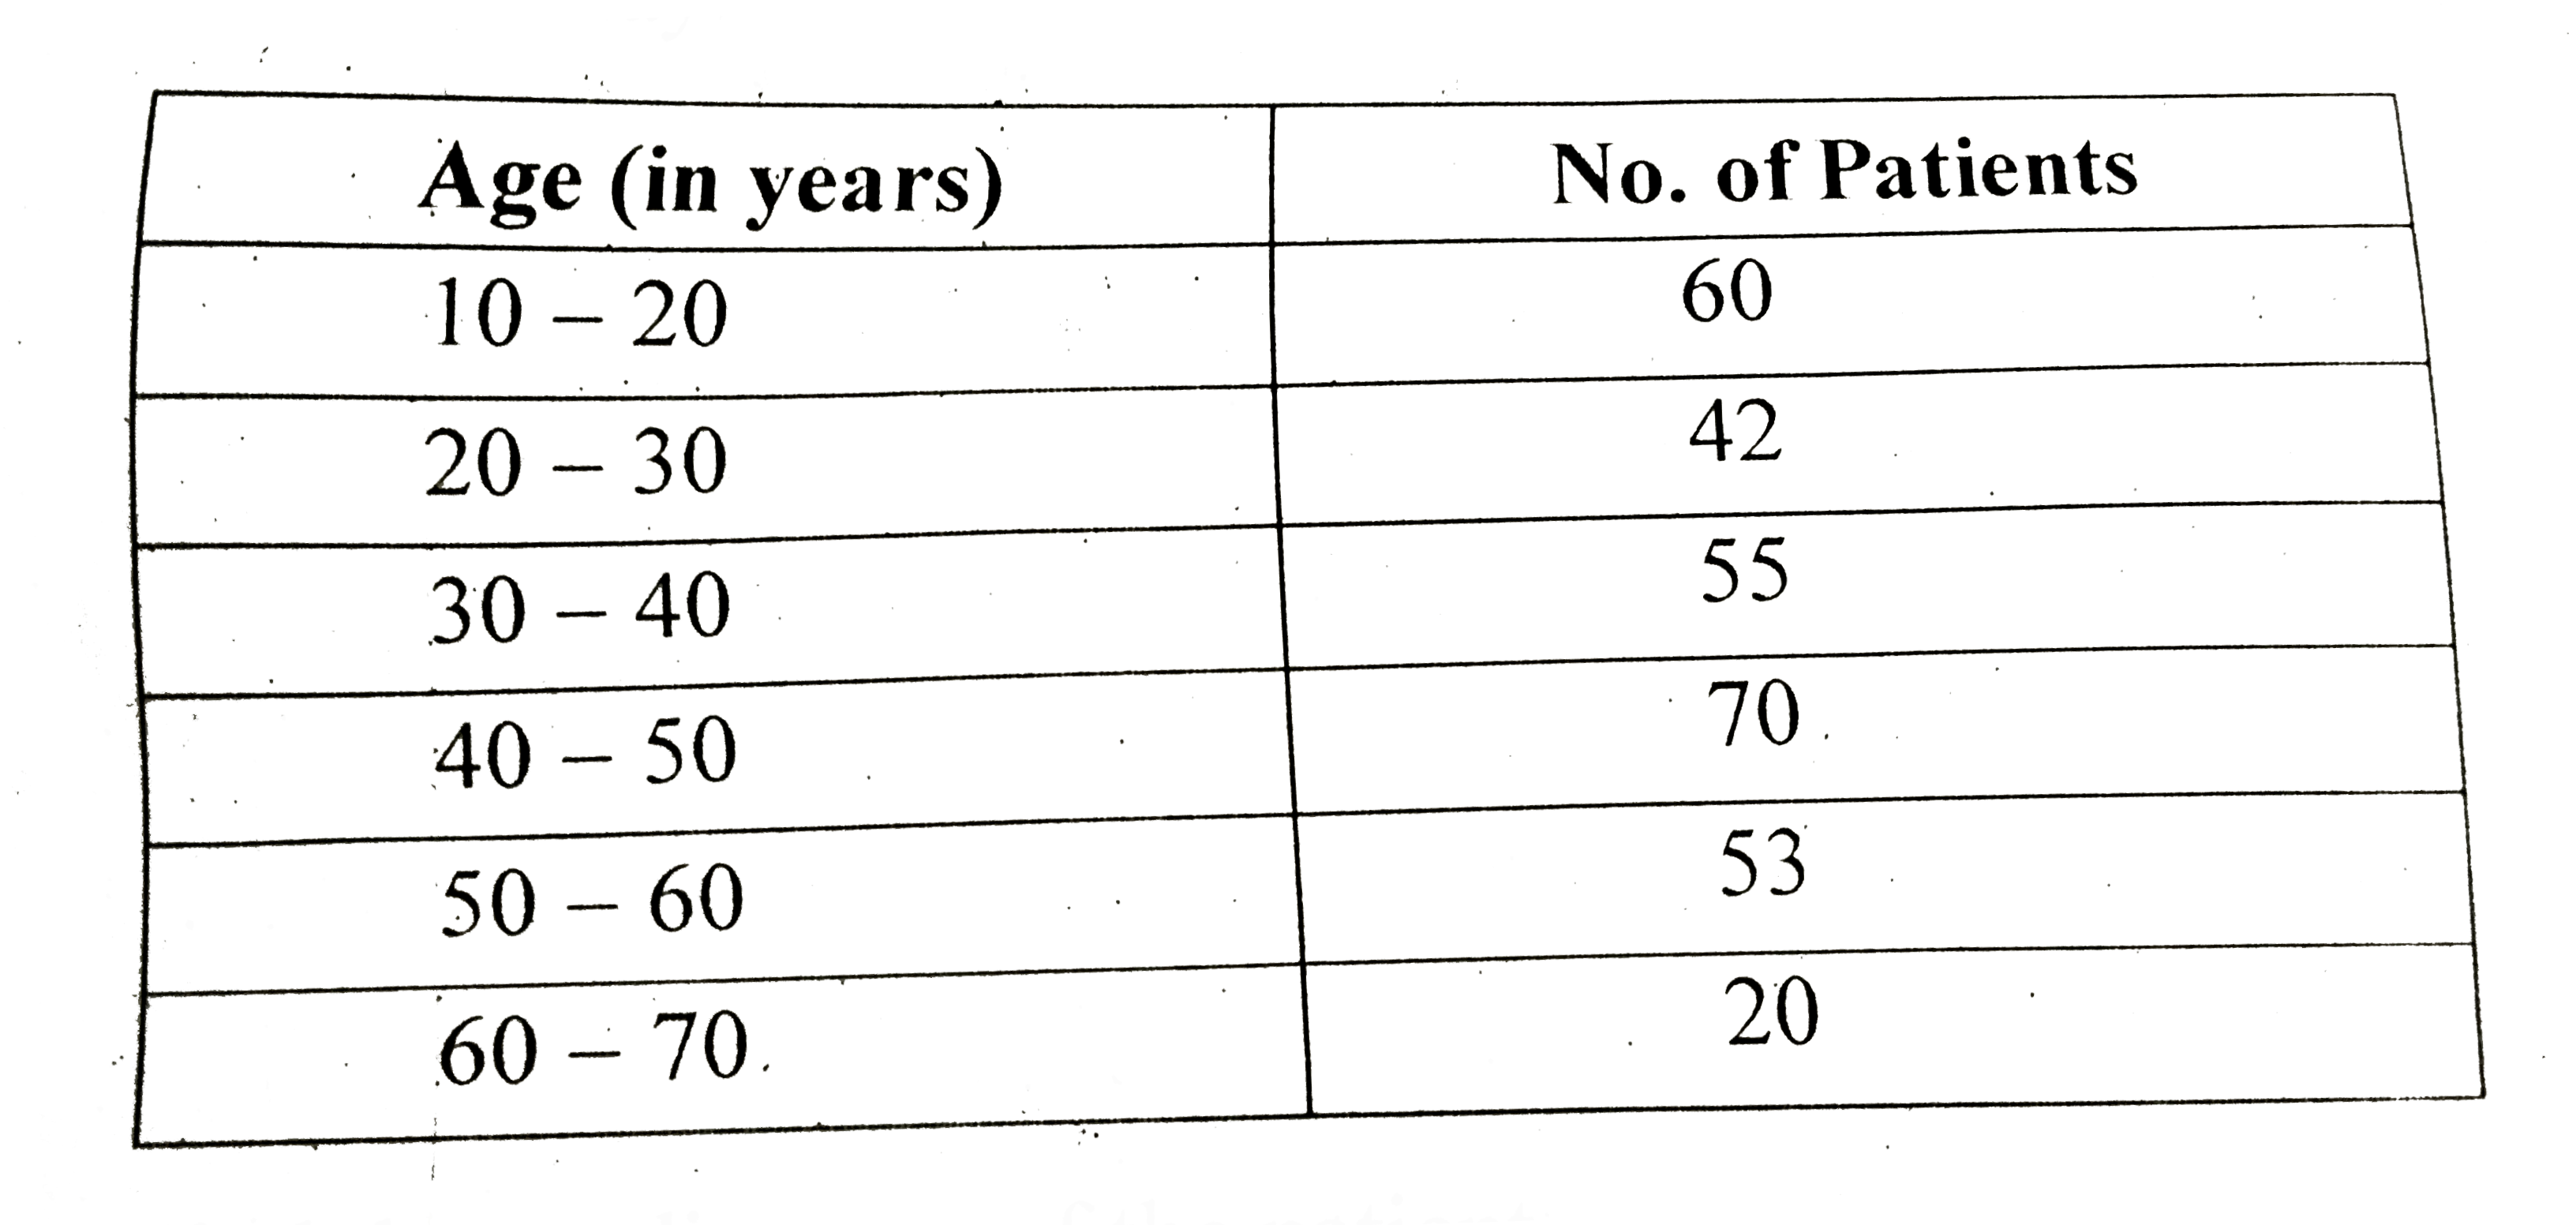
The following frequency distribution table gives the ages of 200 patients treated in a hospital in a weak. Find the mode of ages of the patients.

View SolutionThe following frequency distribution table given the ages of 200 patients treated in a hospital in a week.Find the mode of ages of the pateints.

View SolutionThe following frequency dsitribution table gives the ages of 80 patients treated in a hospital during a month. Find the mode of the ages of the patients.

View SolutionThe following table shows ages of 300 patients getting medical treatment in a hospital on a particular day:

Find the median age of the patient.
View SolutionThe following table shows the ages of the patients admitted in a hospital during a year:Find the mode and the mean of the data given above. Compare and interpret the two measures of central tendency.
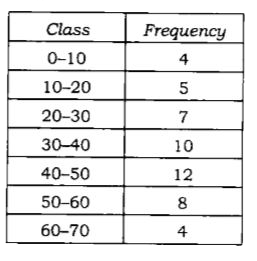
View SolutionConsider the following frequency distribution

What is the mode of the distribution?
View SolutionThe following frequency distribution table shows the classification of the number of vehicles and the volume of petrol filled in them. Find the mode of the volume.

View SolutionThe ages (in years) of 360 patients treated in a hospital on a particular day are given below:

Draw a histogram for the given data.
View SolutionThe mode of following frequency distribution is 36 . Find the missing frequency (f) .

View SolutionIn a frequency distribution mode is 7.88 , mean is 8.32 .find the median
View Solution
