The following frequency table shows the demand for a sweet and the number of customers. Find the mode of the demand of sweet.

The correct Answer is:The mode of the demand of sweet is 397.06 grams.
From the table , we note that the maximum number of customers is in the class 250−500.
Here, f1=60. The modal class is 250−500.
L=250,h=250,fi=60,f0=10,f2=25
Mode =L+[fi−fi2fi−f0−f2]×h
=250+(60−102×60−10−25)×250
=250+(50120−35)×250
=250+5085×250
=250+1250085=250+147.06 (Approx.)
∴ Mode =397.06
Topper's Solved these Questions
- STATISTICSBOOK - NAVNEET PUBLICATION - MAHARASHTRA BOARDCHAPTER - STATISTICSEXERCISE - PRACTICE SET 6.1
6 Videos
- STATISTICSBOOK - NAVNEET PUBLICATION - MAHARASHTRA BOARDCHAPTER - STATISTICSEXERCISE - PRACTICE SET 6.2
4 Videos
- STATISTICSBOOK - NAVNEET PUBLICATION - MAHARASHTRA BOARDCHAPTER - STATISTICSEXERCISE - EXAMPLES
3 Videos
- SIMILARITYBOOK - NAVNEET PUBLICATION - MAHARASHTRA BOARDCHAPTER - SIMILARITYEXERCISE - SUBJECTIVE TYPE
20 Videos
- THEOREMS BOOK - NAVNEET PUBLICATION - MAHARASHTRA BOARDCHAPTER - THEOREMS EXERCISE - CIRCLE
15 Videos
Similar Questions
The following frequency table shows the demand for a sweet and the number of customers. Find the mode of demand of sweet.

View SolutionThe following frequency distribution table shows the classification of the number of vehicles and the volume of petrol filled in them. Find the mode of the volume.

View Solution
Knowledge Check
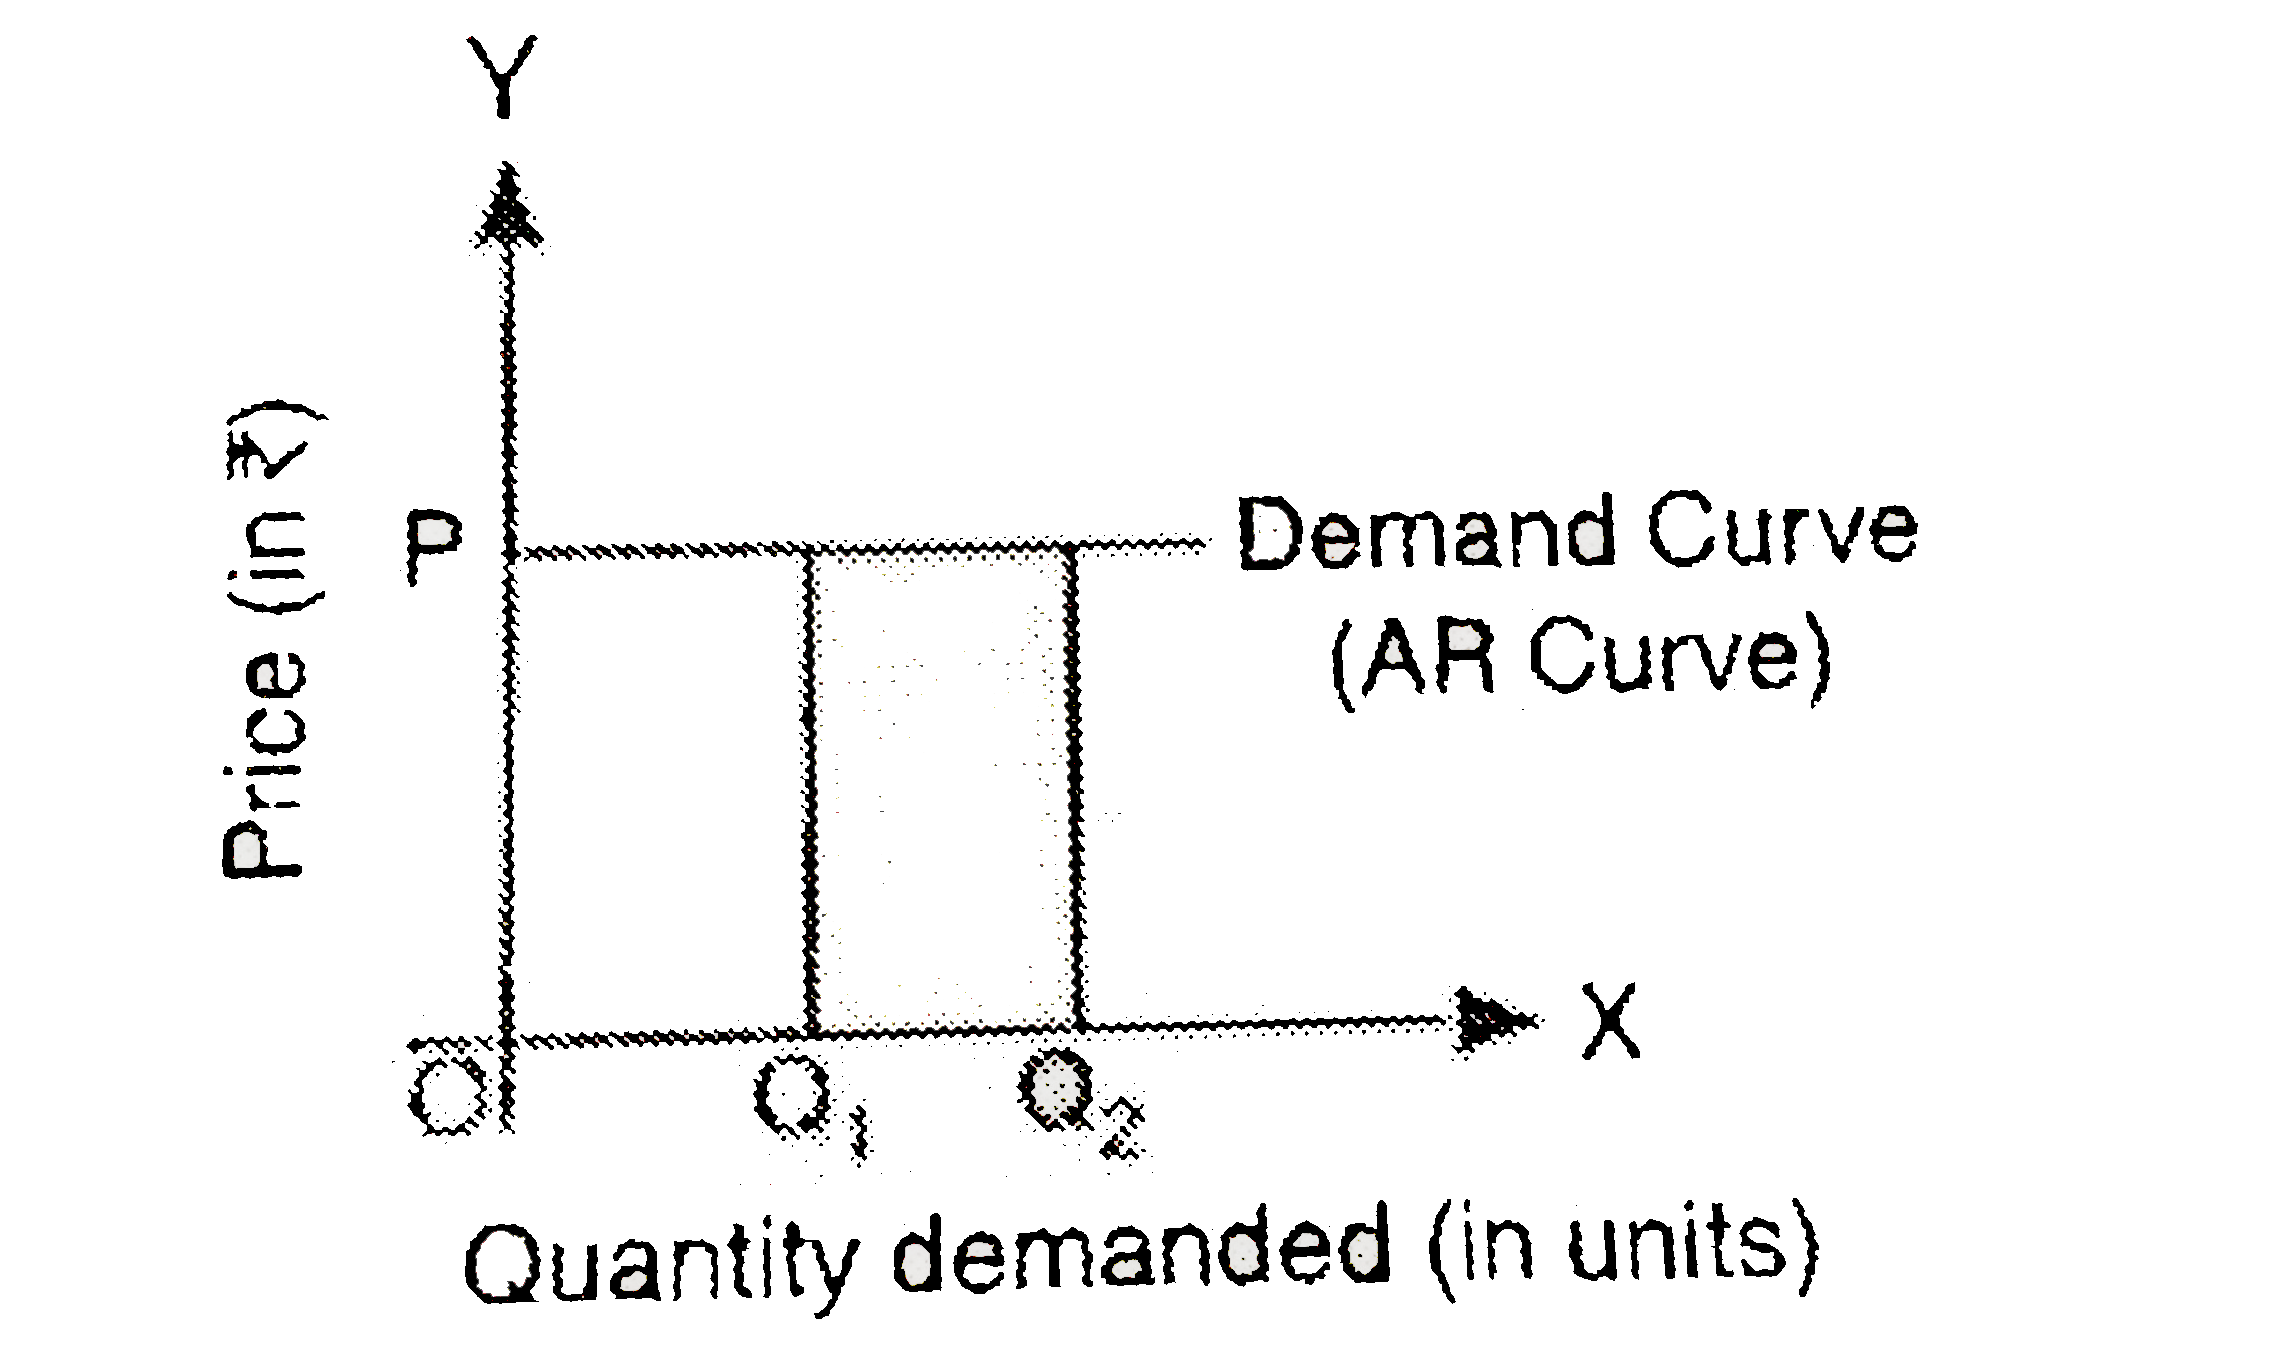
The following diagram represents the demand curve of:
 APerfect competitionBMonopolist CompetitionCMonopolyDOligopoly
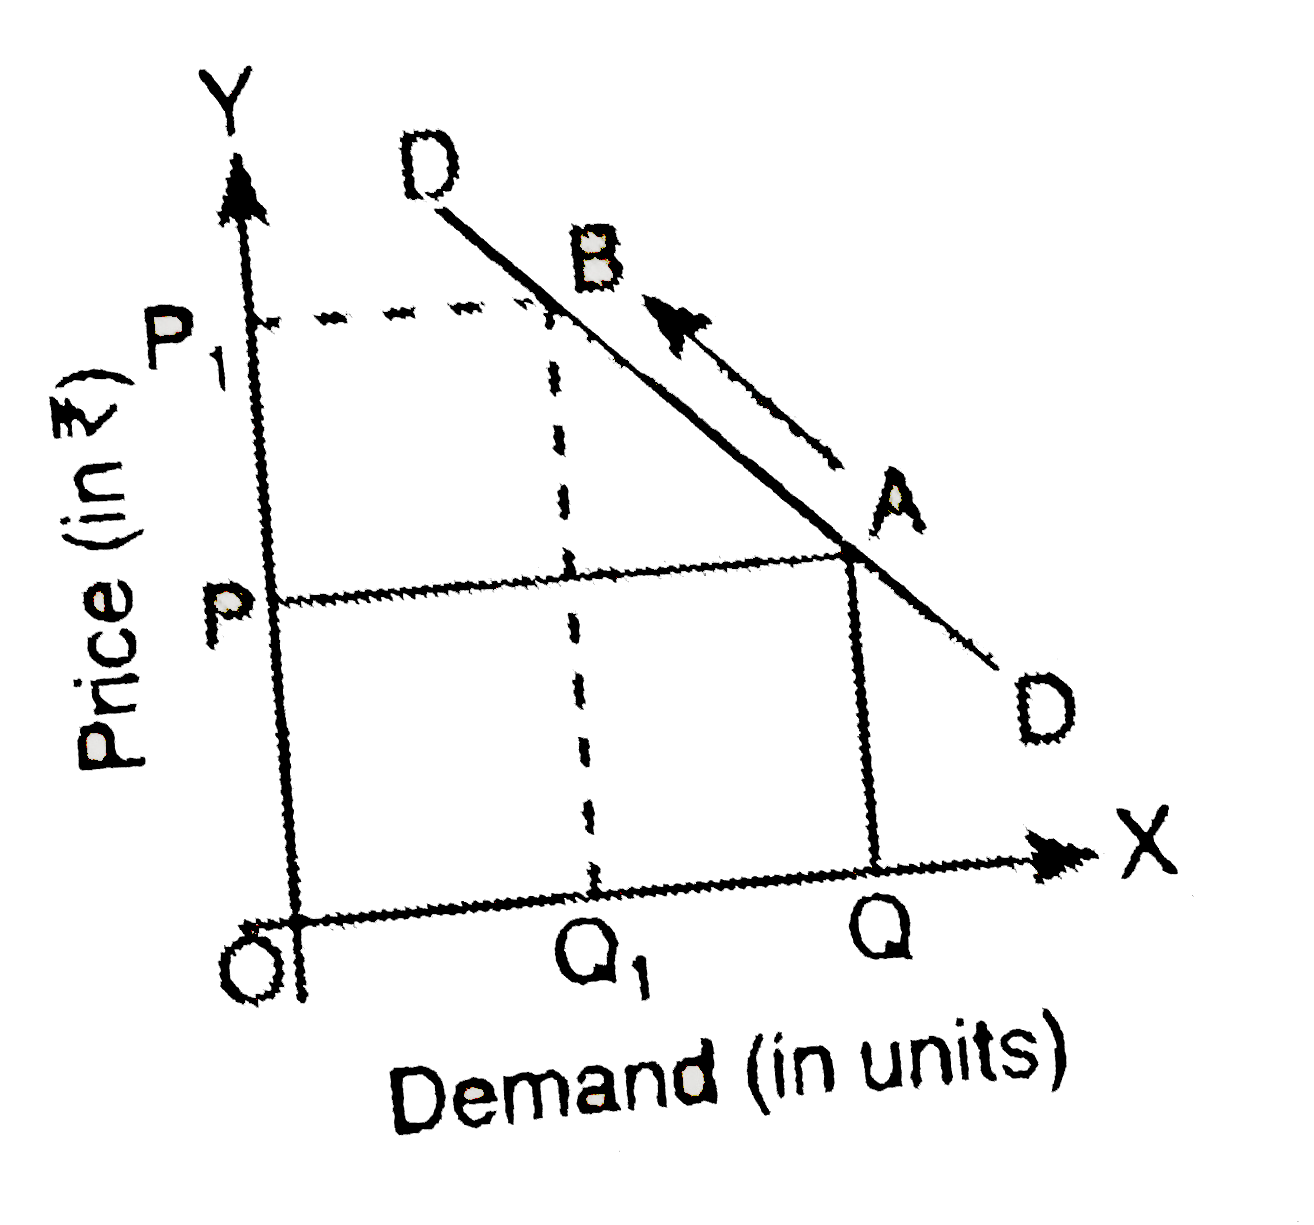
The following movement in the demand curve is because of :
 AIncrease in price of given commodityBDecrease in price of given commodityCIncrease in price of substitute goodDDecrease in price of complementary good
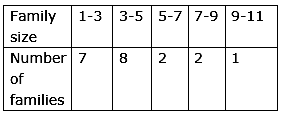
A survey conducted on 20 households in a locality by a group of students resulted in the following frequency table for the number of family members in a household:Find the mode of this data.
 A4B3.8C3.286DNone
The following table shows ages of people who went to a particular play of circus in a day.

Find the mode of the ages of the vistiors.
View SolutionThe following frequency distribution table gives the ages of 200 patients treated in a hospital in a weak. Find the mode of ages of the patients.

View SolutionThe following frequency distribution table gives the ages of 200 patients treated in a hospital in a week. Find the mode of ages of the patients.

View SolutionThe following frequency distribution table given the ages of 200 patients treated in a hospital in a week.Find the mode of ages of the pateints.

View SolutionThe following frequency dsitribution table gives the ages of 80 patients treated in a hospital during a month. Find the mode of the ages of the patients.

View Solution
