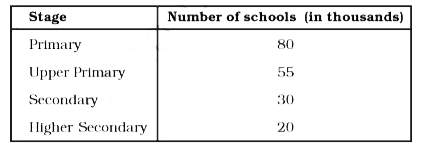
The following table gives the data of number of schools (stage-wise) of a country in the year 2002.

Draw a bar graph to represent the above data:
Step by step video & image solution for The following table gives the data of number of schools (stage-wise) of a country in the year 2002. Draw a bar graph to represent the above data: by Maths experts to help you in doubts & scoring excellent marks in Class 6 exams.
Updated on:21/07/2023Topper's Solved these Questions
Similar Questions
Draw a histogram to represent the following data.

View SolutionDraw the histogram to represent the following data.

View SolutionThe income of a family i different year are as follows. Draw a bar graph to represent the data
View SolutionThe following table gives the average temperatures, during the year 2006 and 2007. Draw a double bar graph for the given data.

View SolutionThe given table presents the number of illiterate males in the age group (10-34) in a town.

Draw a histogram to represent the above data.
View SolutionGiven below is the data of school going students (boys and girls):

Draw the bar graph to represent the above data.
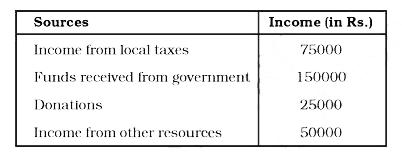
View SolutionThe following table represents income of a Gram Panchayat from different sources in a particular year:

Draw a bar graph to represent the above information
View SolutionDraw a frequency polygon to represent the following data.

View SolutionThe following data shows the number of students who attended the school on weekdays. Draw a bar graph to represent information by using appropriate scale.

View SolutionThe following table shows the number of students in different classes of a high school. Draw a histogram to represent the given data.
ClassesVIVIIVIIIIXXNumber of students3742355048
View Solution
