The following table shows the number of Maruti cars sold by the five dealers in a particular month: Dealer, Saya, Bagga Links, D.D. Motors, Bhasin Motor, Competent Motors Cars sold, 60, 40, 20, 15, 10 Represent the above information by a pictograph.
To represent the number of Maruti cars sold by the five dealers in a pictograph, we will follow these steps:
Step 1: Understand the Data
We have the following data for the number of cars sold by each dealer:
- Saya: 60 cars
- Bagga Links: 40 cars
- D.D. Motors: 20 cars
- Bhasin Motor: 15 cars
- Competent Motors: 10 cars
Step 2: Decide the Symbol for the Pictograph
We will use a car symbol (🚗) to represent the cars sold. To make it easier, we can represent 10 cars with one car symbol.
Step 3: Calculate the Number of Symbols for Each Dealer
- Saya: 60 cars = 60/10 = 6 symbols (🚗🚗🚗🚗🚗🚗)
- Bagga Links: 40 cars = 40/10 = 4 symbols (🚗🚗🚗🚗)
- D.D. Motors: 20 cars = 20/10 = 2 symbols (🚗🚗)
- Bhasin Motor: 15 cars = 15/10 = 1.5 symbols (🚗 and half a symbol for 5 cars, which we can represent as 🚗½)
- Competent Motors: 10 cars = 10/10 = 1 symbol (🚗)
Step 4: Draw the Pictograph
Now we can draw the pictograph as follows:
Dealer Cars Sold
Saya 🚗🚗🚗🚗🚗🚗
Bagga Links 🚗🚗🚗🚗
D.D. Motors 🚗🚗
Bhasin Motor 🚗🚗½
Competent Motors🚗
Step 5: Review the Pictograph
Check to ensure that each dealer's representation accurately reflects the number of cars sold based on our calculations.
Final Pictograph Representation
Dea≤rCarsSoldSaya𐀀�𐀀�𐀀�𐀀�𐀀�𐀀�BaggaL∈ks𐀀�𐀀�𐀀�𐀀�D.D.Mo→rs𐀀�𐀀�BhasinMo→r𐀀�𐀀�½CompetentMo→rs𐀀�
We have the following data for the number of cars sold by each dealer:
- Saya: 60 cars
- Bagga Links: 40 cars
- D.D. Motors: 20 cars
- Bhasin Motor: 15 cars
- Competent Motors: 10 cars
We will use a car symbol (🚗) to represent the cars sold. To make it easier, we can represent 10 cars with one car symbol.
- Saya: 60 cars = 60/10 = 6 symbols (🚗🚗🚗🚗🚗🚗)
- Bagga Links: 40 cars = 40/10 = 4 symbols (🚗🚗🚗🚗)
- D.D. Motors: 20 cars = 20/10 = 2 symbols (🚗🚗)
- Bhasin Motor: 15 cars = 15/10 = 1.5 symbols (🚗 and half a symbol for 5 cars, which we can represent as 🚗½)
- Competent Motors: 10 cars = 10/10 = 1 symbol (🚗)
Now we can draw the pictograph as follows:
Dealer Cars Sold
Saya 🚗🚗🚗🚗🚗🚗
Bagga Links 🚗🚗🚗🚗
D.D. Motors 🚗🚗
Bhasin Motor 🚗🚗½
Competent Motors🚗
Check to ensure that each dealer's representation accurately reflects the number of cars sold based on our calculations.
Dea≤rCarsSoldSaya𐀀�𐀀�𐀀�𐀀�𐀀�𐀀�BaggaL∈ks𐀀�𐀀�𐀀�𐀀�D.D.Mo→rs𐀀�𐀀�BhasinMo→r𐀀�𐀀�½CompetentMo→rs𐀀�
Topper's Solved these Questions
Similar Questions
The following data shows the number of students opting different subject in a college: Subjects, English, Maths, Physics, Chemistry, Eco., Commerce No. of Students, 45, 60, 20, 30, 10, 15 Construct a pie-diagram to represent the above data.
View SolutionThe bar graph shows the number of cars of different brands sold by a dealer in a month. Study the diagram and answer the following question.
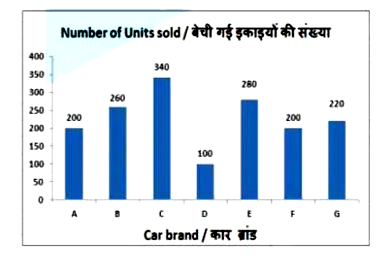
Units sold of which car brand were the second highest?View Solution
Knowledge Check
- Question 1 - Select One
Directions: The following table shows the number of bananas sold by 5 fruit sellers and the relation of apples with bananas in 3rd column. Read the table carefully and answer the following question.

Had Apples sold by A is only 10% more than bananas sold by A, then find the ratio of the total number of bananas sold by B, C and E to the total number of apples sold by A, D and E.A21:19B1:1C13:15D2:3 - Question 2 - Select One
The given table represents the number of computers sold by four dealers A, B, C and D during the first six months of 2016. Study the table carefully and answer the question that follows.
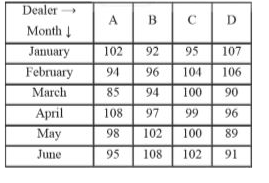
The total number of computers sold by dealer B in April, May and June is what percentage of the total number of computers sold by all the dealers in February and April?A5078B4857C4367D3838
The bar graph shows the number of cars of different brands sold by a dealer in a month. Study the diagram and answer the following question.
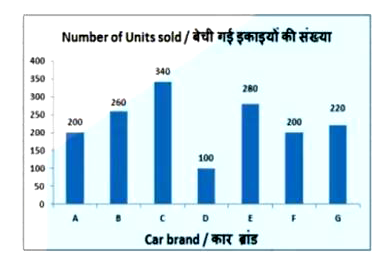
What is the ratio of units sold of brand G to that of brand E?View SolutionThe following table shows the number of toys sold by a mart during a week. Draw a line graph to represent the given data.
WeekMonTueWedThursFriSatSunNumber of Toys21101724101620View SolutionThe bar graph shows the number of cars of different brands sold by a dealer in a month, Study the diagram and answer the following question.
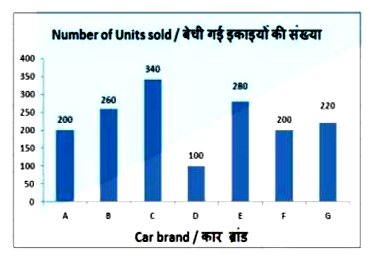
If the average price of a car sold by the dealer is Rs 5 lakhs then what is the sales (in Rs lakhs) of all the cars sold by the dealer in the month?View SolutionThe bar graph shows the number of cars of different brands sold by a dealer in a month. Study the diagram and answer the following questions.
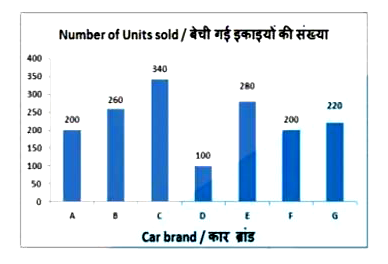
Units sold of brand D was lesser than that of brand F by _______.View SolutionThe bar graph shows the number of motorcycles of different brands sold by dealer in a month . Study the diagram and answer the following questions.
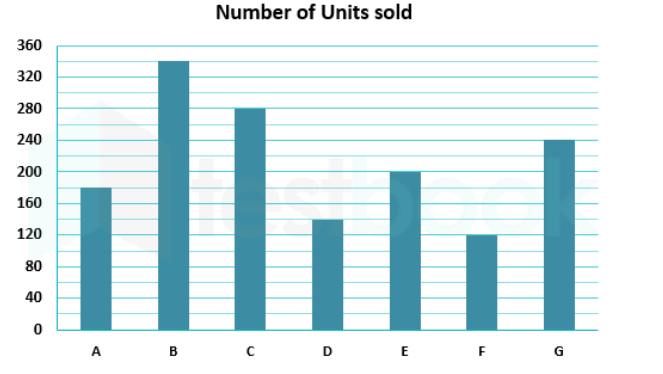
Units sold of brand D was lesser than that of brand E by _______.View SolutionThe given table shows the number (in thousands) of cars of five different models A, B, C, D and E produced during years 2012-2017. Study the table and answer the questions that follow.
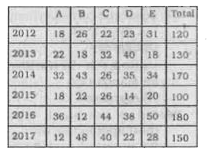
The percentage increase in the total cars in 2016 over 2012, is:View Solution

