The following table shows the number of patients discharged from a hospital with HIV diagnosis in different years: Years:, 2002, 2003, 2004, 2005, 2006 No. of Patients:, 150, 170, 195, 225, 230 Represent this information by a graph.
Step by step video & image solution for The following table shows the number of patients discharged from a hospital with HIV diagnosis in different years: Years:, 2002, 2003, 2004, 2005, 2006 No. of Patients:, 150, 170, 195, 225, 230 Represent this information by a graph. by Maths experts to help you in doubts & scoring excellent marks in Class 8 exams.
Updated on:21/07/2023Topper's Solved these Questions
Similar Questions
The following table shows the amount of rice grown by a farmer in different years: Years:, 2000, 2001, 2002, 2003, 2004, 2005, 2006 Rice grown (in quintals):, 200, 180, 240, 260, 250, 200, 270 Plot a graph to illustrate this information.
View SolutionThe following table shows the number of patients of differents age groups admitted to a hospital for treatement on a day. Find the median age of the patients.

View Solution
Knowledge Check
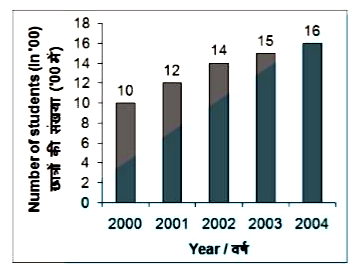
The bar chart given below shows the number of students (in '00) in a schoool from year 2000 to year 2004.

What is the total number of students in year 2002 and 2003?AA)2900BB)2700CC)3100DD)2800
The following table shows the ages of the patients admitted in a hospital :
Age (in years)5−1515−2525−3535−4545−5555−65No. of case 6 11 21 23 14 5
Find the mode and the mean of the data given above. Compare and interpret the two measures of central tendency.
View SolutionThe following table shows the sales of a commodity during the years 2000 to 2006. Years:, 2000, 2001, 2002, 2003, 2004, 2005, 2006 Sales (in lakhs of Rs.), 1.5, 1.8, 2.4, 3.2, 5.4, 7.8, 8.6 Draw a graph of this information.
View SolutionThe following table shows ages of 200 patients (in years) and the number of patients getting medical tretment on a particular day in a hospital in a day.

Find the median age of a patient.
View SolutionUse the tables below to draw linear graphs. (a) The number of days a hill side city received snow in different years. Years 2003,2004,2005and2006 and Days 8,10,5,and12 (b) Population (in thousands) of men and women in a village in different years.
View SolutionSome people of a society decorated their area with flags and tricolour ribbons on Republic Day .The following data shows the number of person in different age groups who participated in the decoration :
Age in years 5−1515−2525−3535−4545−5555−65Number of patients 6 11 21 23 14 5
Find the mode of the above data.
What values do these persons possess ?
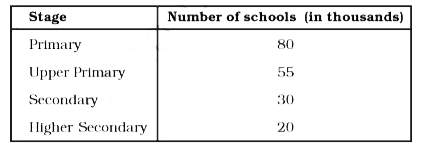
View SolutionThe following table gives the data of number of schools (stage-wise) of a country in the year 2002.

Draw a bar graph to represent the above data:
View SolutionThe following table shows the ages of the patients admitted in a hospital during a year:Find the mode and the mean of the data given above. Compare and interpret the two measures of central tendency.
View Solution
