The gas tank in a car holds a total of 16 gallons of gas. The car travels 75 miles on 4 gallons of gas. If the gas tank is full at the beginning of a trip, which graph represents the rate of change in the amount of gas in the tank?
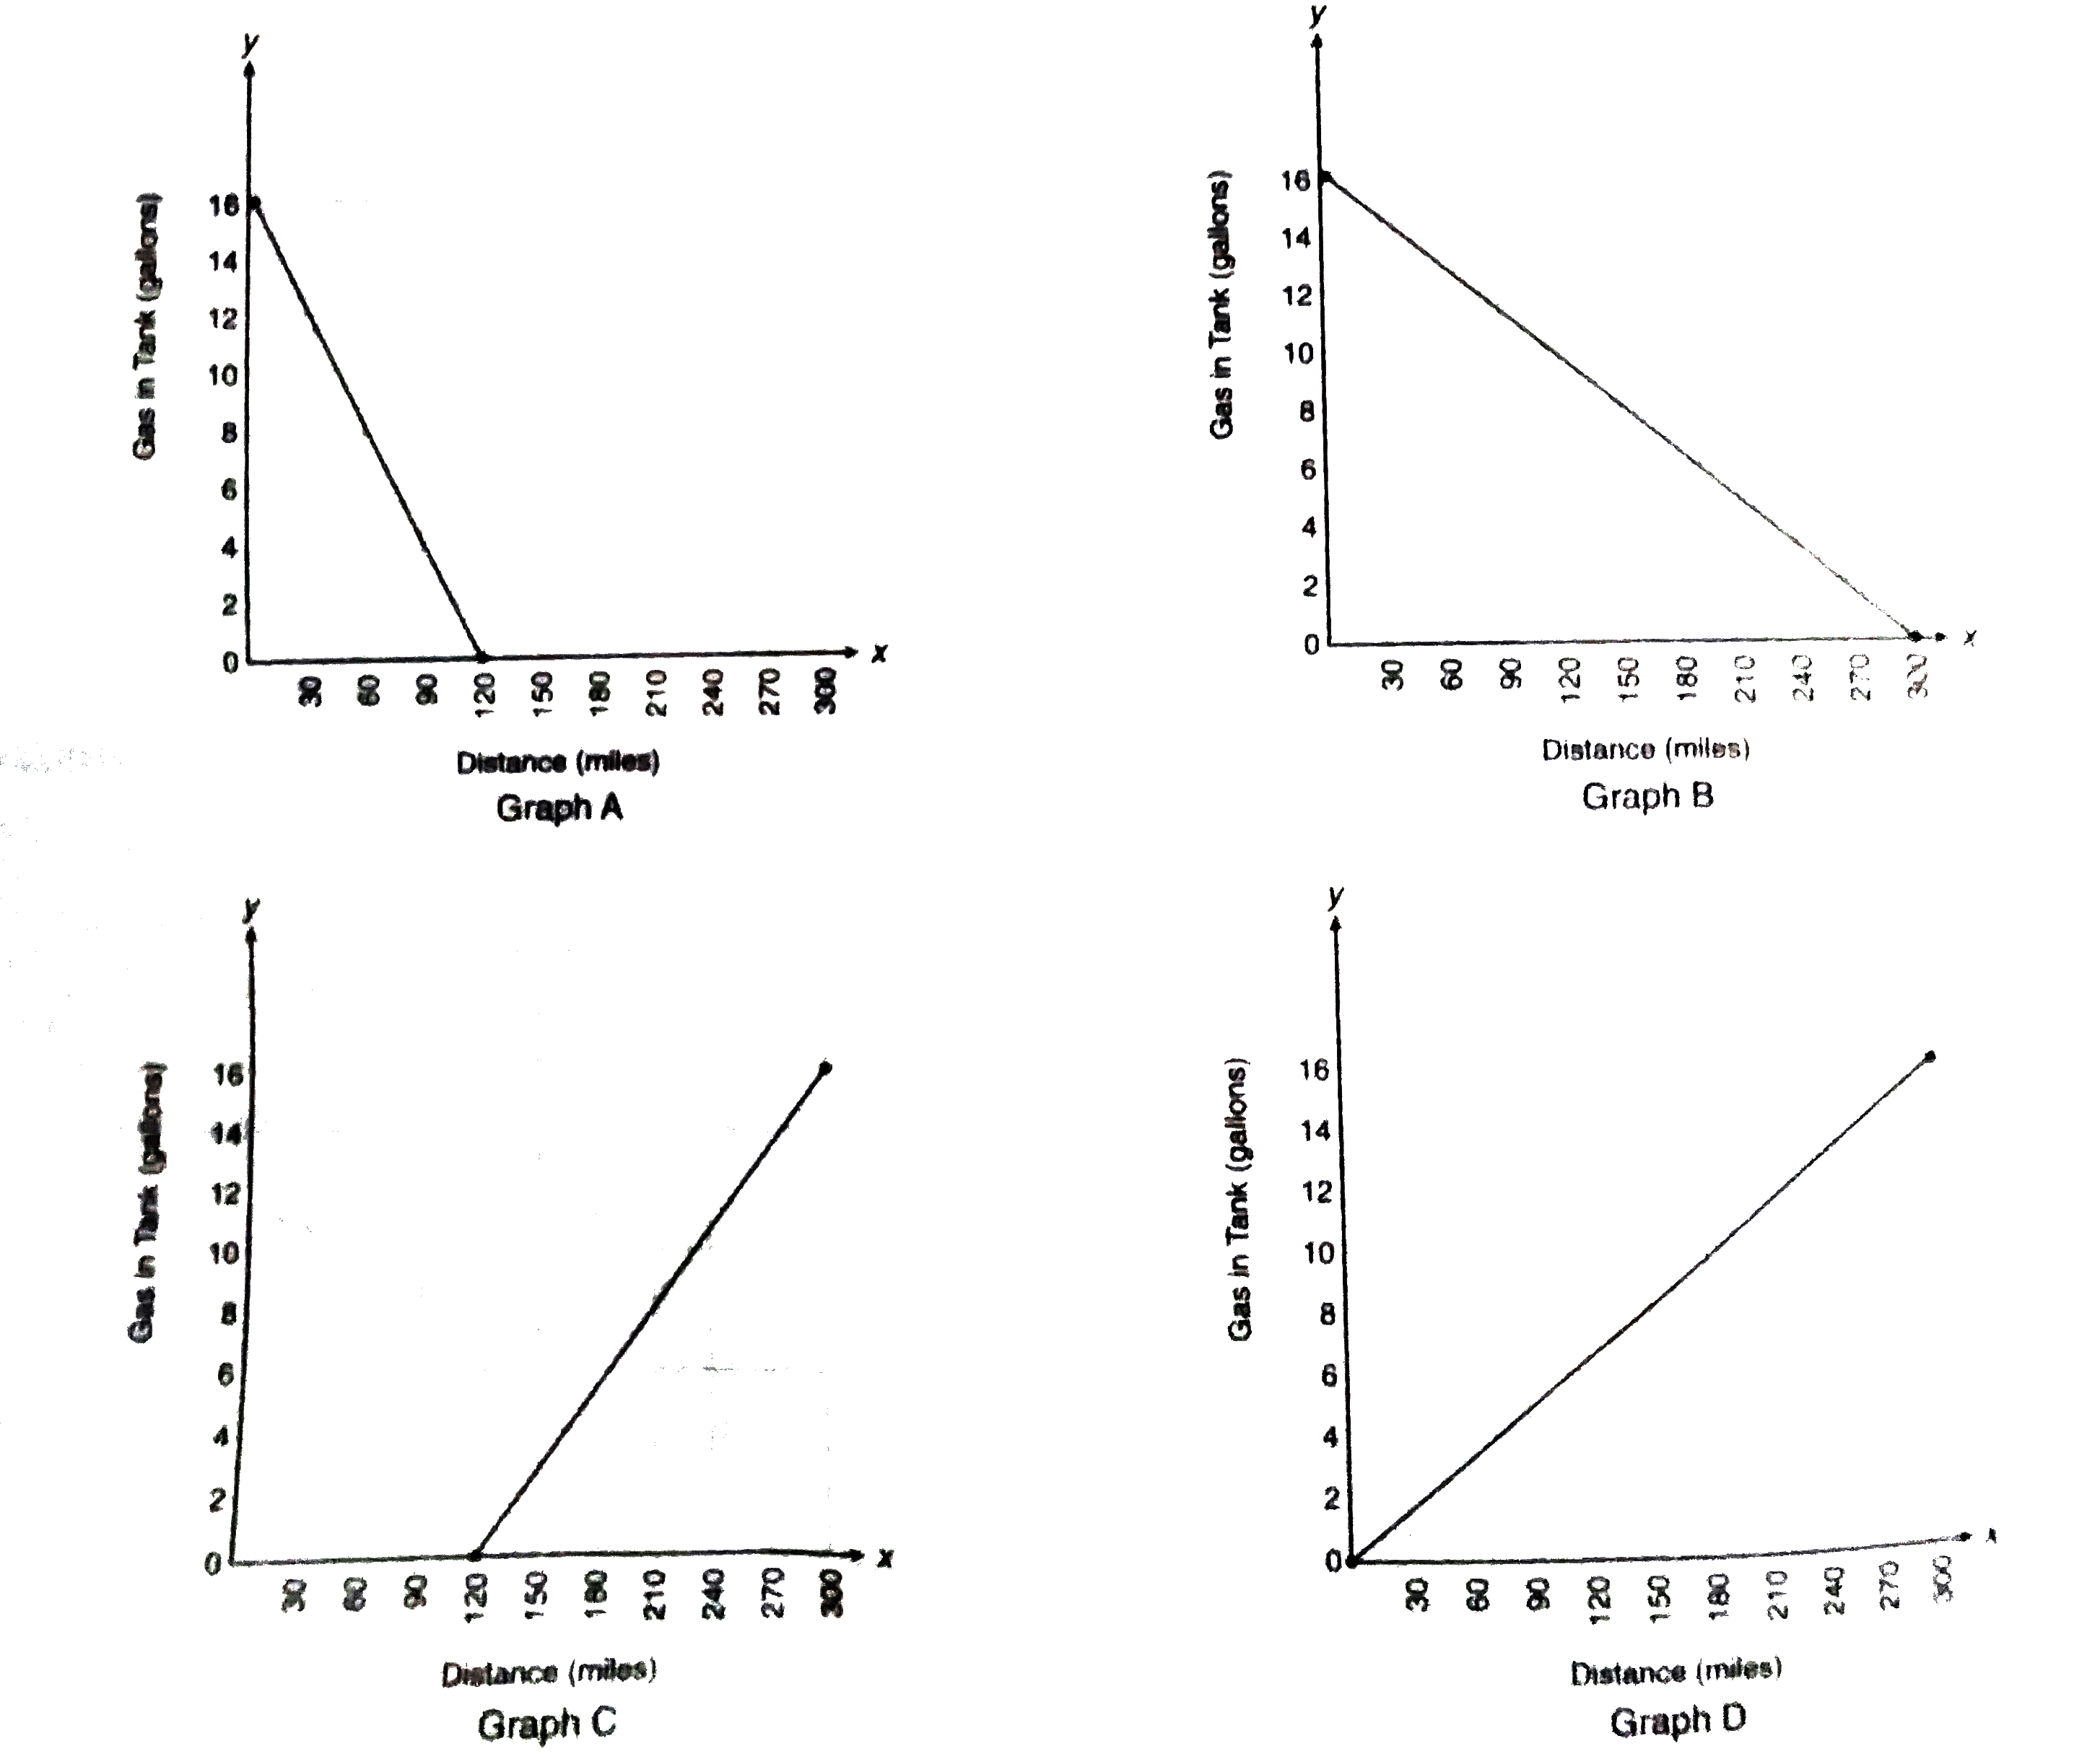
Graph A
Graph B
Graph C
Graph D
The correct Answer is:B
Step by step video, text & image solution for The gas tank in a car holds a total of 16 gallons of gas. The car travels 75 miles on 4 gallons of gas. If the gas tank is full at the beginning of a trip, which graph represents the rate of change in the amount of gas in the tank? by Maths experts to help you in doubts & scoring excellent marks in Class 12 exams.
Updated on:21/07/2023Topper's Solved these Questions
- PROBLEM SOLVING AND DATA ANALYSISBOOK - ENGLISH SATCHAPTER - PROBLEM SOLVING AND DATA ANALYSISEXERCISE - Grib-In
40 Videos
- PROBLEM SOLVING AND DATA ANALYSISBOOK - ENGLISH SATCHAPTER - PROBLEM SOLVING AND DATA ANALYSISEXERCISE - Grib-In
40 Videos
- PROBLEM SOLVING AND DATA ANALYSISBOOK - ENGLISH SATCHAPTER - PROBLEM SOLVING AND DATA ANALYSISEXERCISE - EXERICSE
80 Videos
- PROBLEMS IN CONTEXT BOOK - ENGLISH SATCHAPTER - PROBLEMS IN CONTEXT EXERCISE - PRACTICE TEST
10 Videos
Similar Questions
Knowledge Check
Which of the following graphs represent the behaviour of an ideal gas ?
A1.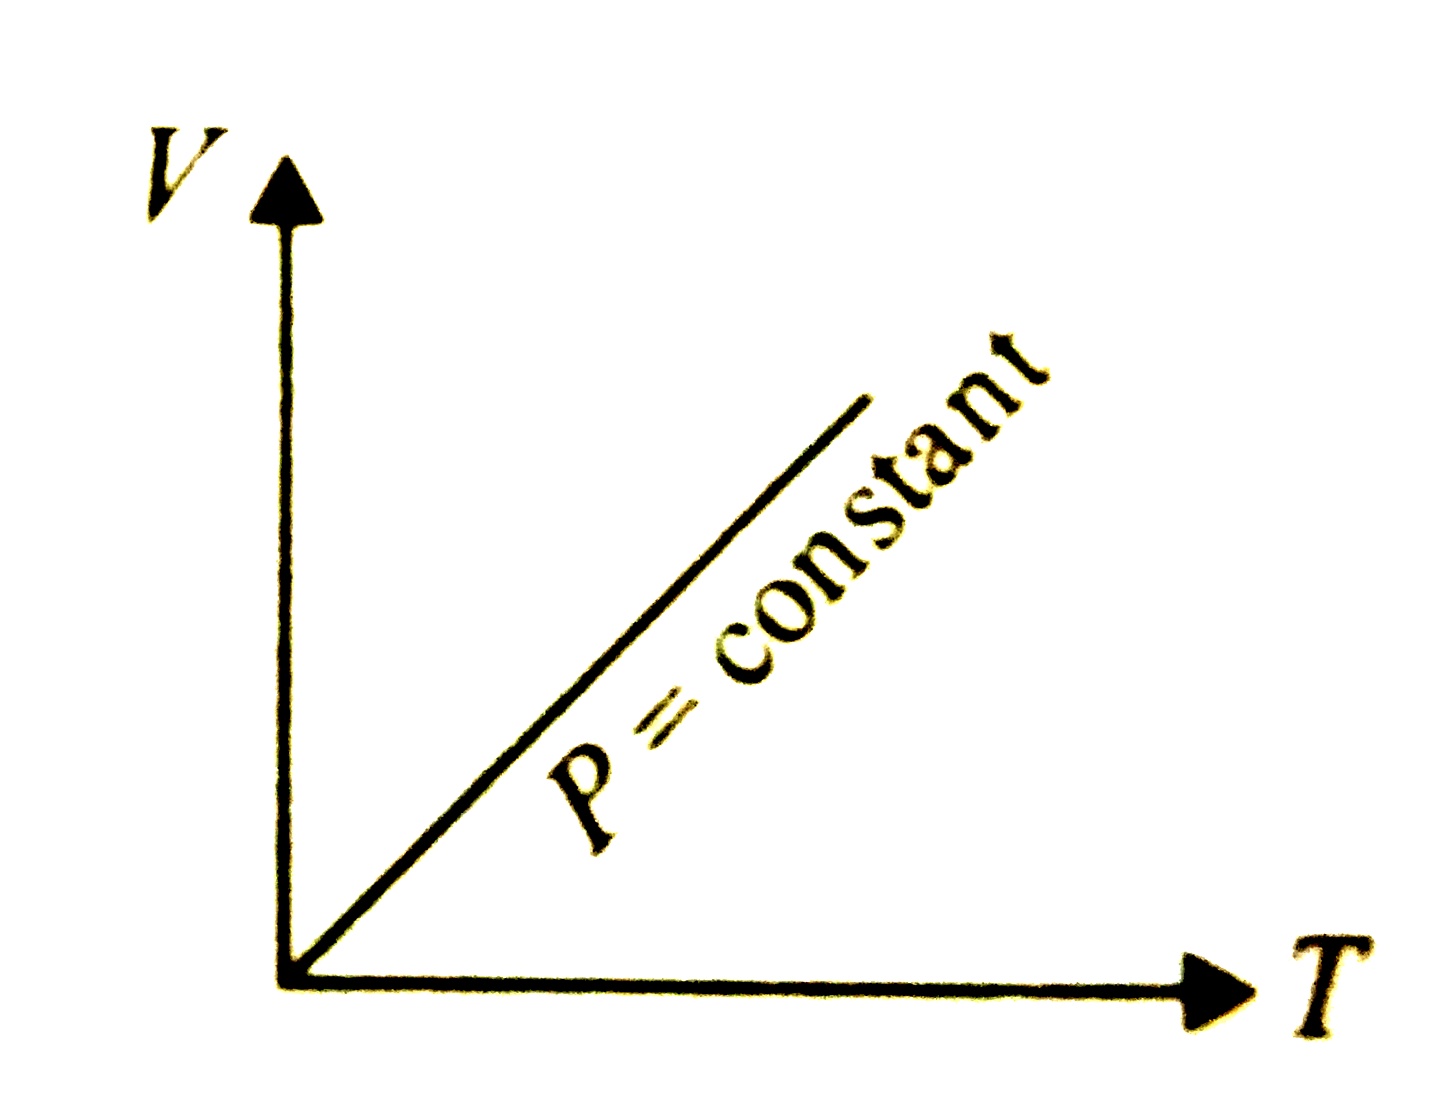 B2.
B2.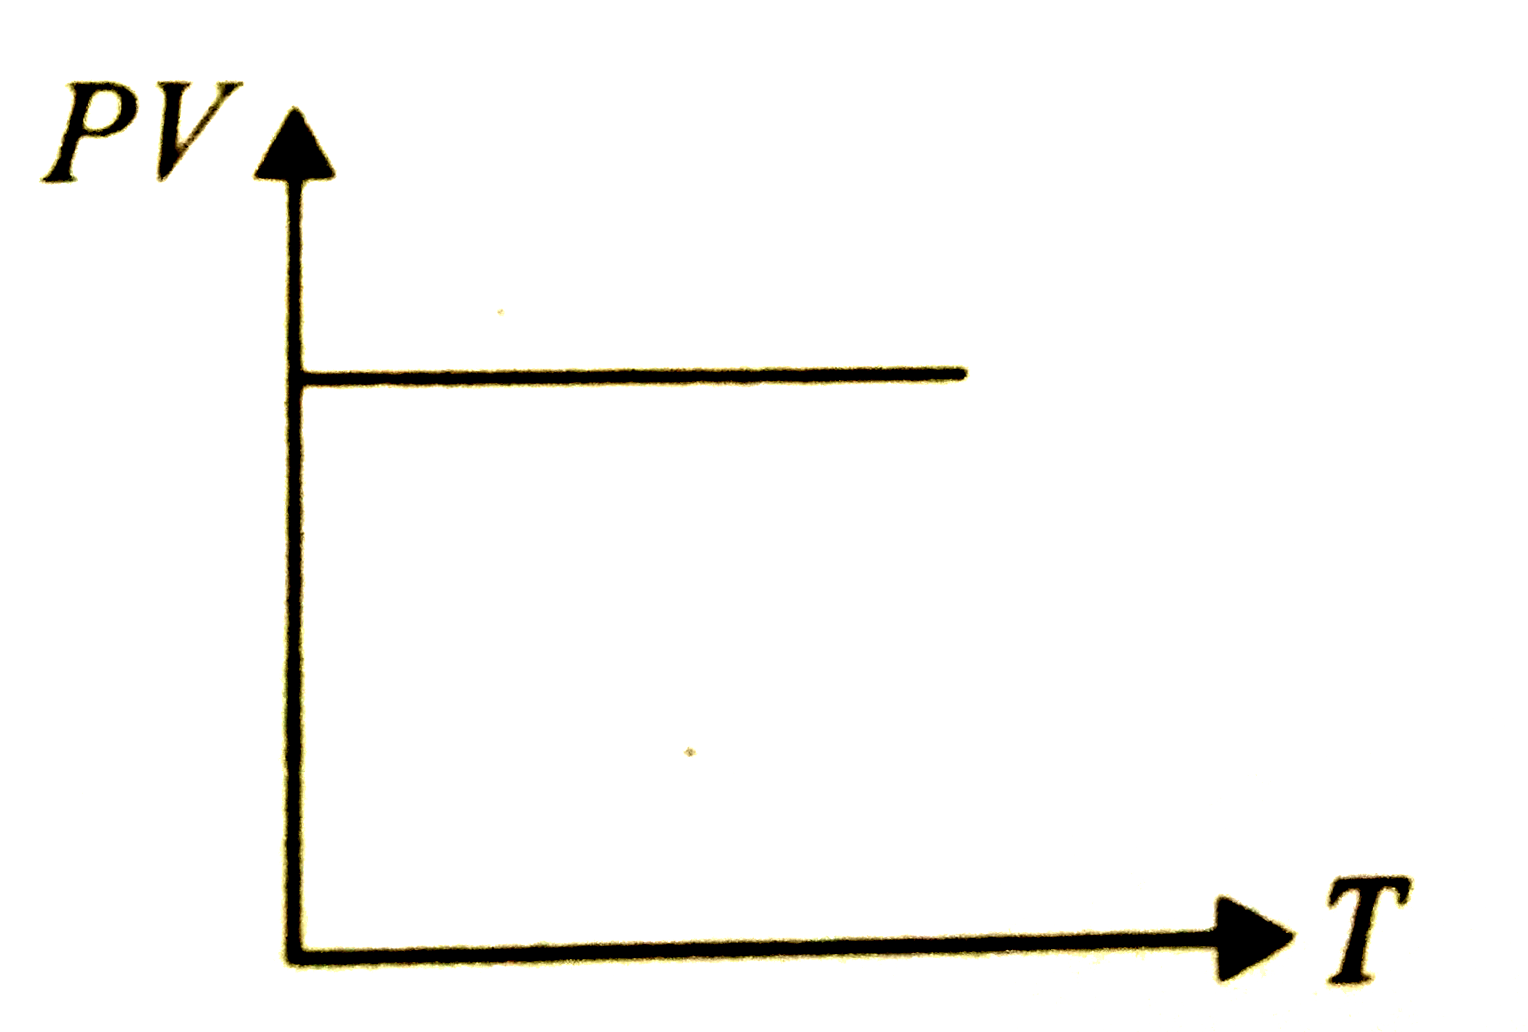 C3.
C3.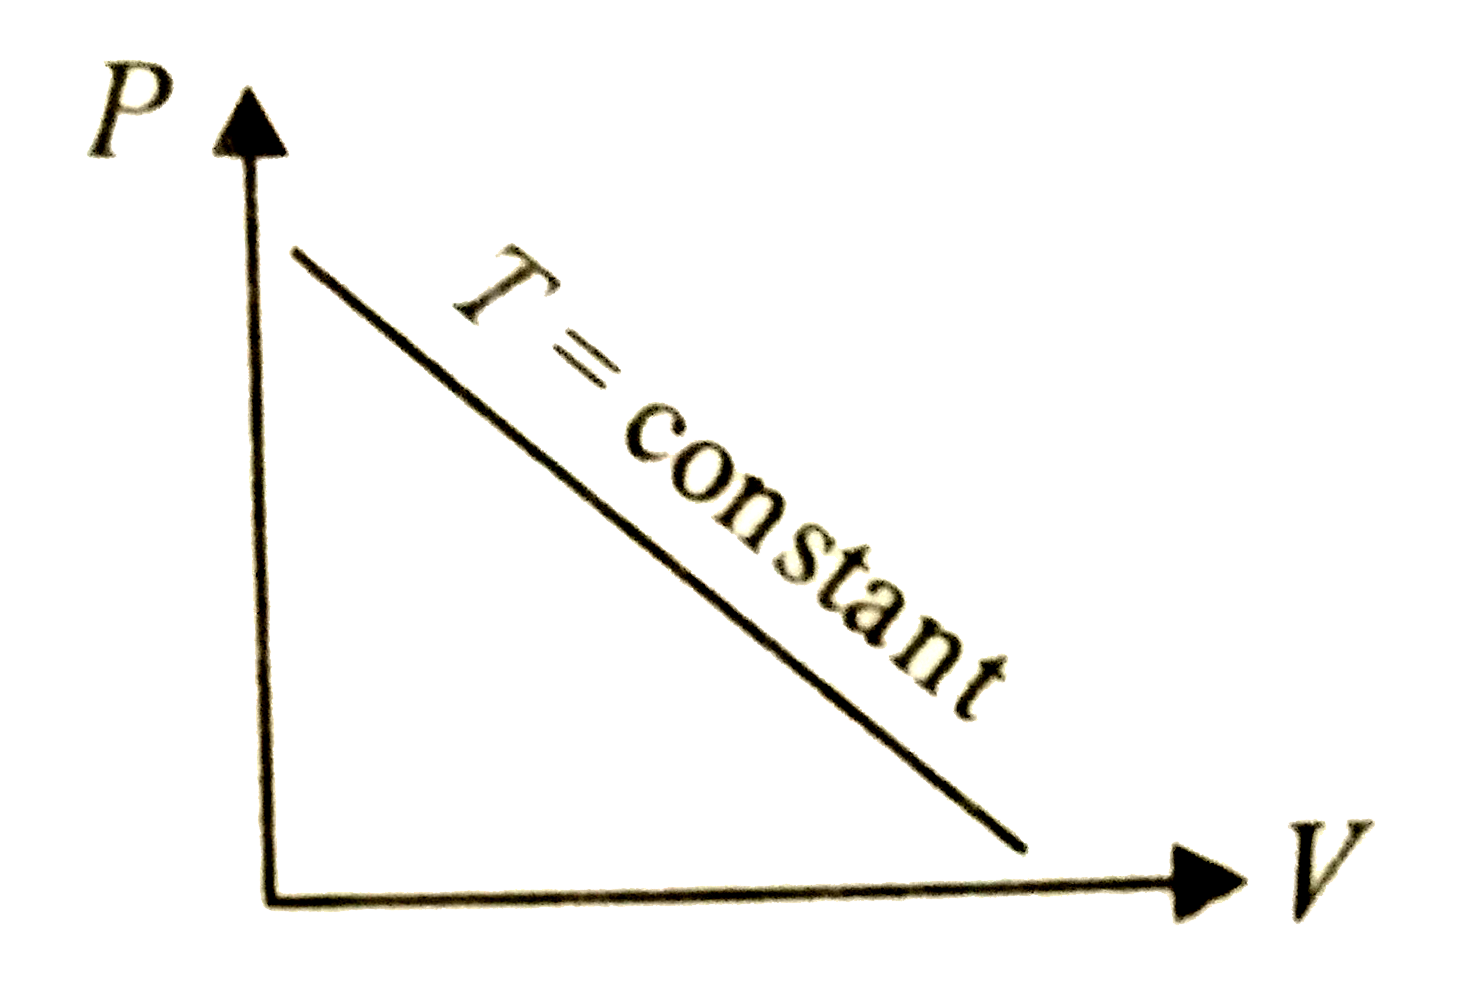 D4.
D4.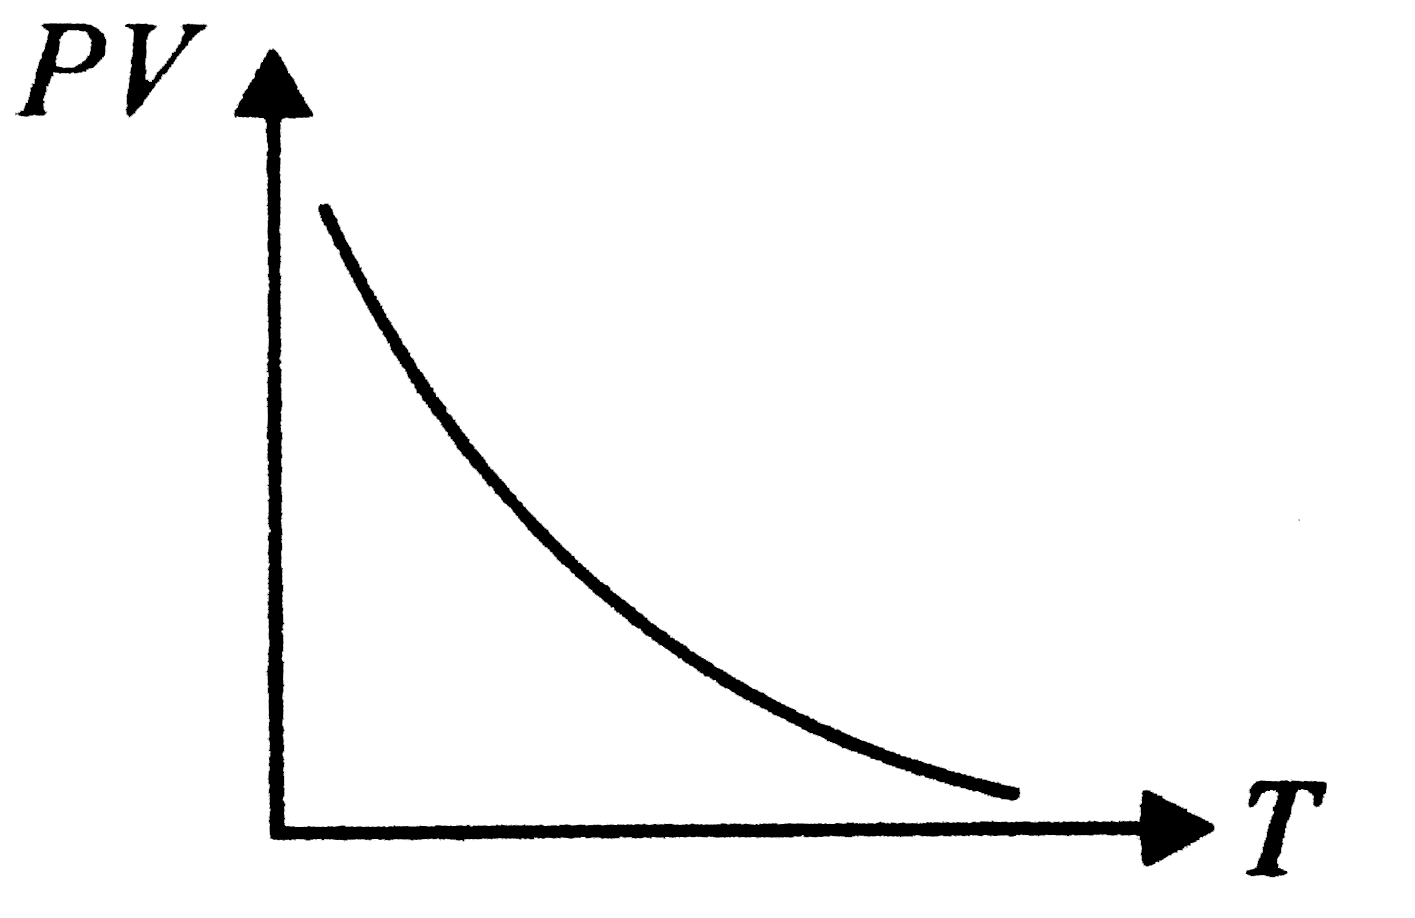
The gas mileage for Jan's car is 28 miles per gallon when the car travels at an average speed of 55 miles per hour. The car's gas tank has 20 gallons of gas at the beginning of a trip. If Jan drives at an average speed of 55 miles per hour, Which of the following functions f models the number of gallons of gas remaining in the tank t hours after the trip begins ?
Af(t)=20−2855tBf(t)=20−55t28Cf(t)=20−28t55Df(t)=20−55t28Jessica's car gets 18 miles per gallon when the car travels at an average speed of 35 miles per hour. Jessica begins a trip with 14 gallons of gas, and she travels at 35 miles per hour for the first 4 hours of her trip. Which of the following functions g is the most accurate model for the number of gallons of gallons of gas remaining in the tank t hours after the trip begins for 0≤t≤4?
Ag(t)=14−35t18Bg(t)=14−18t35Cg(t)=14−35t18Dg(t)=14−1835t
If heat energy is given to an ideal gas at constant pressure, then select the graph which best represents the variation of VT with temperature (T).
View SolutionAt time t=0, some radioactive gas is injected into a sealed vessel. At time T, some more of the same gas is injected into the same vessel. Which one of the following graphs best represents the variation of the logarithm of the activity A of the gas with time t?
View SolutionA car starts a trip with 20 gallons of gasoline in its tank and consumes gas at a rate of 1 gallon for each 25 miles traveled.
View SolutionA 50 L tank initailly contains 10 L of fresh water, At t=0, a brine solution containing 1 lb of salt per gallon is poured into the tank at the rate of 4 L/min, while the well-stirred mixture leaves the tank at the rate of 2 L/min. Then the amount of time required for overflow to occur in
View SolutionA car starts a trip with 20 gallons of gas in its tank. The at traveled at an average speed of 65 miles per hour for 3 hours and consumed gas at a rate of 30 miles per gallon. What percent of the gas in the tank was used for the 3-hour trip?
View Solution

