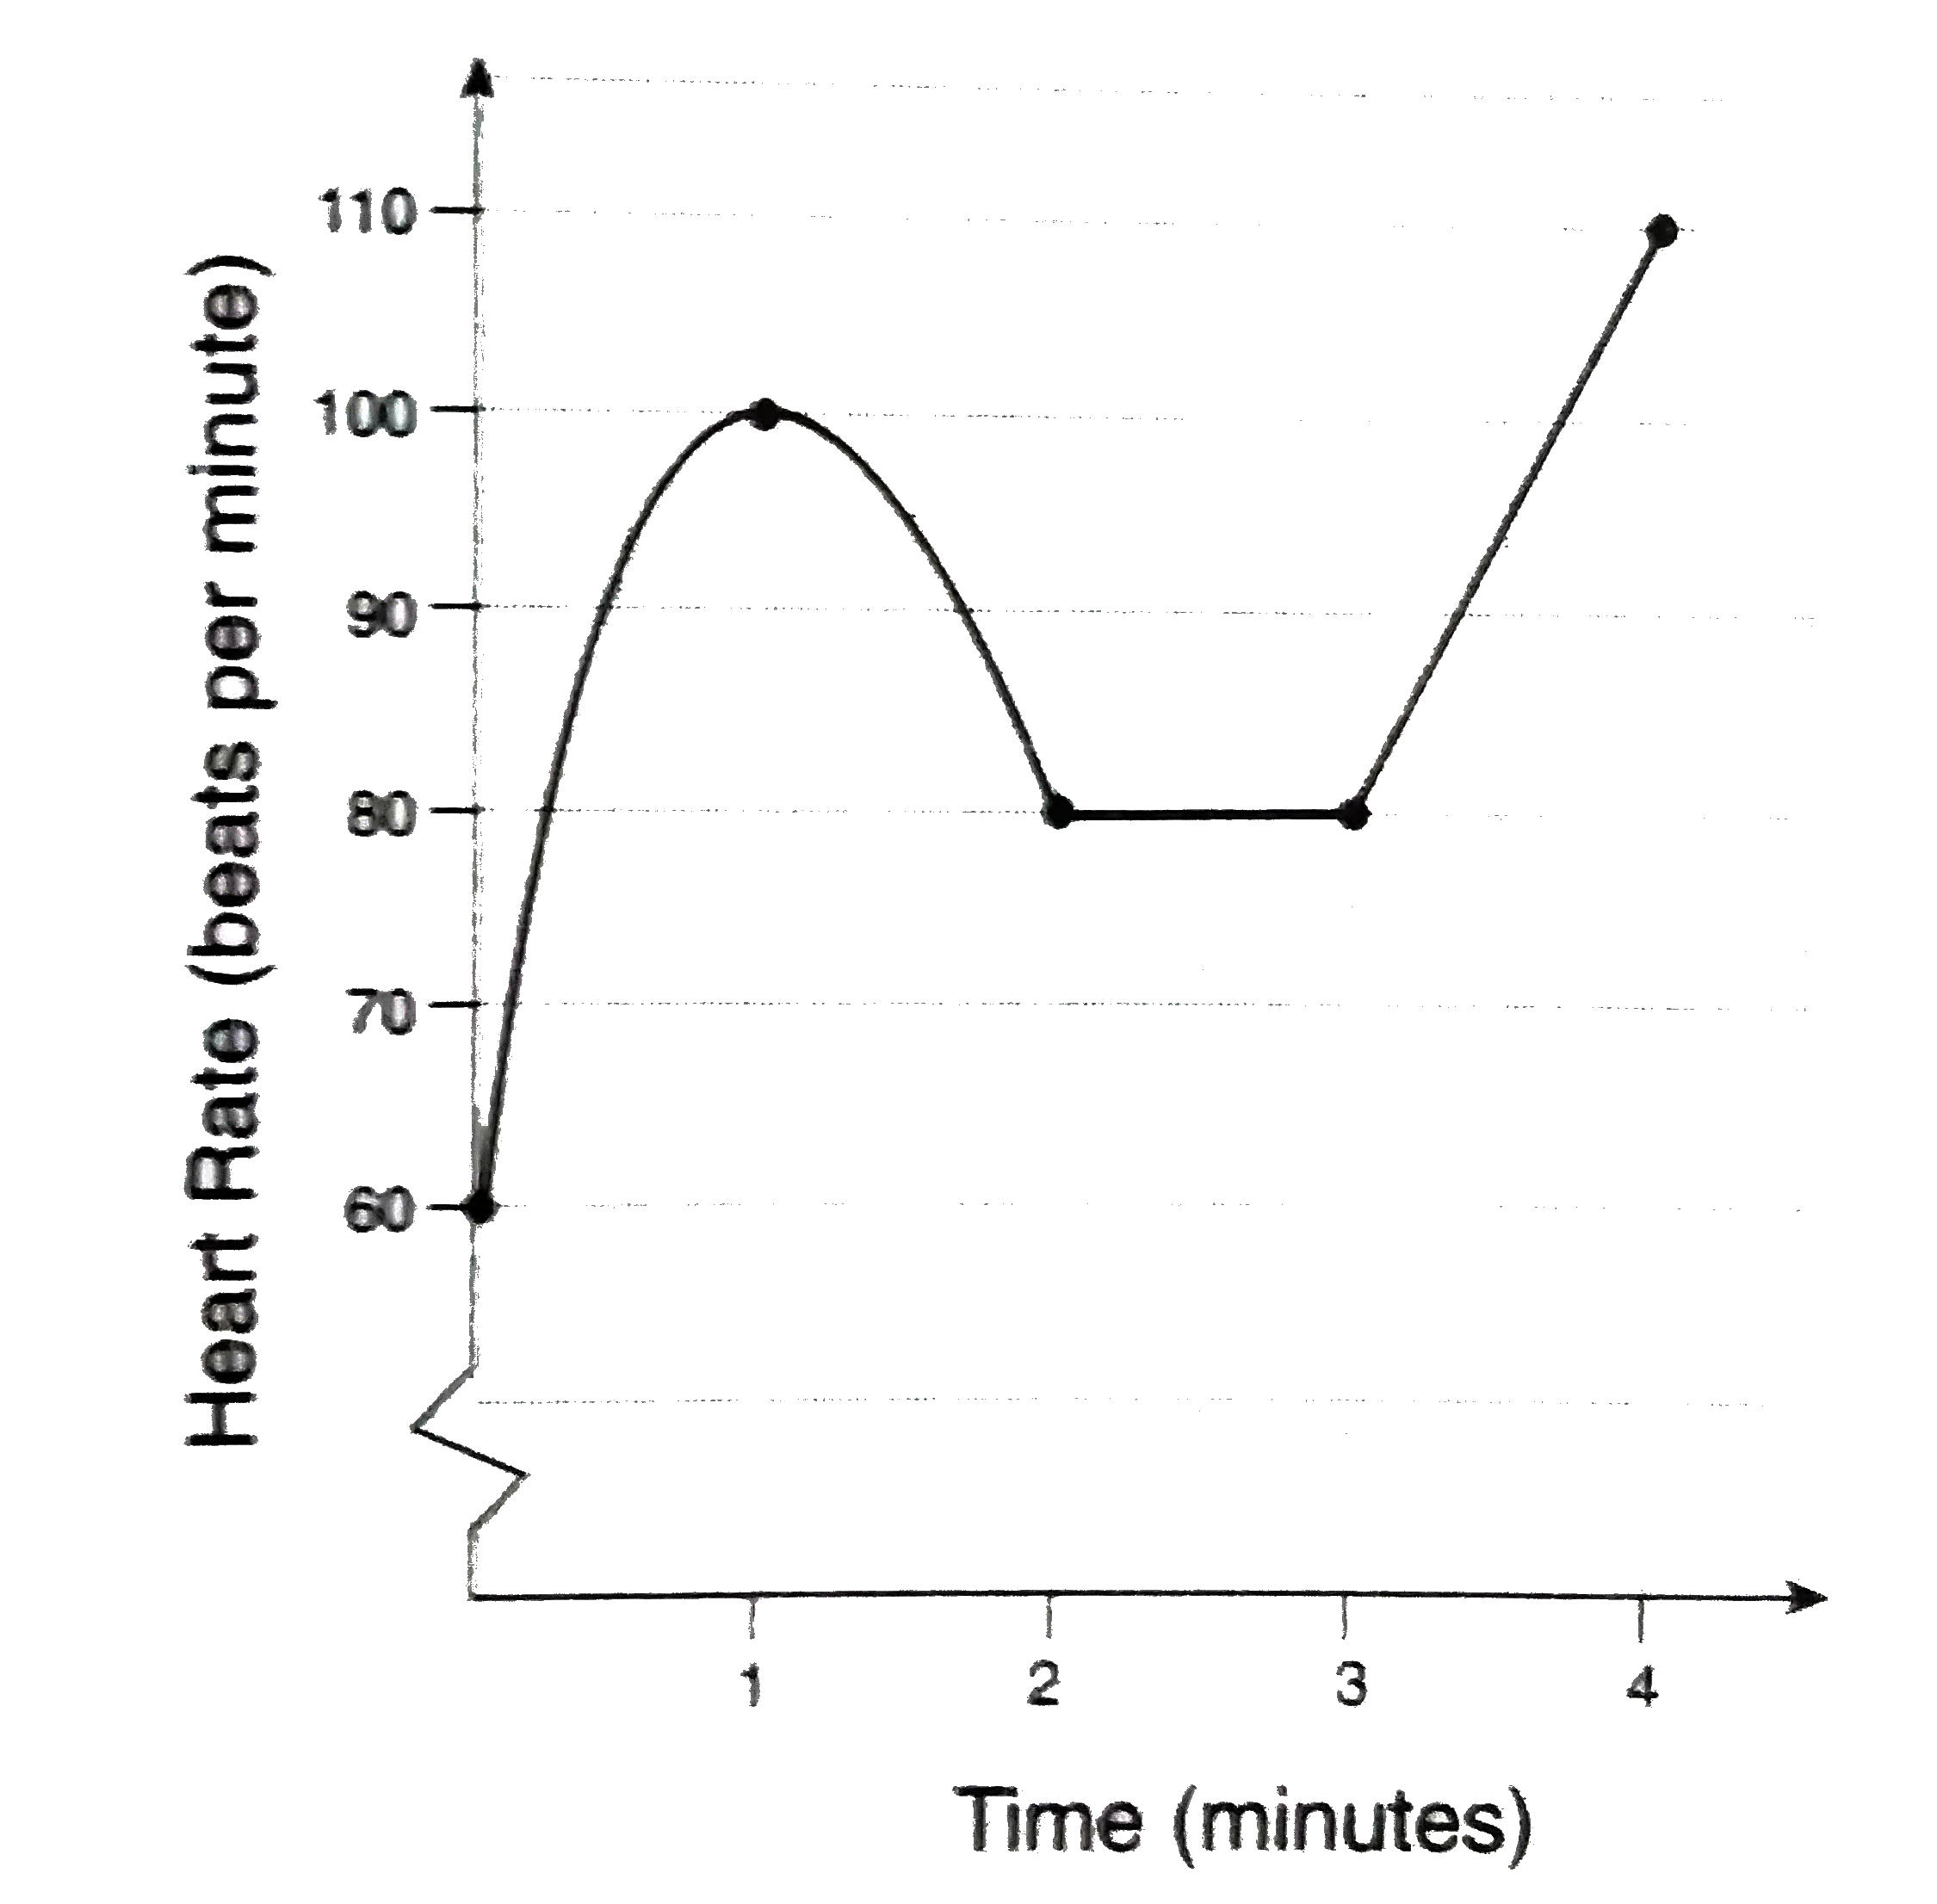
Question 13 and 14 refer to the gaph above which shows the heart rate, in veats per minutes, of a jogger during a 4-minutes interval.
Q. Overr what interval of time, in minutes, was the jogger's heart rate changing at a constant rate?
0 to 1
1 to 2
2 to 3
3 to 4
The correct Answer is:D
Step by step video, text & image solution for Question 13 and 14 refer to the gaph above which shows the heart rate, in veats per minutes, of a jogger during a 4-minutes interval. Q. Overr what interval of time, in minutes, was the jogger's heart rate changing at a constant rate? by Maths experts to help you in doubts & scoring excellent marks in Class 12 exams.
Topper's Solved these Questions
- BOOK - ENGLISH SATCHAPTER - PROBLEM SOLVING AND DATA ANALYSISEXERCISE - Grib-In40videos
PROBLEM SOLVING AND DATA ANALYSIS
- BOOK - ENGLISH SATCHAPTER - PROBLEM SOLVING AND DATA ANALYSISEXERCISE - Grib-In40videos
PROBLEM SOLVING AND DATA ANALYSIS
- BOOK - ENGLISH SATCHAPTER - PROBLEM SOLVING AND DATA ANALYSISEXERCISE - EXERICSE80videos
PROBLEM SOLVING AND DATA ANALYSIS
- BOOK - ENGLISH SATCHAPTER - PROBLEMS IN CONTEXT EXERCISE - PRACTICE TEST10videos
PROBLEMS IN CONTEXT
Similar Questions
Knowledge Check
- Question 1 - Select One
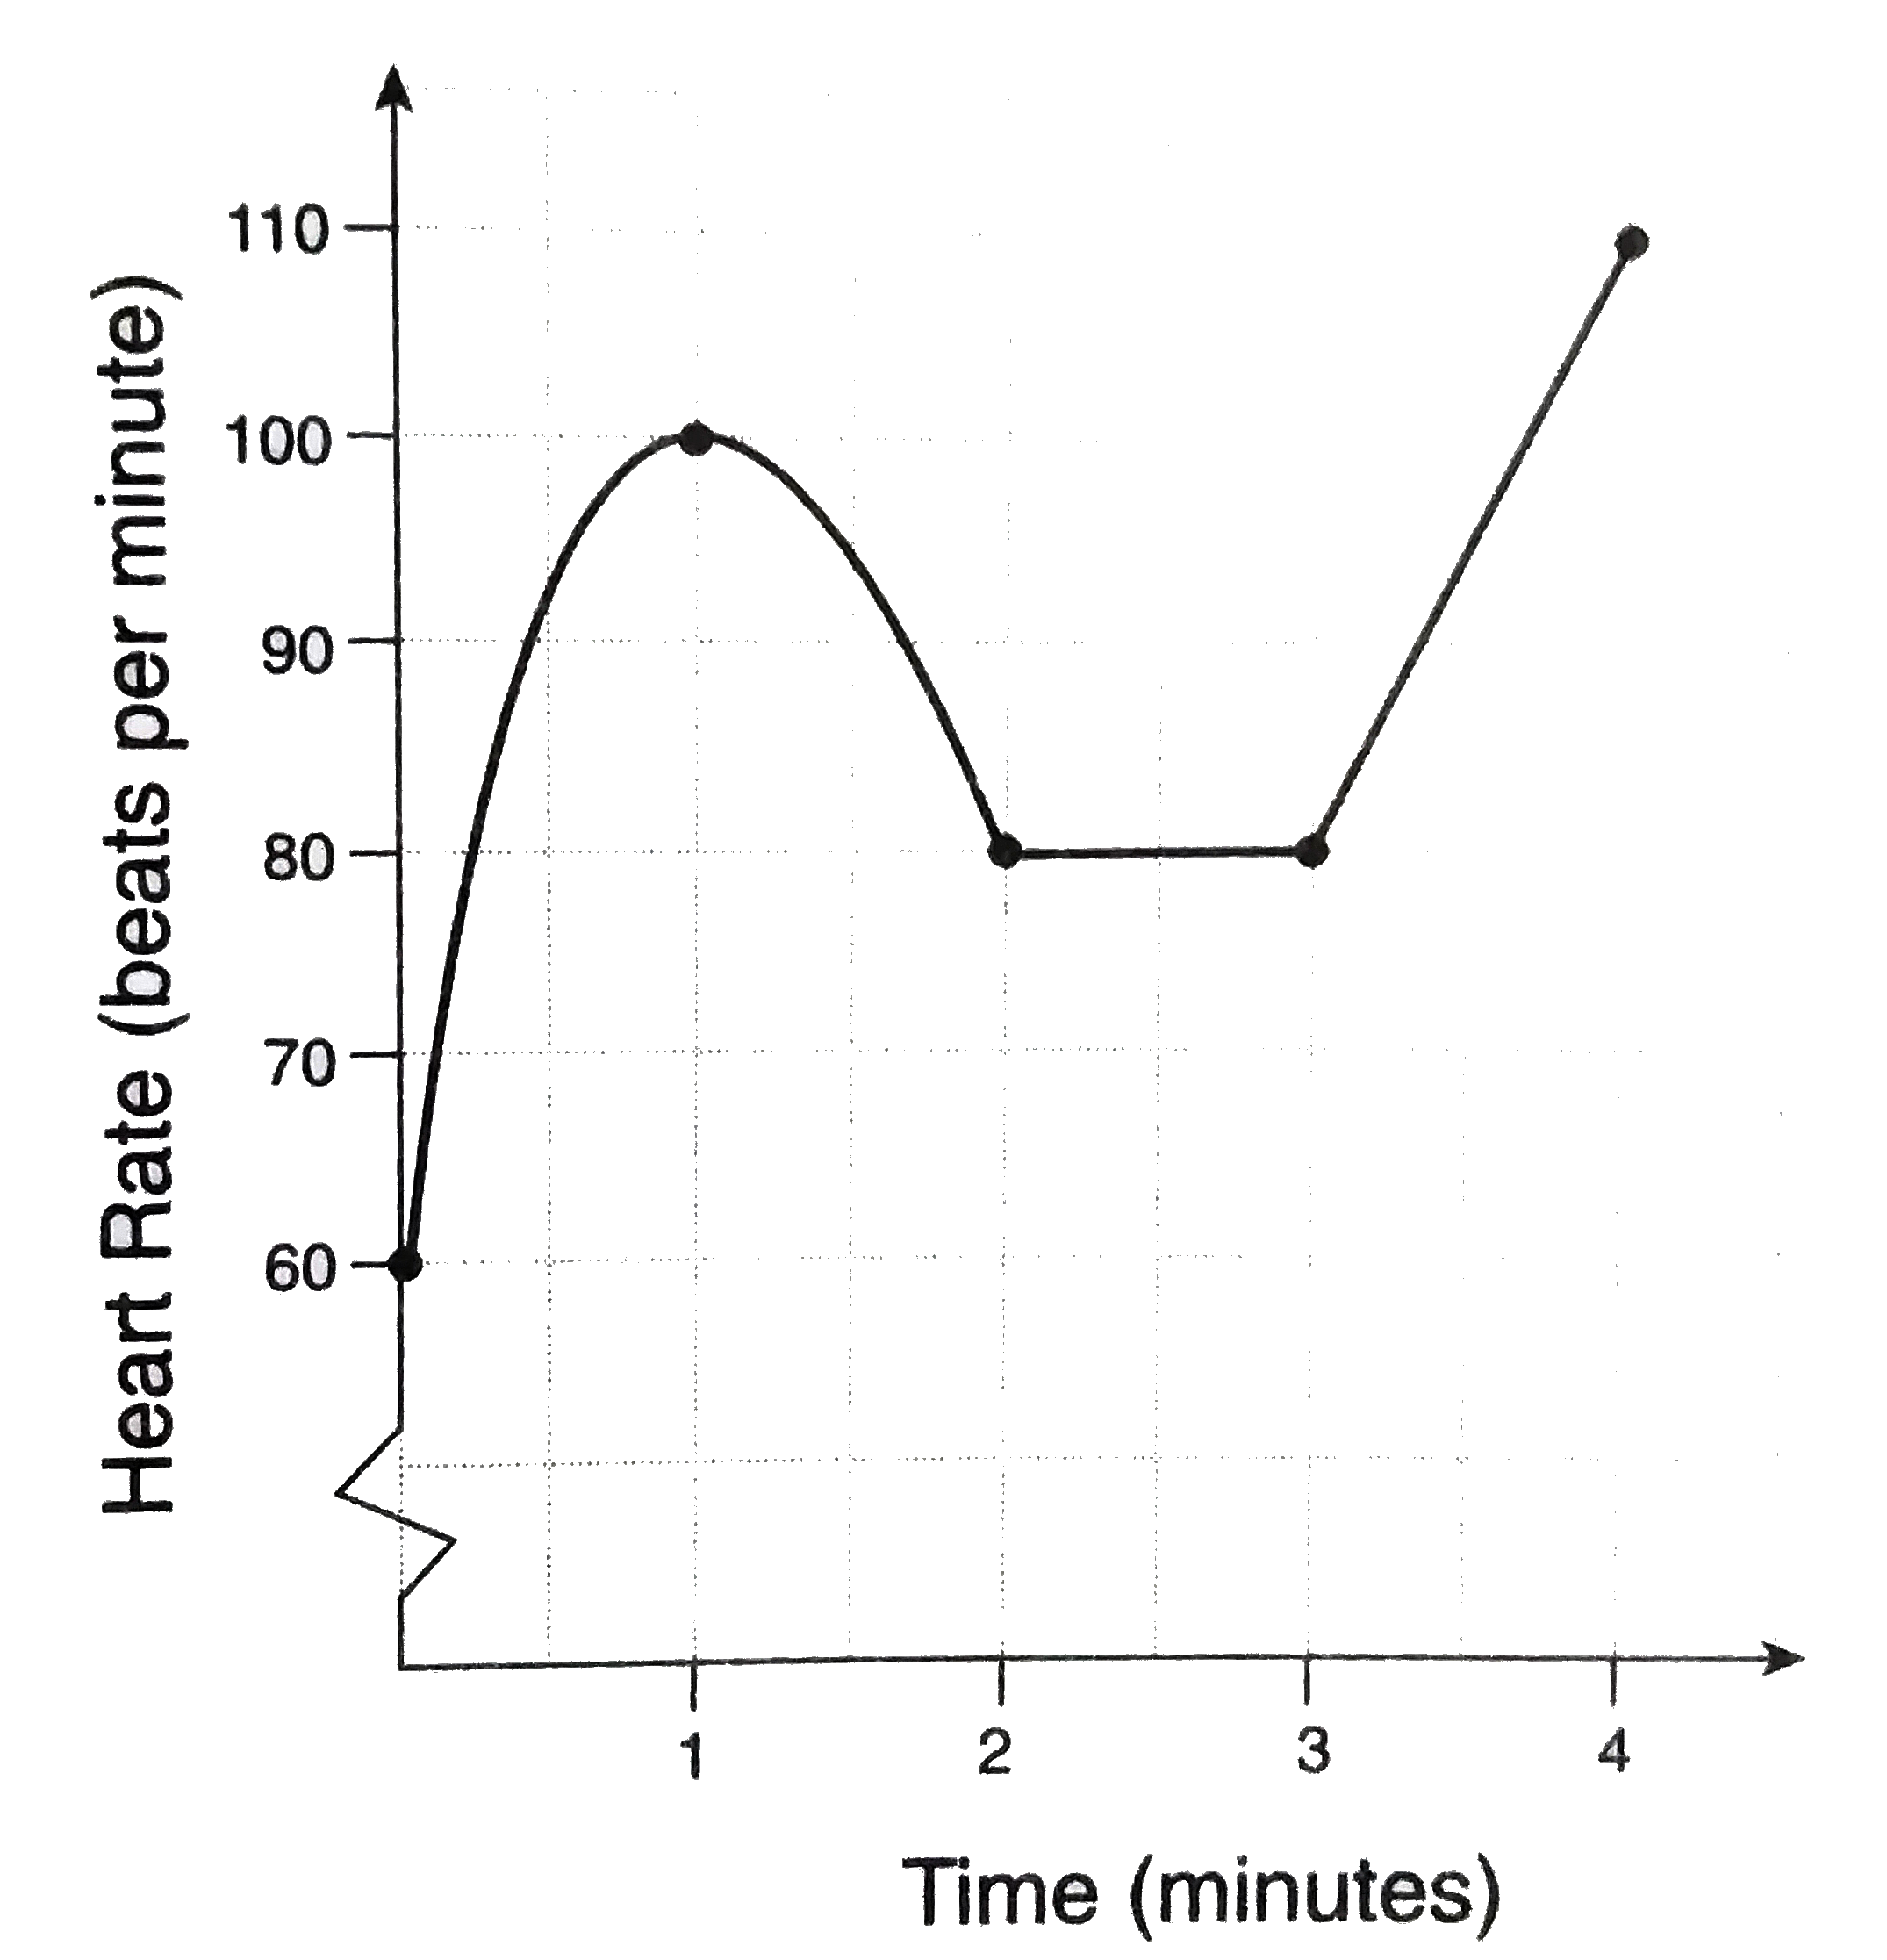
Question 13 and 14 refer to the gaph above which shows the heart rate, in veats per minutes, of a jogger during a 4-minutes interval.
Q. The greatest percent of increase in the jogger's heart rate occured over what interval of time, in minutes?A0 to 1B1 to 2C2 to 3D3 to 4 - Question 2 - Select One
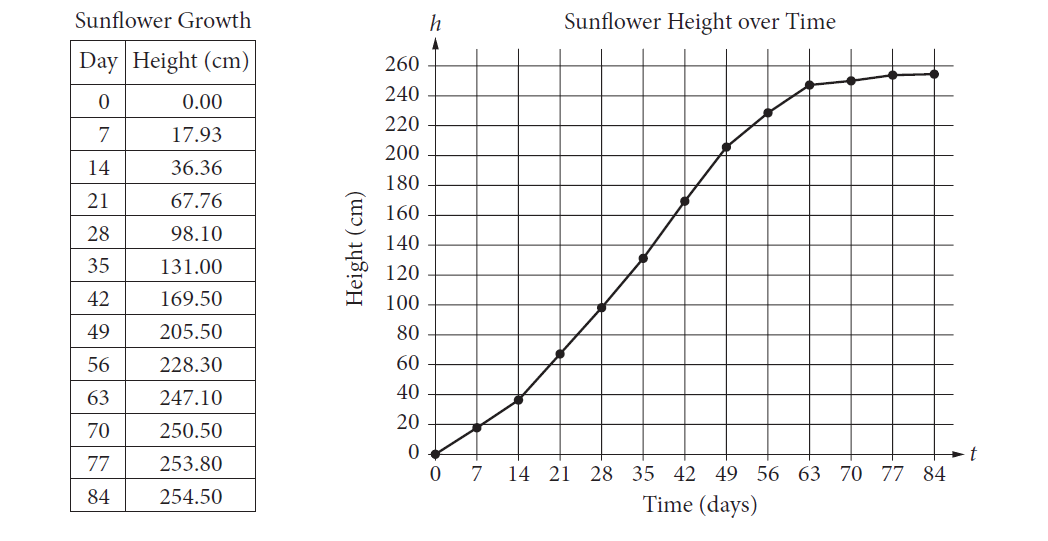
In 1919, H. S. Reed and R. H. Holland published a paper on the growth of sunflowers. Included in the paper were the table and graph above, which show the height h, in centimeters, of a sunflower t days after the sunflower begins to grow.
The growth rate of the sunflower from day 14 to day 35 is nearly constant. On this interval, which of the following equations best models the height h, in centimeters, of the sunflower t days after it begins to grow?Ah = 2.1t − 15Bh = 4.5t − 27Ch = 6.8t − 12Dh = 13.2t − 18 - Question 3 - Select One
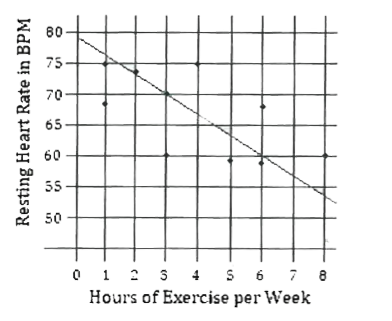
Ten 25 - years - old men were asked how many hours per week they exercise and their resting heart rate was taken in beats per minute (BPM). The results are shown as points in the scatterplot above, and the line of best fit is drawn. What is the resting heart rate, in BPM, of the men represented by the data point that is farthest from the line of best fit?A60B66C67D75
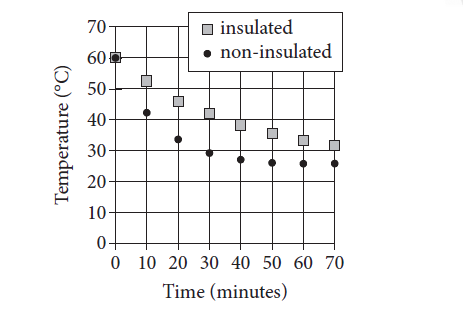
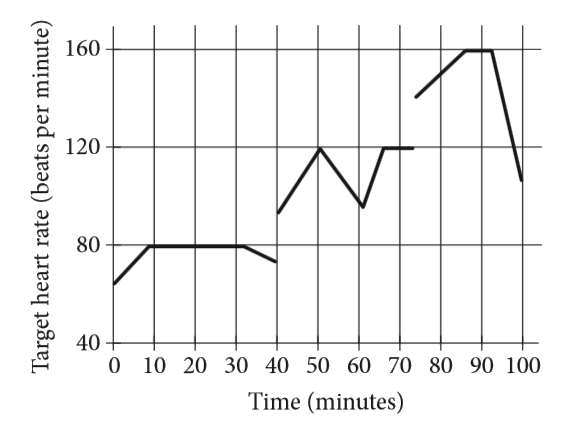
Two samples of water of equal mass are heated to 60 degrees Celsius (°C). One sample is poured into an insulated container, and the other sample is poured into a non-insulated container. The samples are then left for 70 minutes to cool in a room having a temperature of 25°C. The graph above shows the temperature of each sample at 10-minute intervals. Which of the following statements correctly compares the average rates at which the temperatures of the two samples change?View SolutionJohn runs at different speeds as part of his training program. The graph shows his target heart rate at different times during his workout. On which interval is the target heart rate strictly increasing then strictly decreasing?
 View Solution
When there are x milligrams of a certain drug in a patient's bloodstream, a patient's heart rate, h, in beats per minute, can be modeled by the equation h=60+0.5x. Which statements are true?
I. 10 minutes after taking the drug, the patient's heart rate increase to 75 beats per minute.
II. When the drug is not in the bloodstream, the patient's heart rate is 70 beats per minute.
III. For each 10 milligram increase of the drug in the patient's bloodstream, the patient's heartbeat increase 5 beats per minute.View Solution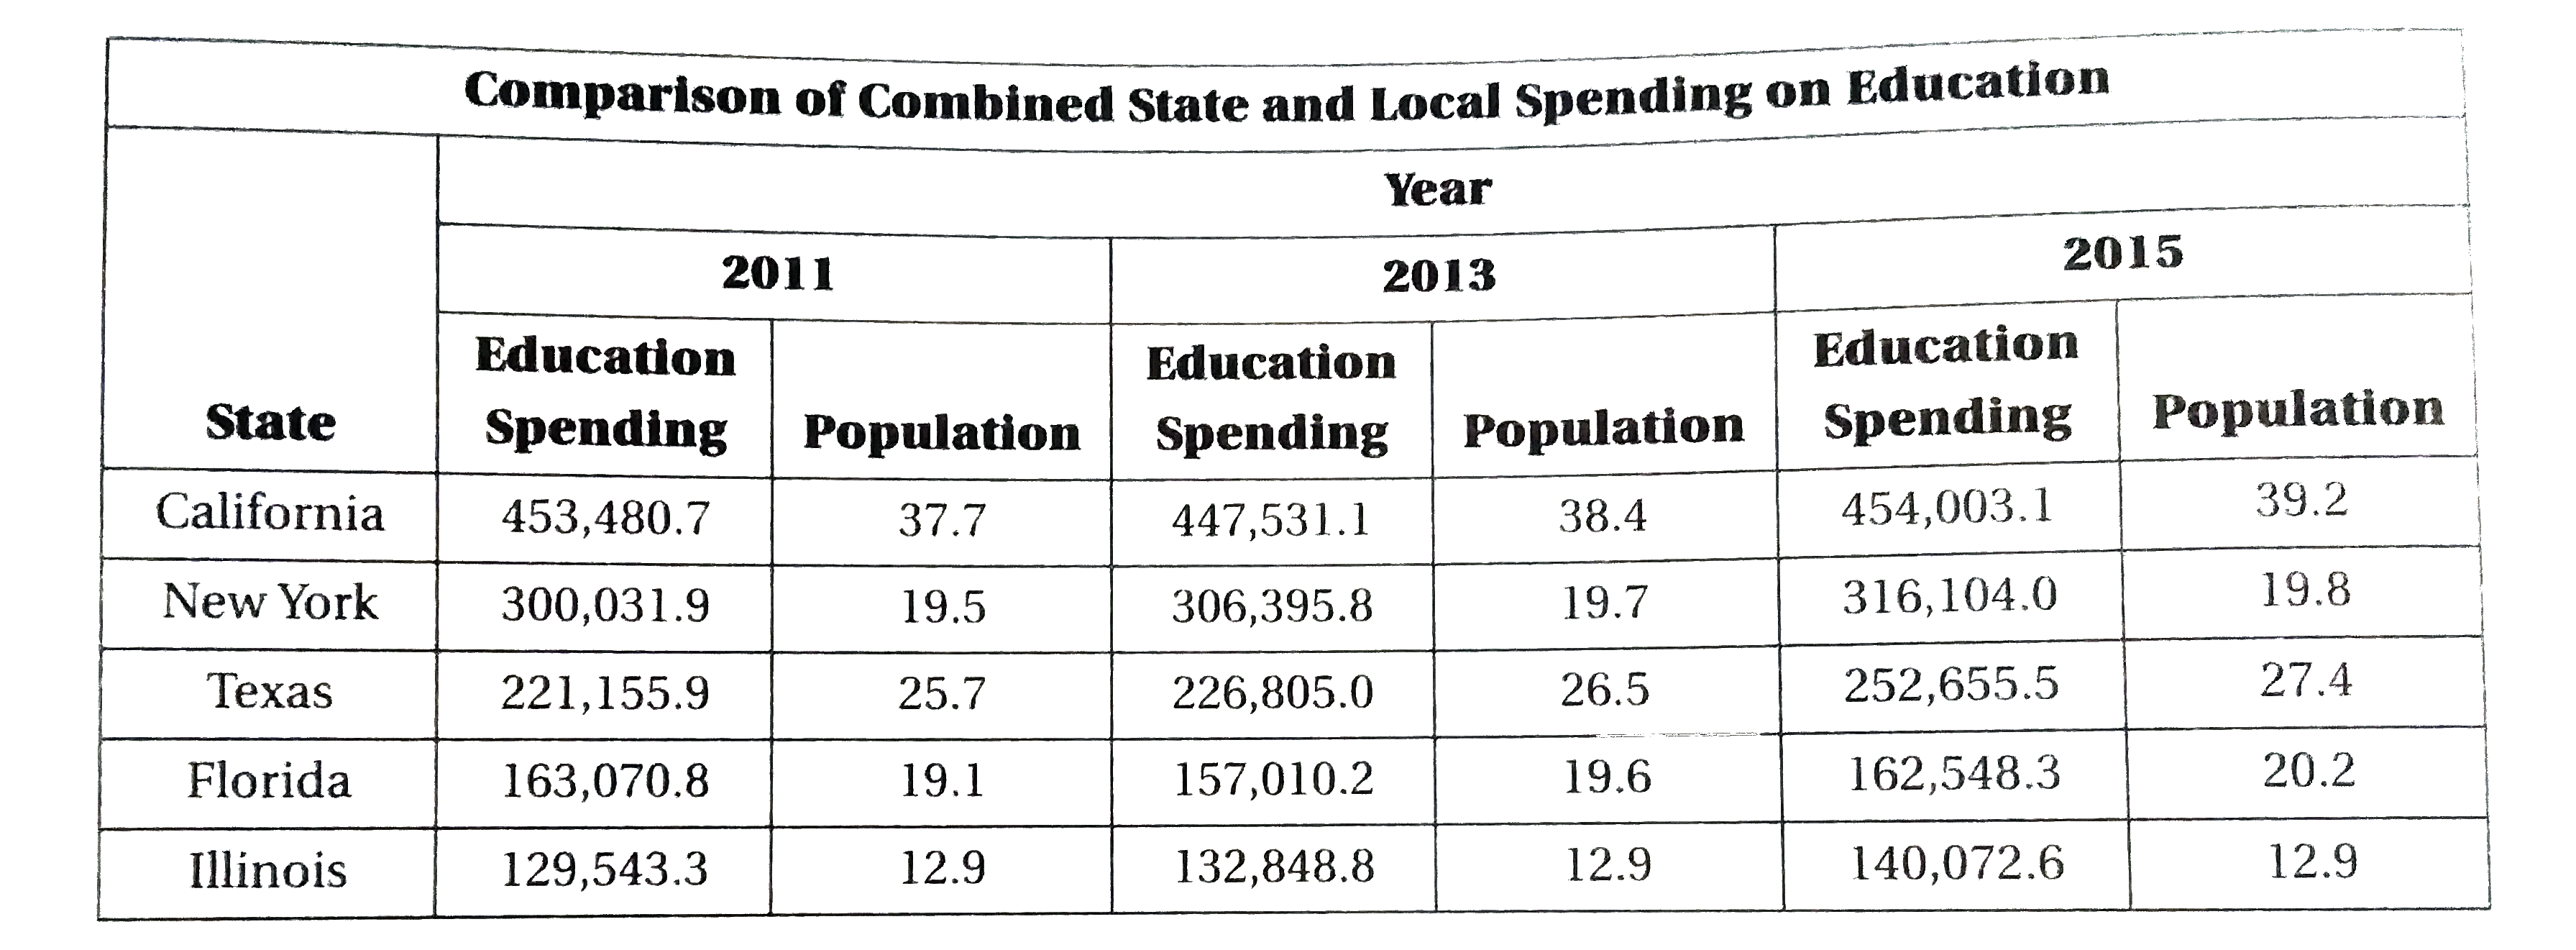
Question 16 and 17 refer to the above table, that shows the population (in millions) and education spending (in millions) and by state for each of the states listed for the years 2011, 2013, and 2015.
Q. Which of the following best approximates the average rate of change in education spending in Texas from 2011 to 2015?View Solution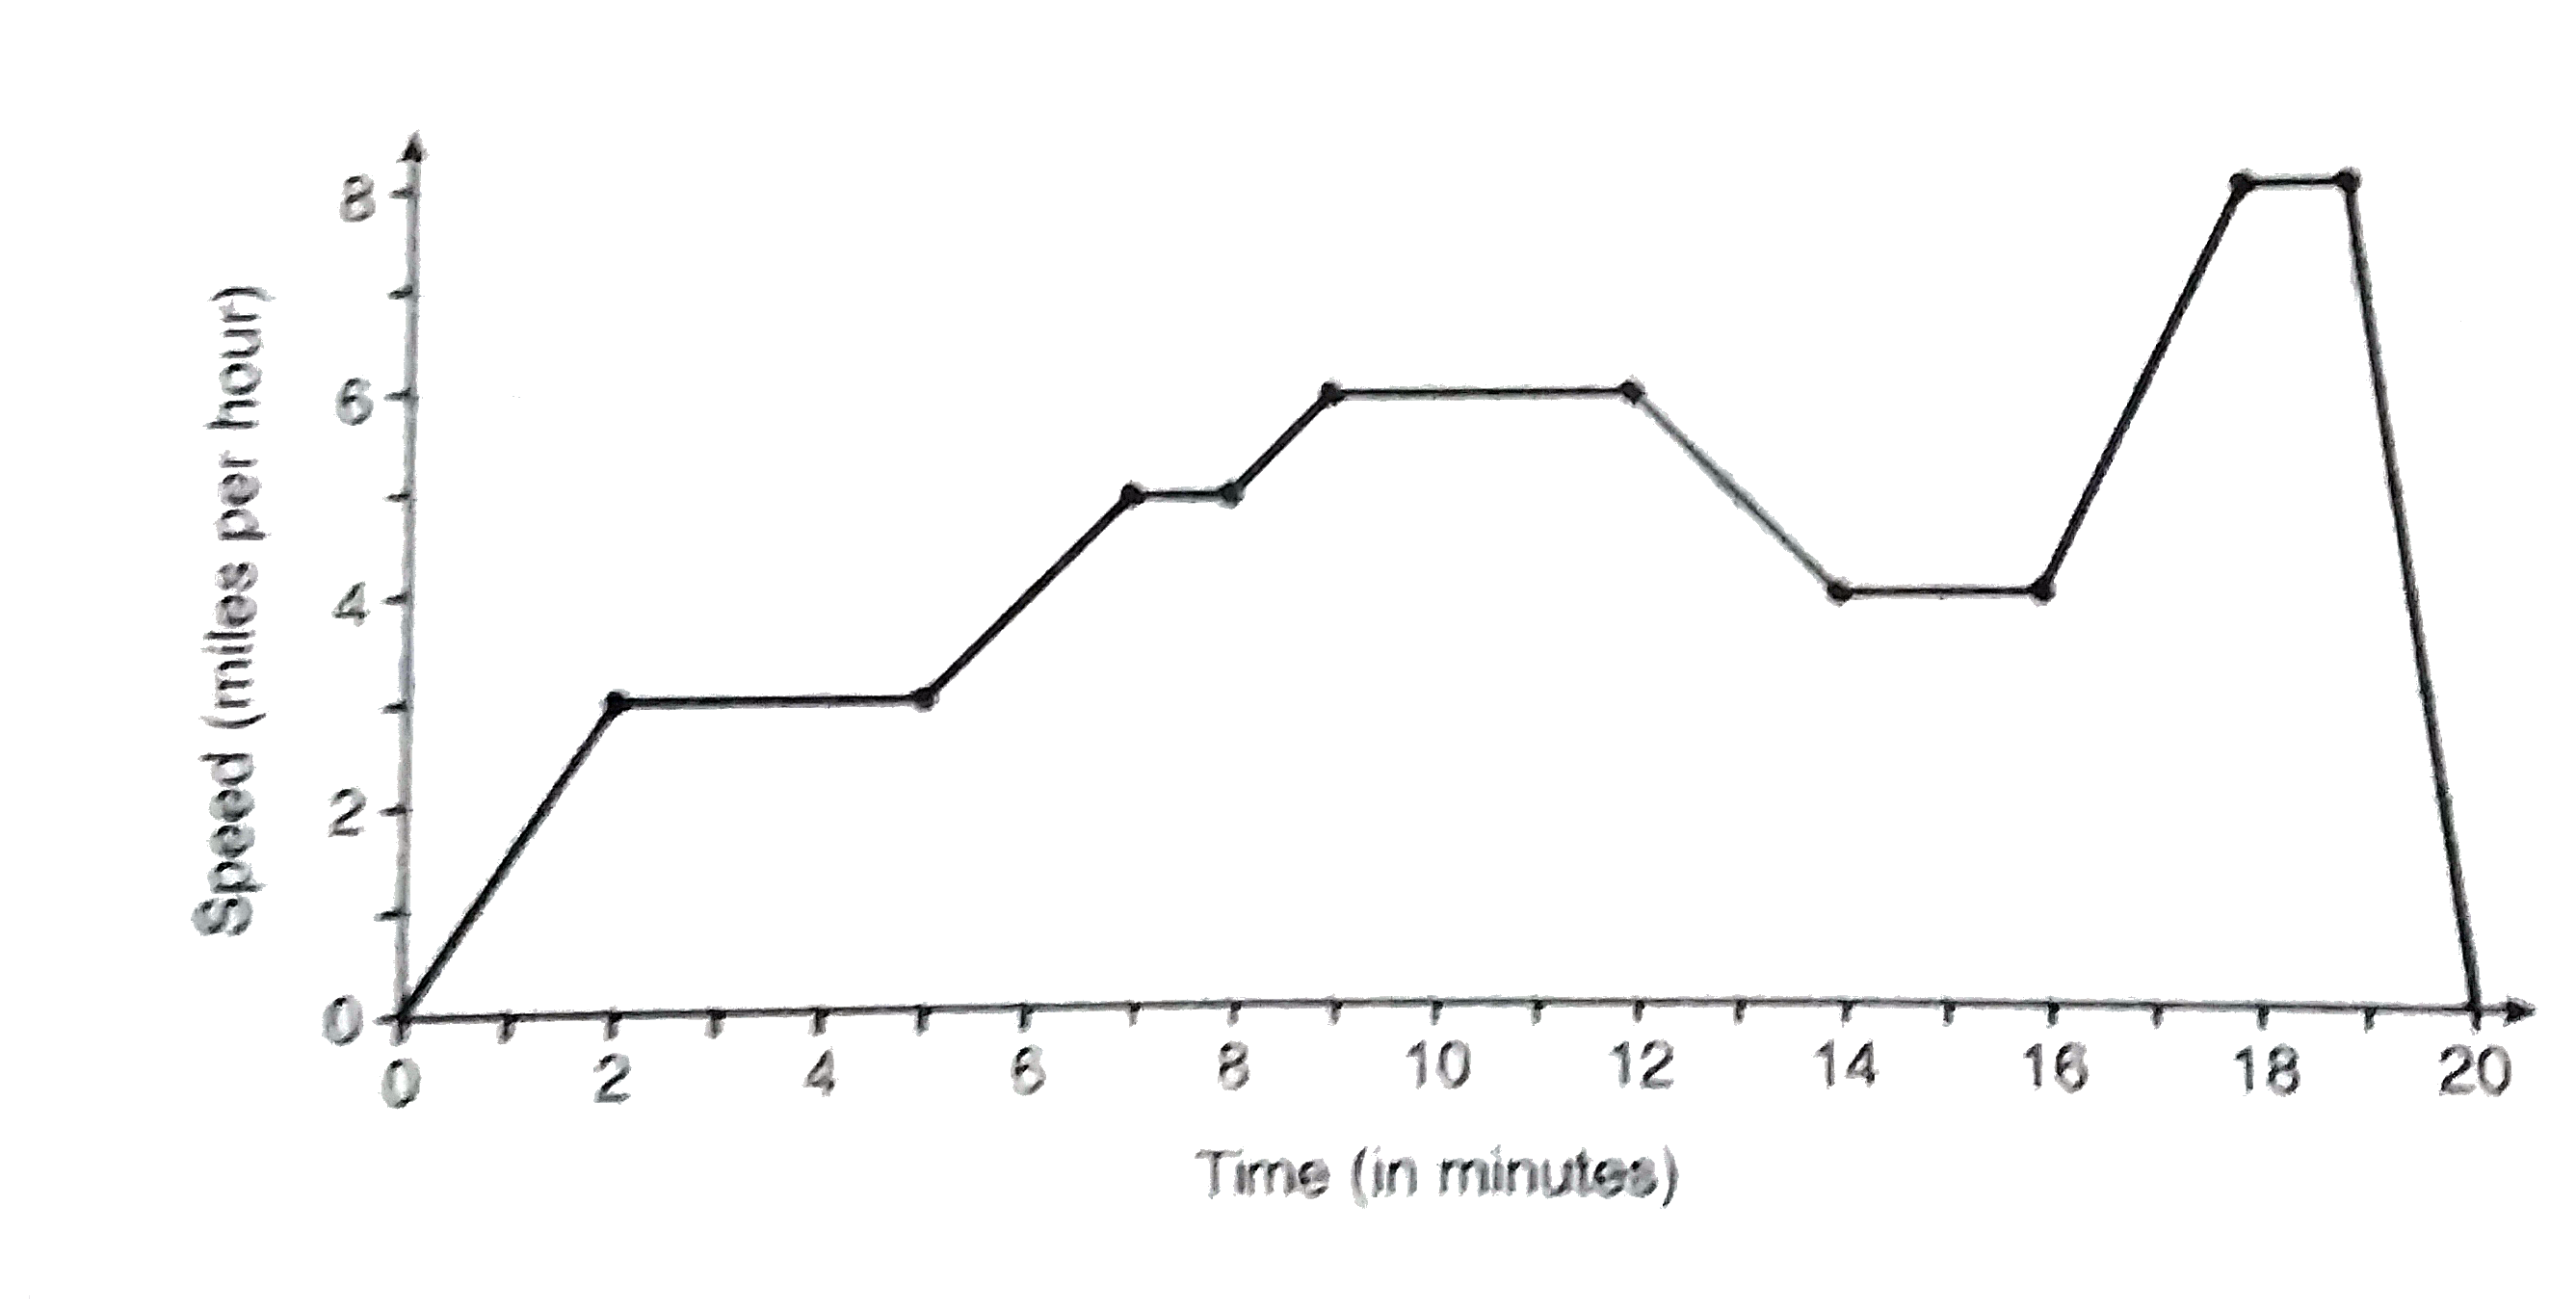
The graph above represents a jogger's speed during her 20-minutes jog around her neighbourhood. Which statement best describes what the jogger was doing during the 9-12 minutes interval of her jog?View Solution

