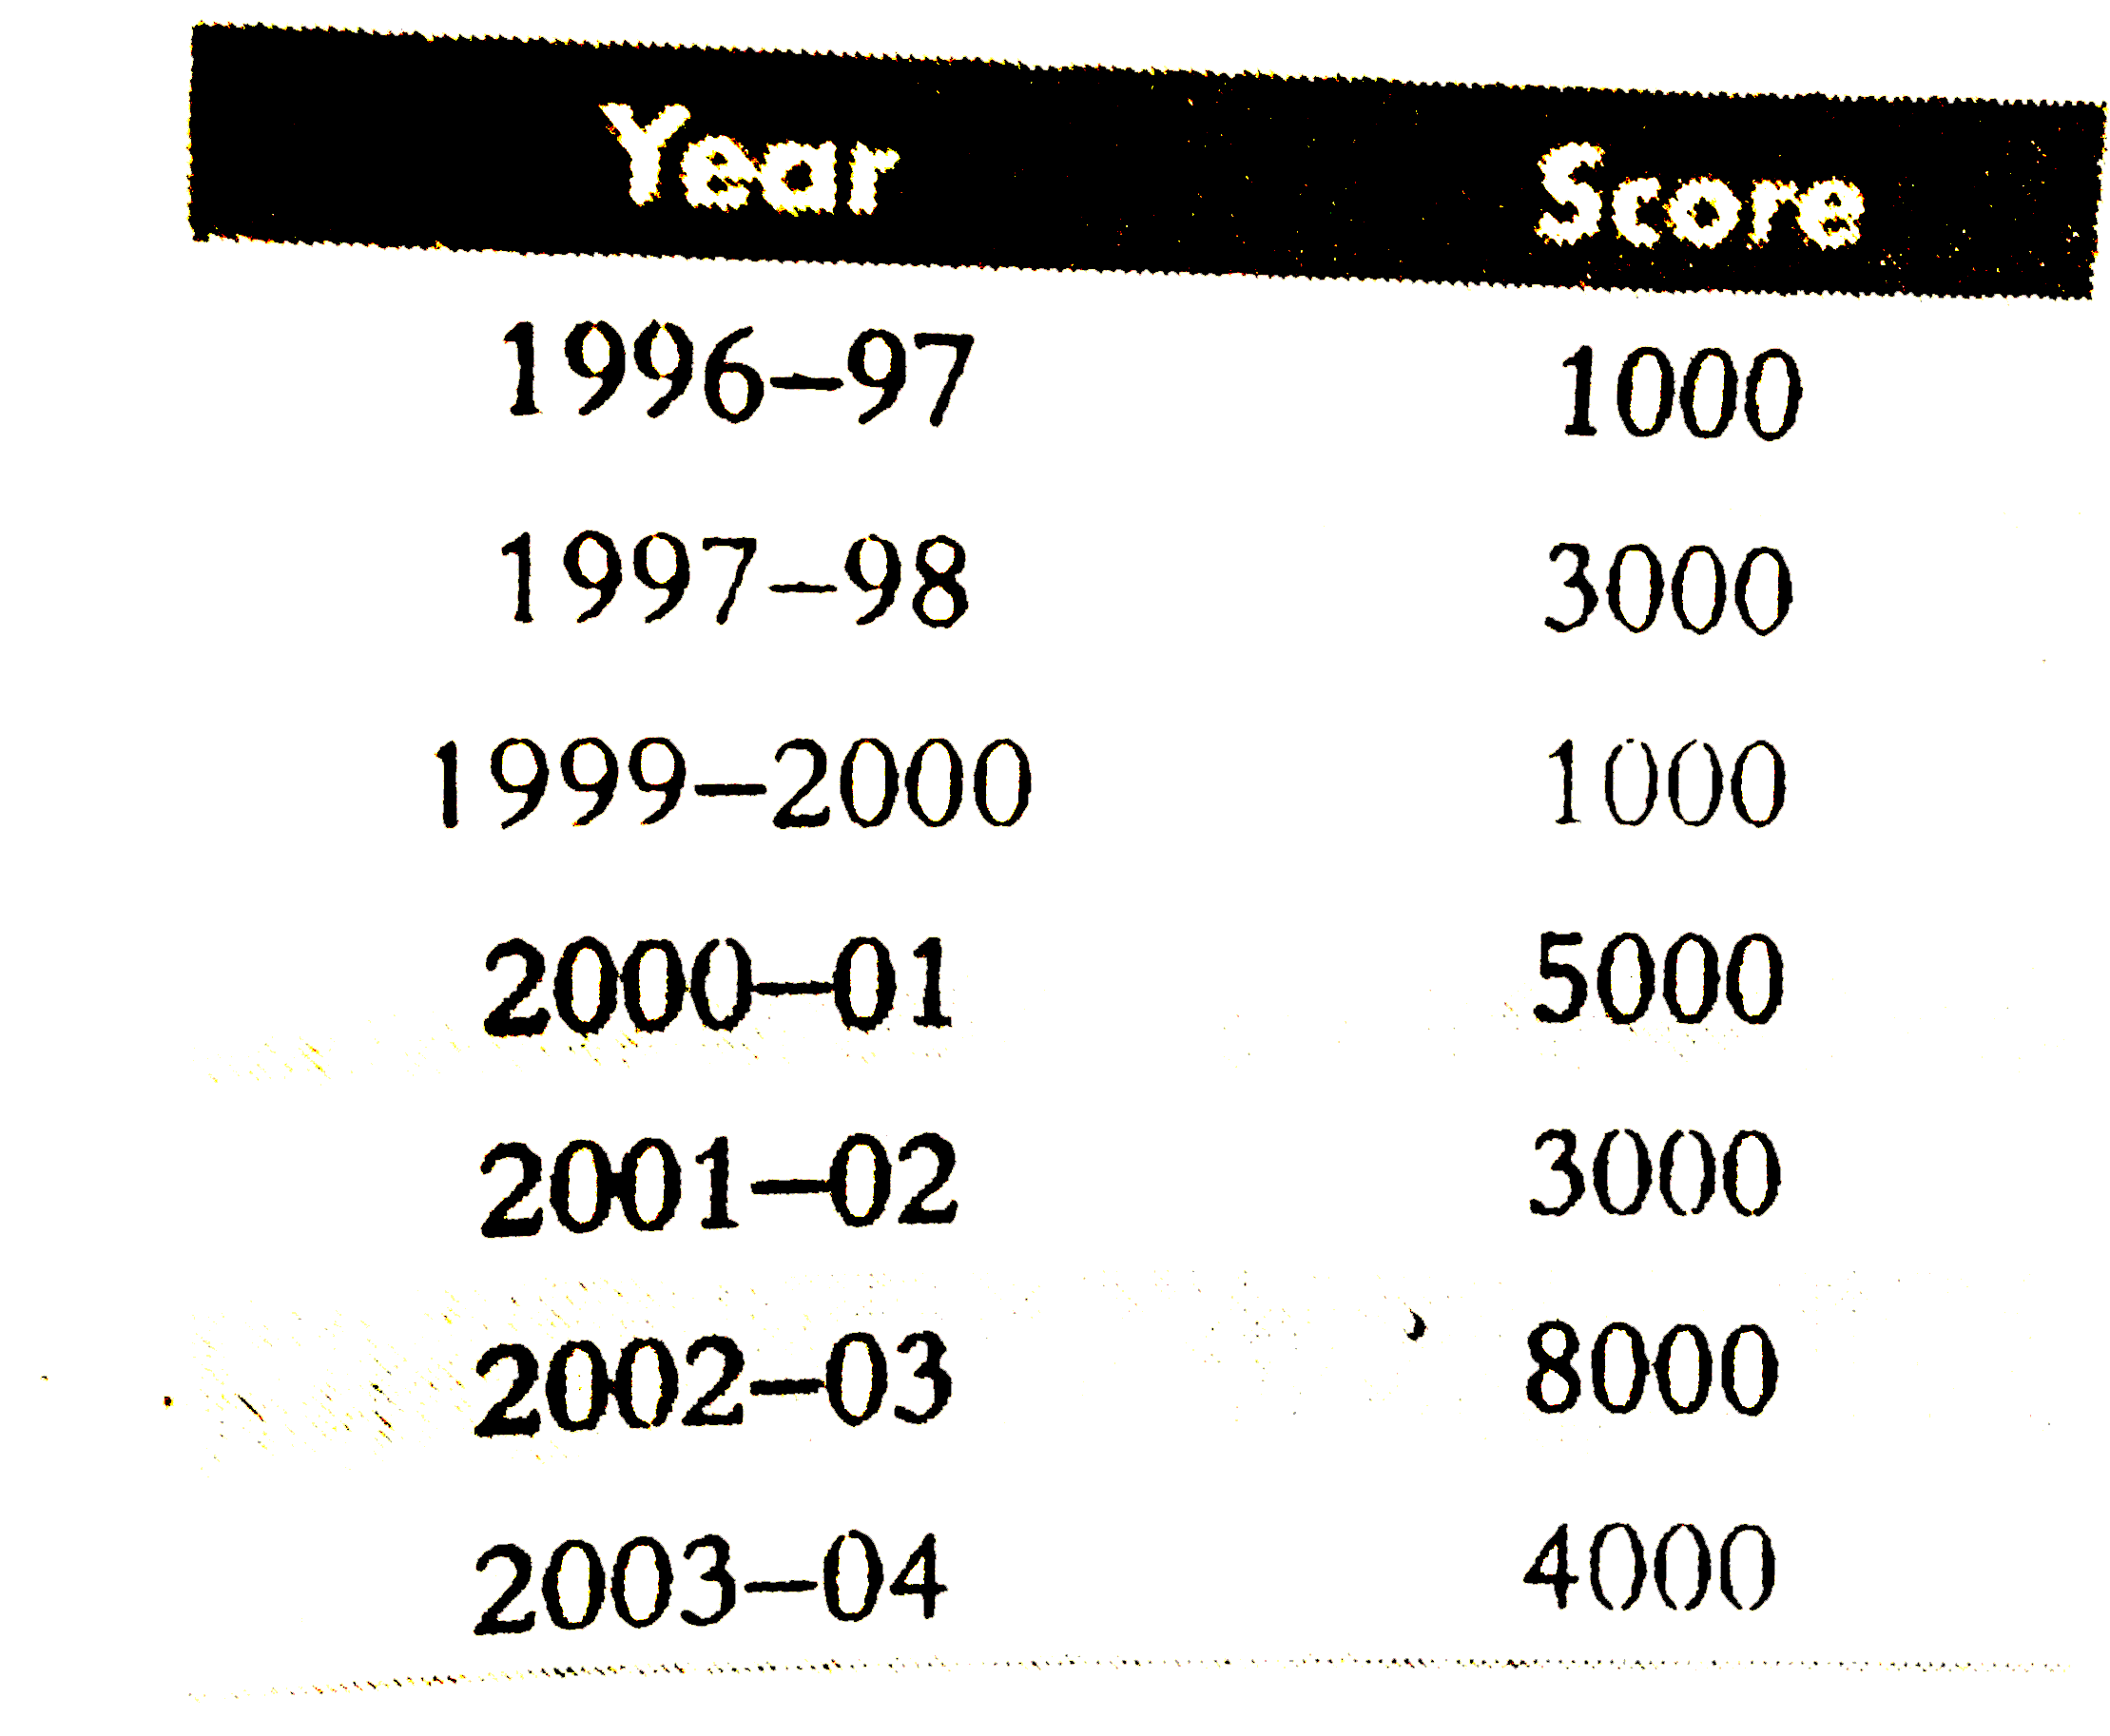
The runs scored by a cricket team in first 10
over are given below:

Draw a graph depicting the data
Step by step video & image solution for The runs scored by a cricket team in first 10 over are given below: Draw a graph depicting the data by Maths experts to help you in doubts & scoring excellent marks in Class 8 exams.
Updated on:21/07/2023Topper's Solved these Questions
Similar Questions
The runs scored by a cricket team in first 10 overs are given below:

Draw a line graph representing the above data.
View SolutionThe runs scored by a cricket team in first 15 overs are given below: Overs, I, II, III, IV, V, VI, VII, VIII, IX, X, XI, XII, XIII, XIV, XV Runs:, 2, 1, 4, 2, 6, 8, 10, 21, 5, 8, 3, 2, 6, 8, 12 Draw the graph representing the above data in two different ways as a graph and as a bar chart.
View SolutionThe runs scored by a cricket team in first 10 over are given below:

Draw a graph depicting the data
View SolutionThe runs scored by two teams A and B in first 10 overs are given below: Overs, I, II, III, IV, V, VI, VII, VIII, IX, X Team A:, 2, 1, 8, 9, 4, 5, 6, 10, 6, 2 Team B:, 5, 6, 2, 10, 5, 6, 3, 4, 8, 10 Draw a graph depicting the data, making the graphs on the same axes in each case in two different ways as a graph and as a bar chart.
View SolutionThe sales of a shopkeeper in the first week of january 2012, are given below :

Draw a graph representing the above data.
View SolutionThe runs scored by Sachin Tendulkar in different years is given below:

What is the porbability that in a year Sachin scored more than 3000 runs?
View SolutionThe number of runs given by a bowler in a one-day match in 10 overs is given below.
Draw the line graph for given data.
Overs12345678910Number of runs28510472012711
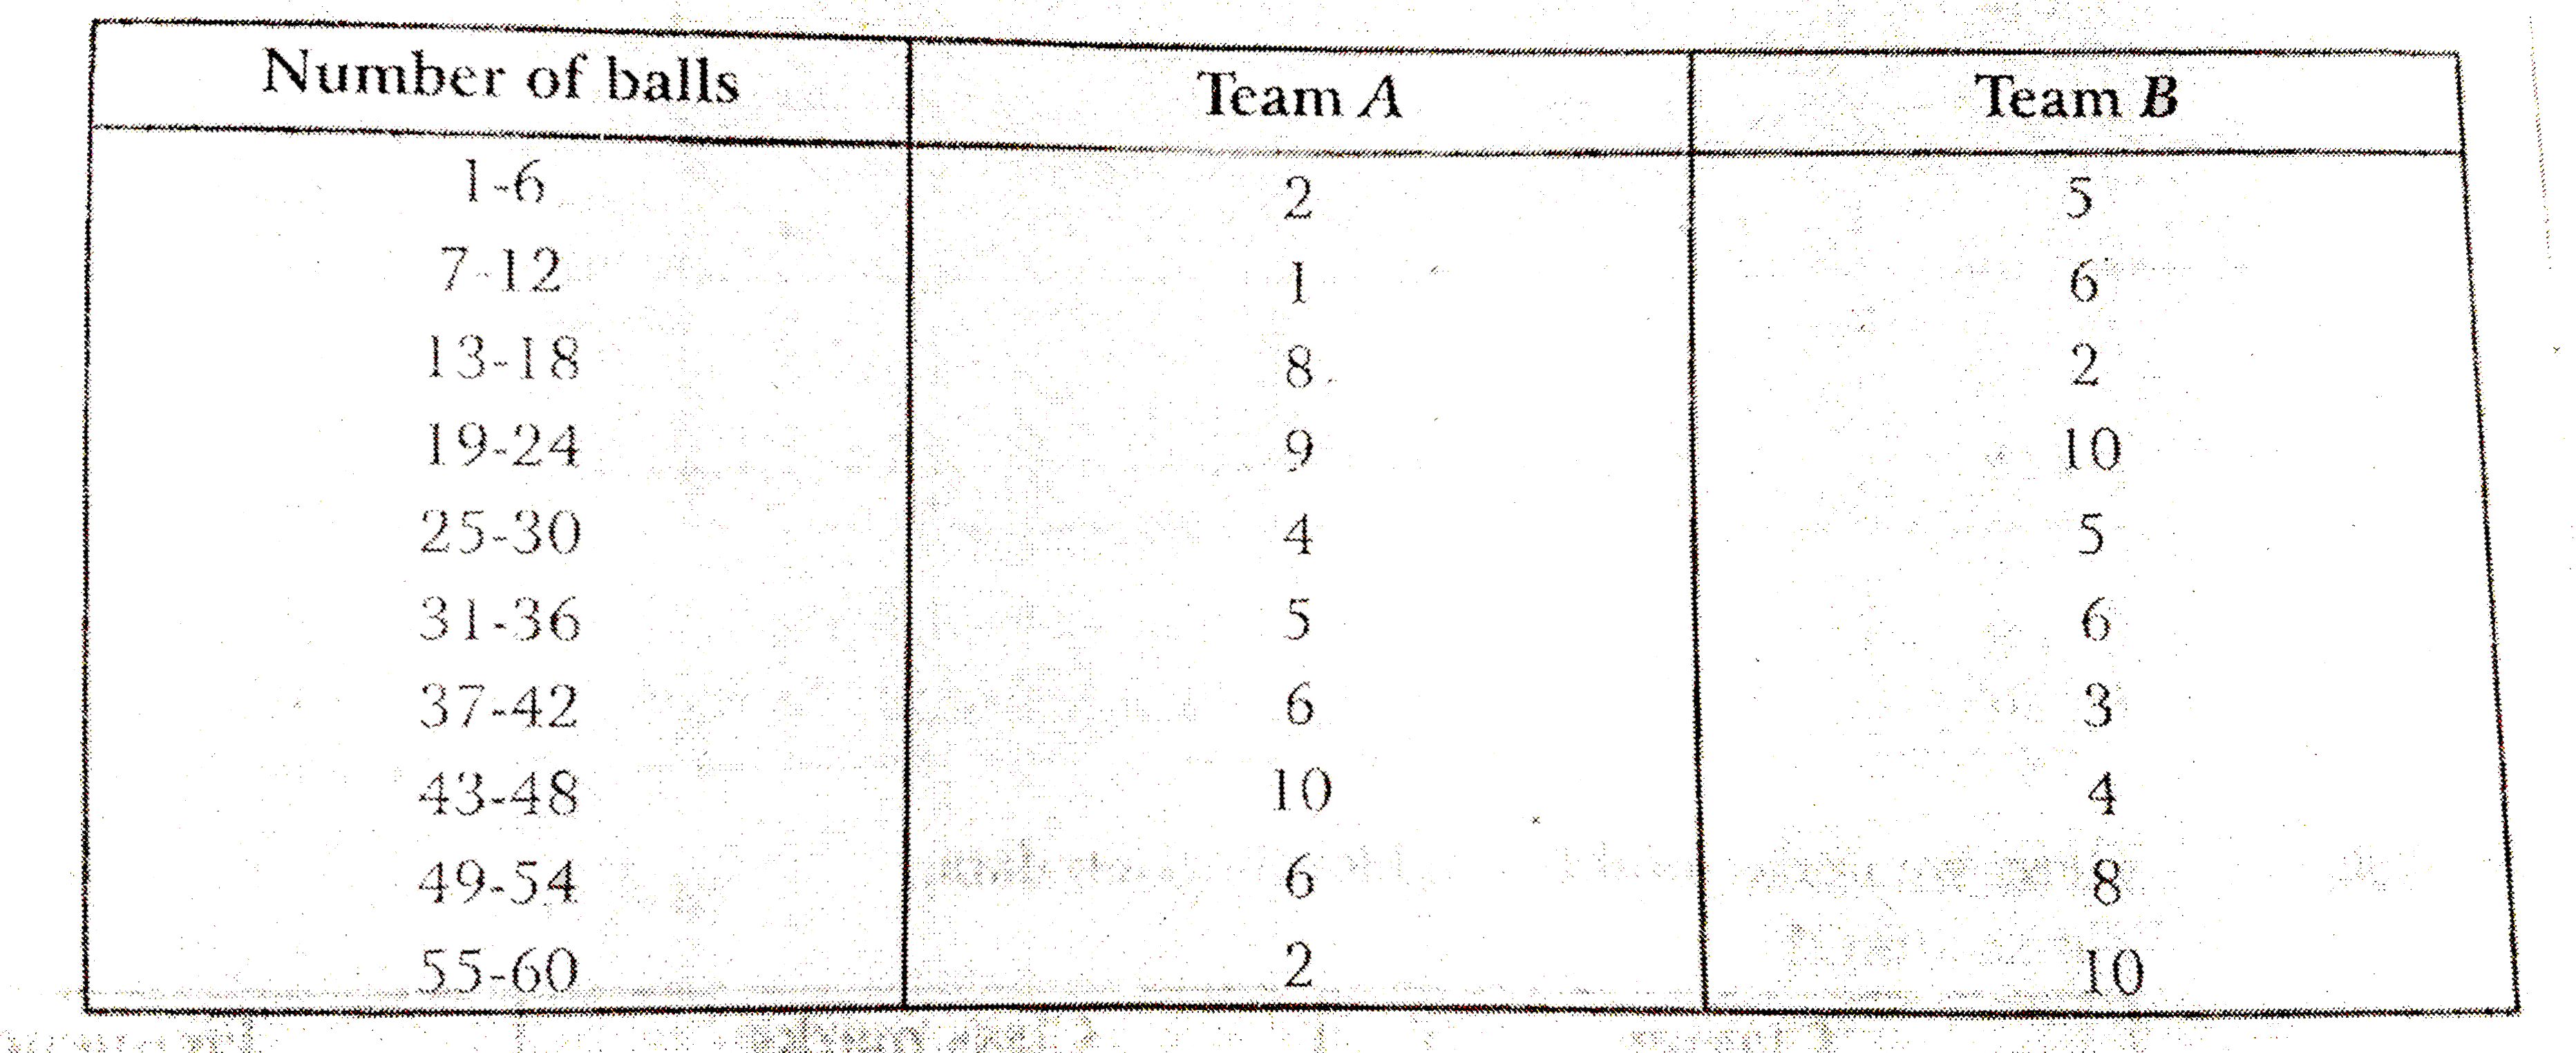
View SolutionThe runs scored by two teams A and B on the first 60 balls in a cricket match are given below:

Represent the data of both the teams on the same graph by frequency polygons.
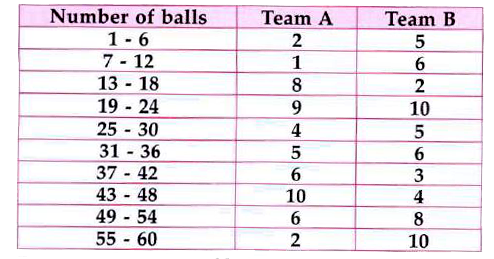
View SolutionThe runs scored by two teams A and B on the first 60 balls in a cricket match are given below:

Represent the data of both the teams on the same graph by frequency polygons. [Hint: First make the class intervals continuous]
View SolutionThe marks scored by students in Mathematics in a certain examinations are given below:

Draw histogram for the above data.
View Solution
