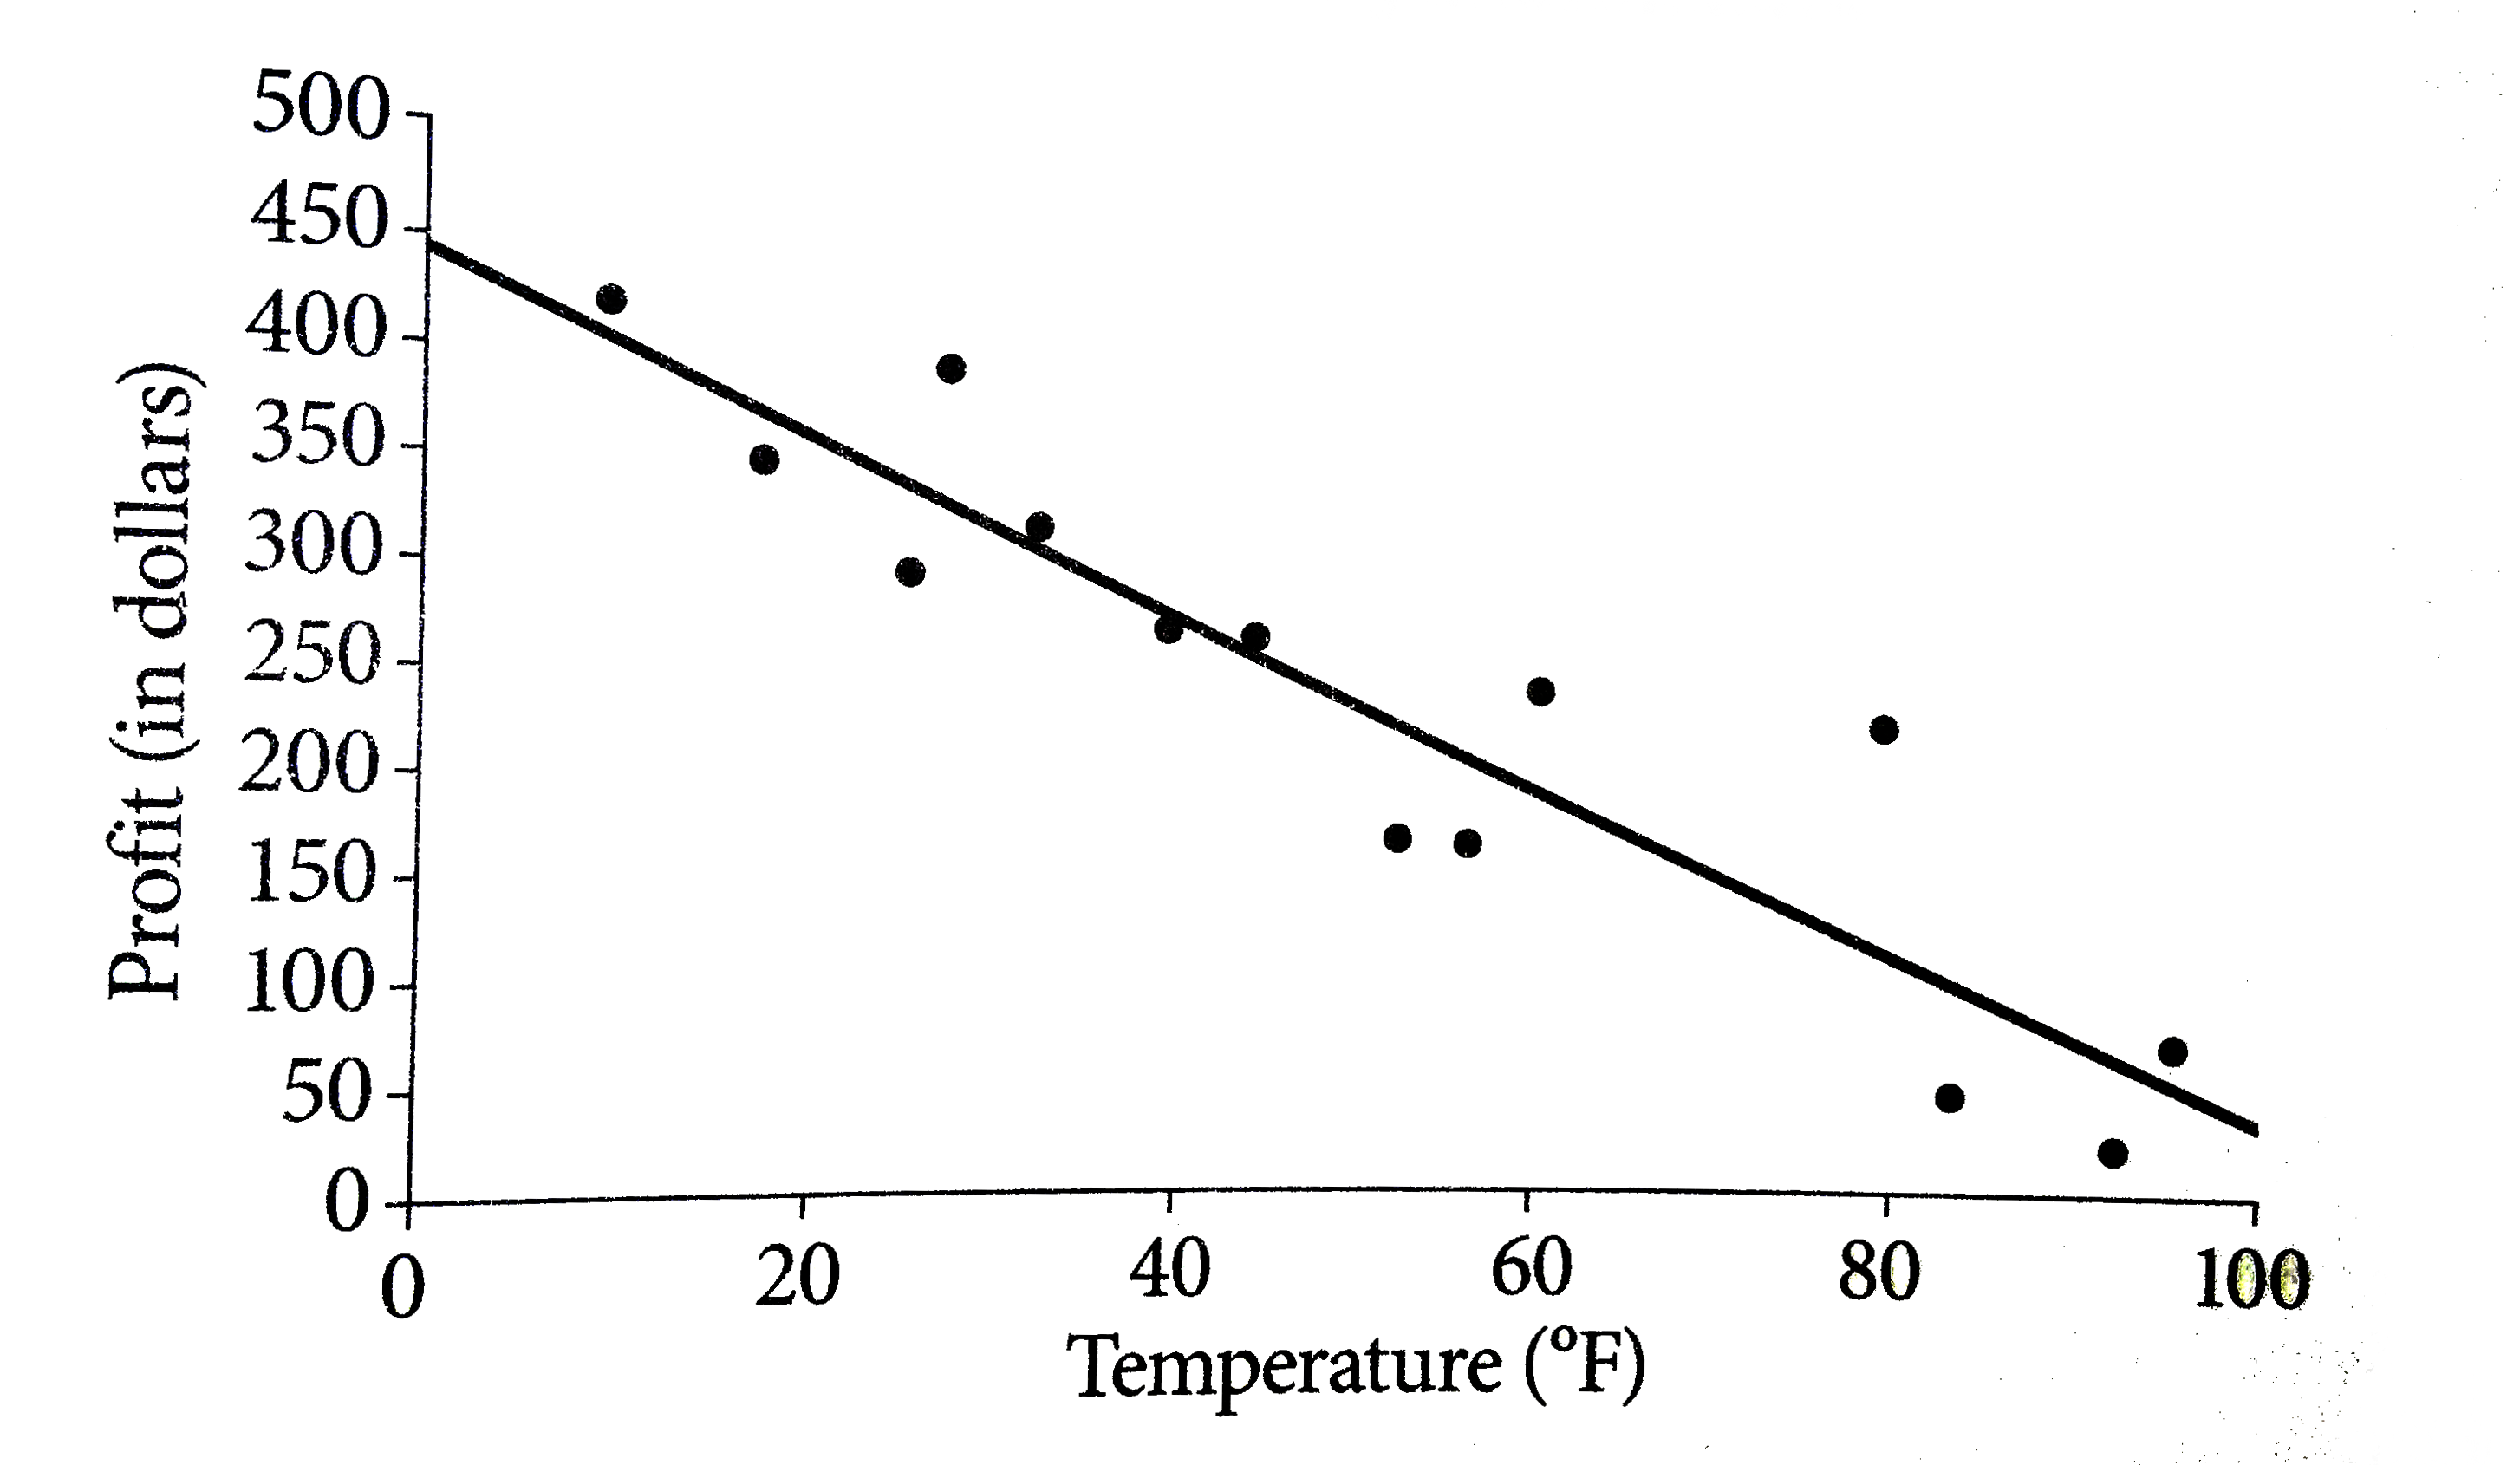
The scatterplot above shows the daily profit made by a school store from selling sweatshirts and the average daily temperature for several days in the year 2004. The line of best fit is also shown and has equation y=-4.1x+446. Which of the following best explains hoow the number −4.1 in the equation relates to the scatterplot?
For every 1∘ increase in average daily temperature, the school store's profit fell by approximately $4.10/
For every 1∘ increase in average daily temperature, the school store's profit fell by approximately $4.10/
For every 4.1∘ increase in average daily temperature, the school store's profit fell by approximately $4.10/
For every 4.1∘ increase in average daily temperature, the school store's profit fell by approximately $4.10/
The correct Answer is:A
Topper's Solved these Questions
- PROBLEM SETSBOOK - PRINCETONCHAPTER - PROBLEM SETSEXERCISE - PROBLEM SET 9: EXPONENTS, ROOTS, AND EQUATIONS
11 Videos
- PROBLEM SETSBOOK - PRINCETONCHAPTER - PROBLEM SETSEXERCISE - PROBLEM SET 10: LINES, ANGLES, AND COORDINATES
11 Videos
- PROBLEM SETSBOOK - PRINCETONCHAPTER - PROBLEM SETSEXERCISE - PROBLEM SET 7: AVERAGES, RATIOS, PROPORTIONS, AND PROBABILITIES
11 Videos
- PRACTICE TEST 4BOOK - PRINCETONCHAPTER - PRACTICE TEST 4EXERCISE - Math Test-Calculator
38 Videos
- SAT MATH: THE BIG PICTUREBOOK - PRINCETONCHAPTER - SAT MATH: THE BIG PICTUREEXERCISE - Example
4 Videos
Similar Questions
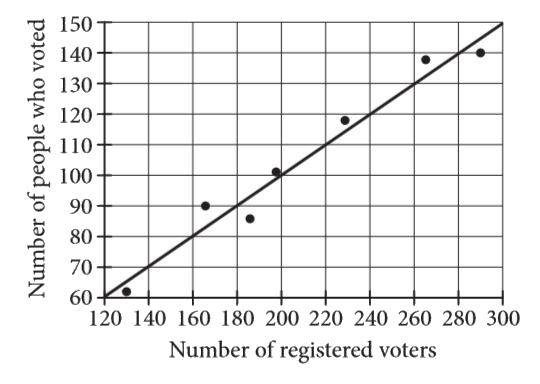
The scatterplot above shows the number of registered voters, x, and the number of people who voted in the last election, y, for seven districts in a town. A line of best fit for the data is also shown. Which of the following could be the equation of the line of best fit?
View Solution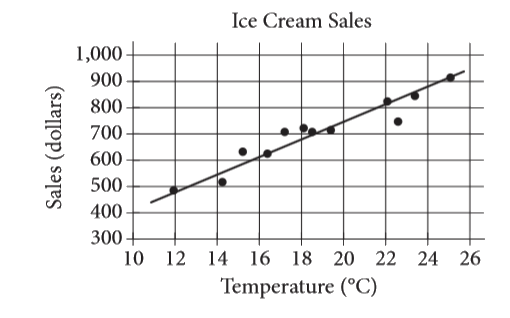
The scatterplot above shows a company’s ice cream sales d, in dollars, and the high temperature t, in degrees Celsius (.∘C), on 12 different days. A line of best fit for the data is also shown. Which of the following could be an equation of the line of best fit?
View Solution
Knowledge Check
The relative housing cost for a US city is defined to be the ratio average housing cost for the citynational average housing cost expressed as a percent.
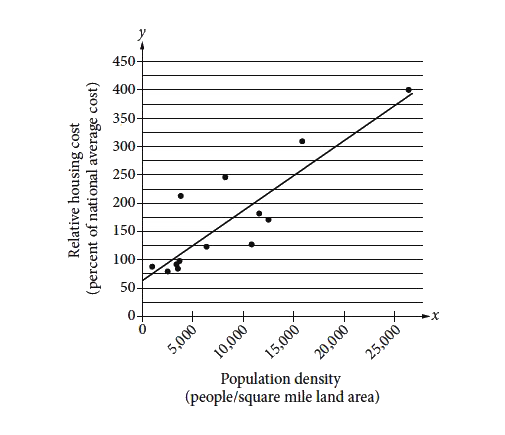
The scatterplot above shows the relative housing cost and the population density for several large US cities in the year 2005. The line of best fit is also shown and has equation y = 0.0125x + 61. Which of the following best explains how the number 61 in the equation relates to the scatterplot?AIn 2005, the lowest housing cost in the United States was about $61 per month.BIn 2005, the lowest housing cost in the United States was about 61% of the highest housing costCIn 2005, even in cities with low population densities, housing costs were never below 61% of the national average.DIn 2005, even in cities with low population densities, housing costs were likely at least 61% of the national average.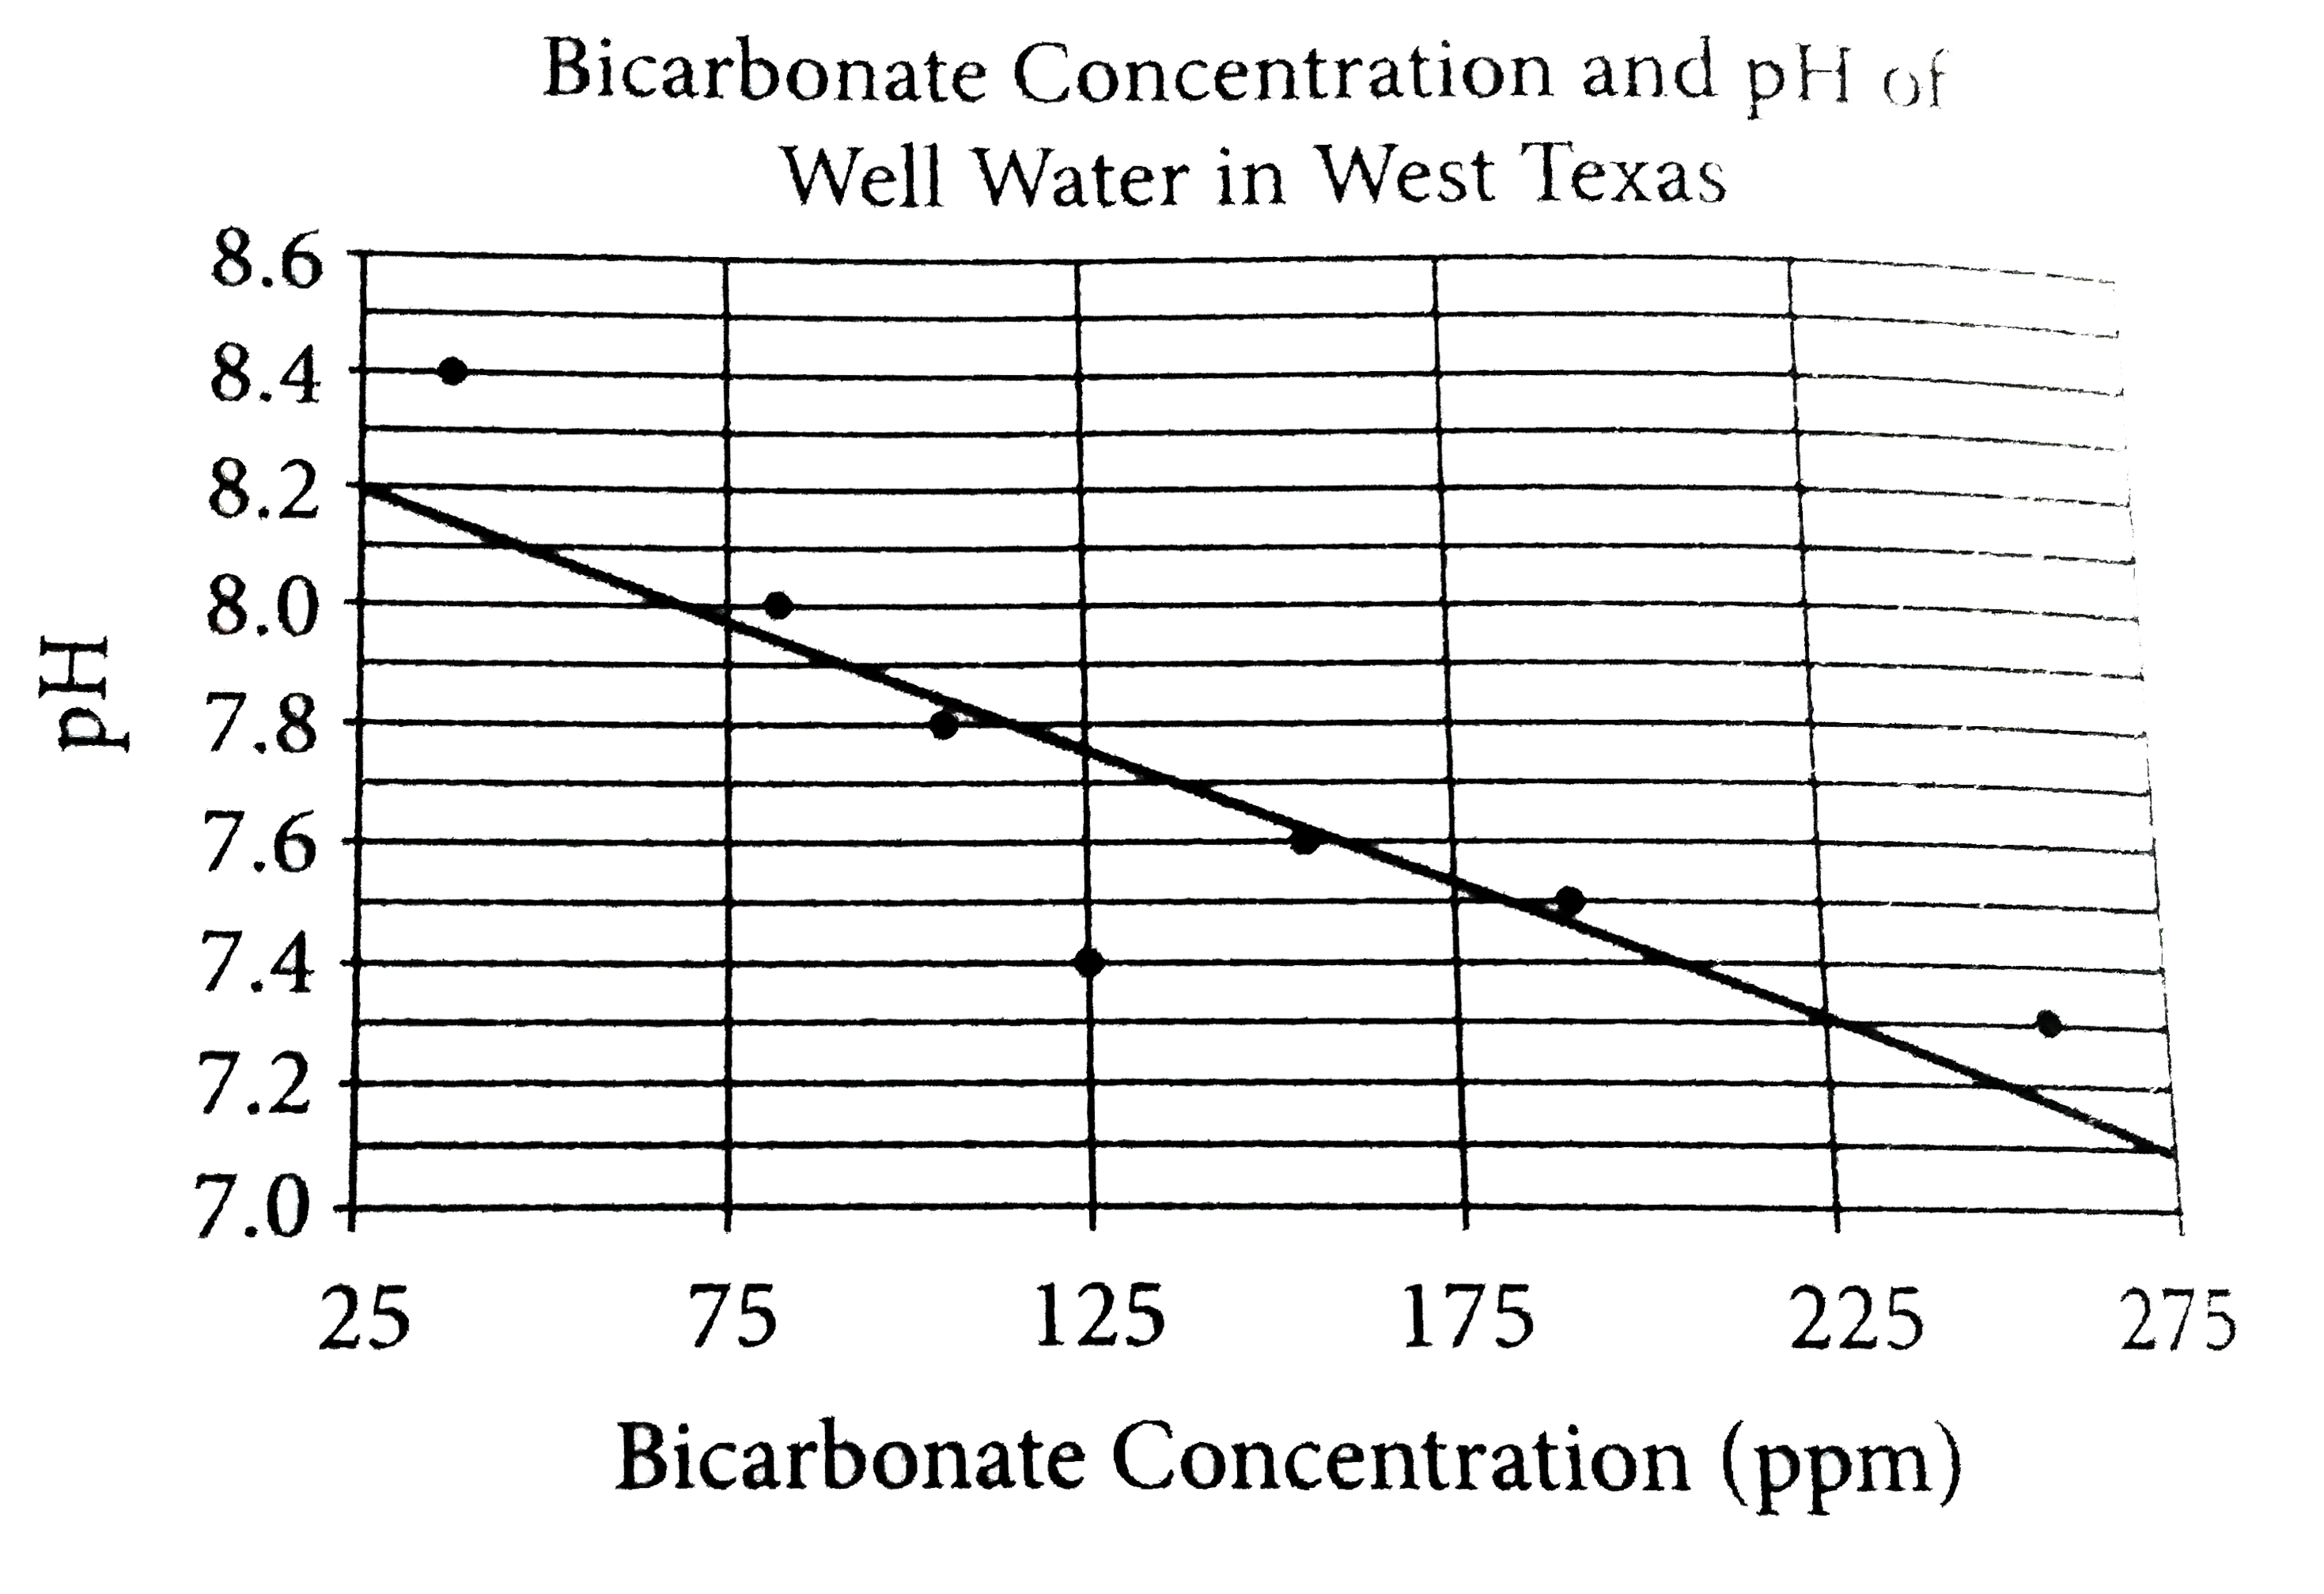
The scatterplot above shows the pH of seven well water samples in West Texas with respect to the bicarbonate concentration in ppm(parts per million). The line of best fit is also shown.
According to the scatterplot, which of the following statements about the relationship between a well's pH and its bicarbonate concentration is true?AA well with half as much bicarbonate as another well will have a pH twice that of the other wellBWells that have more bicarbonate tend to have higher pHCWells that have more bicarbonate tend to have lower pHDThe bicarbonate concentration of the well water is unrelated to its pH.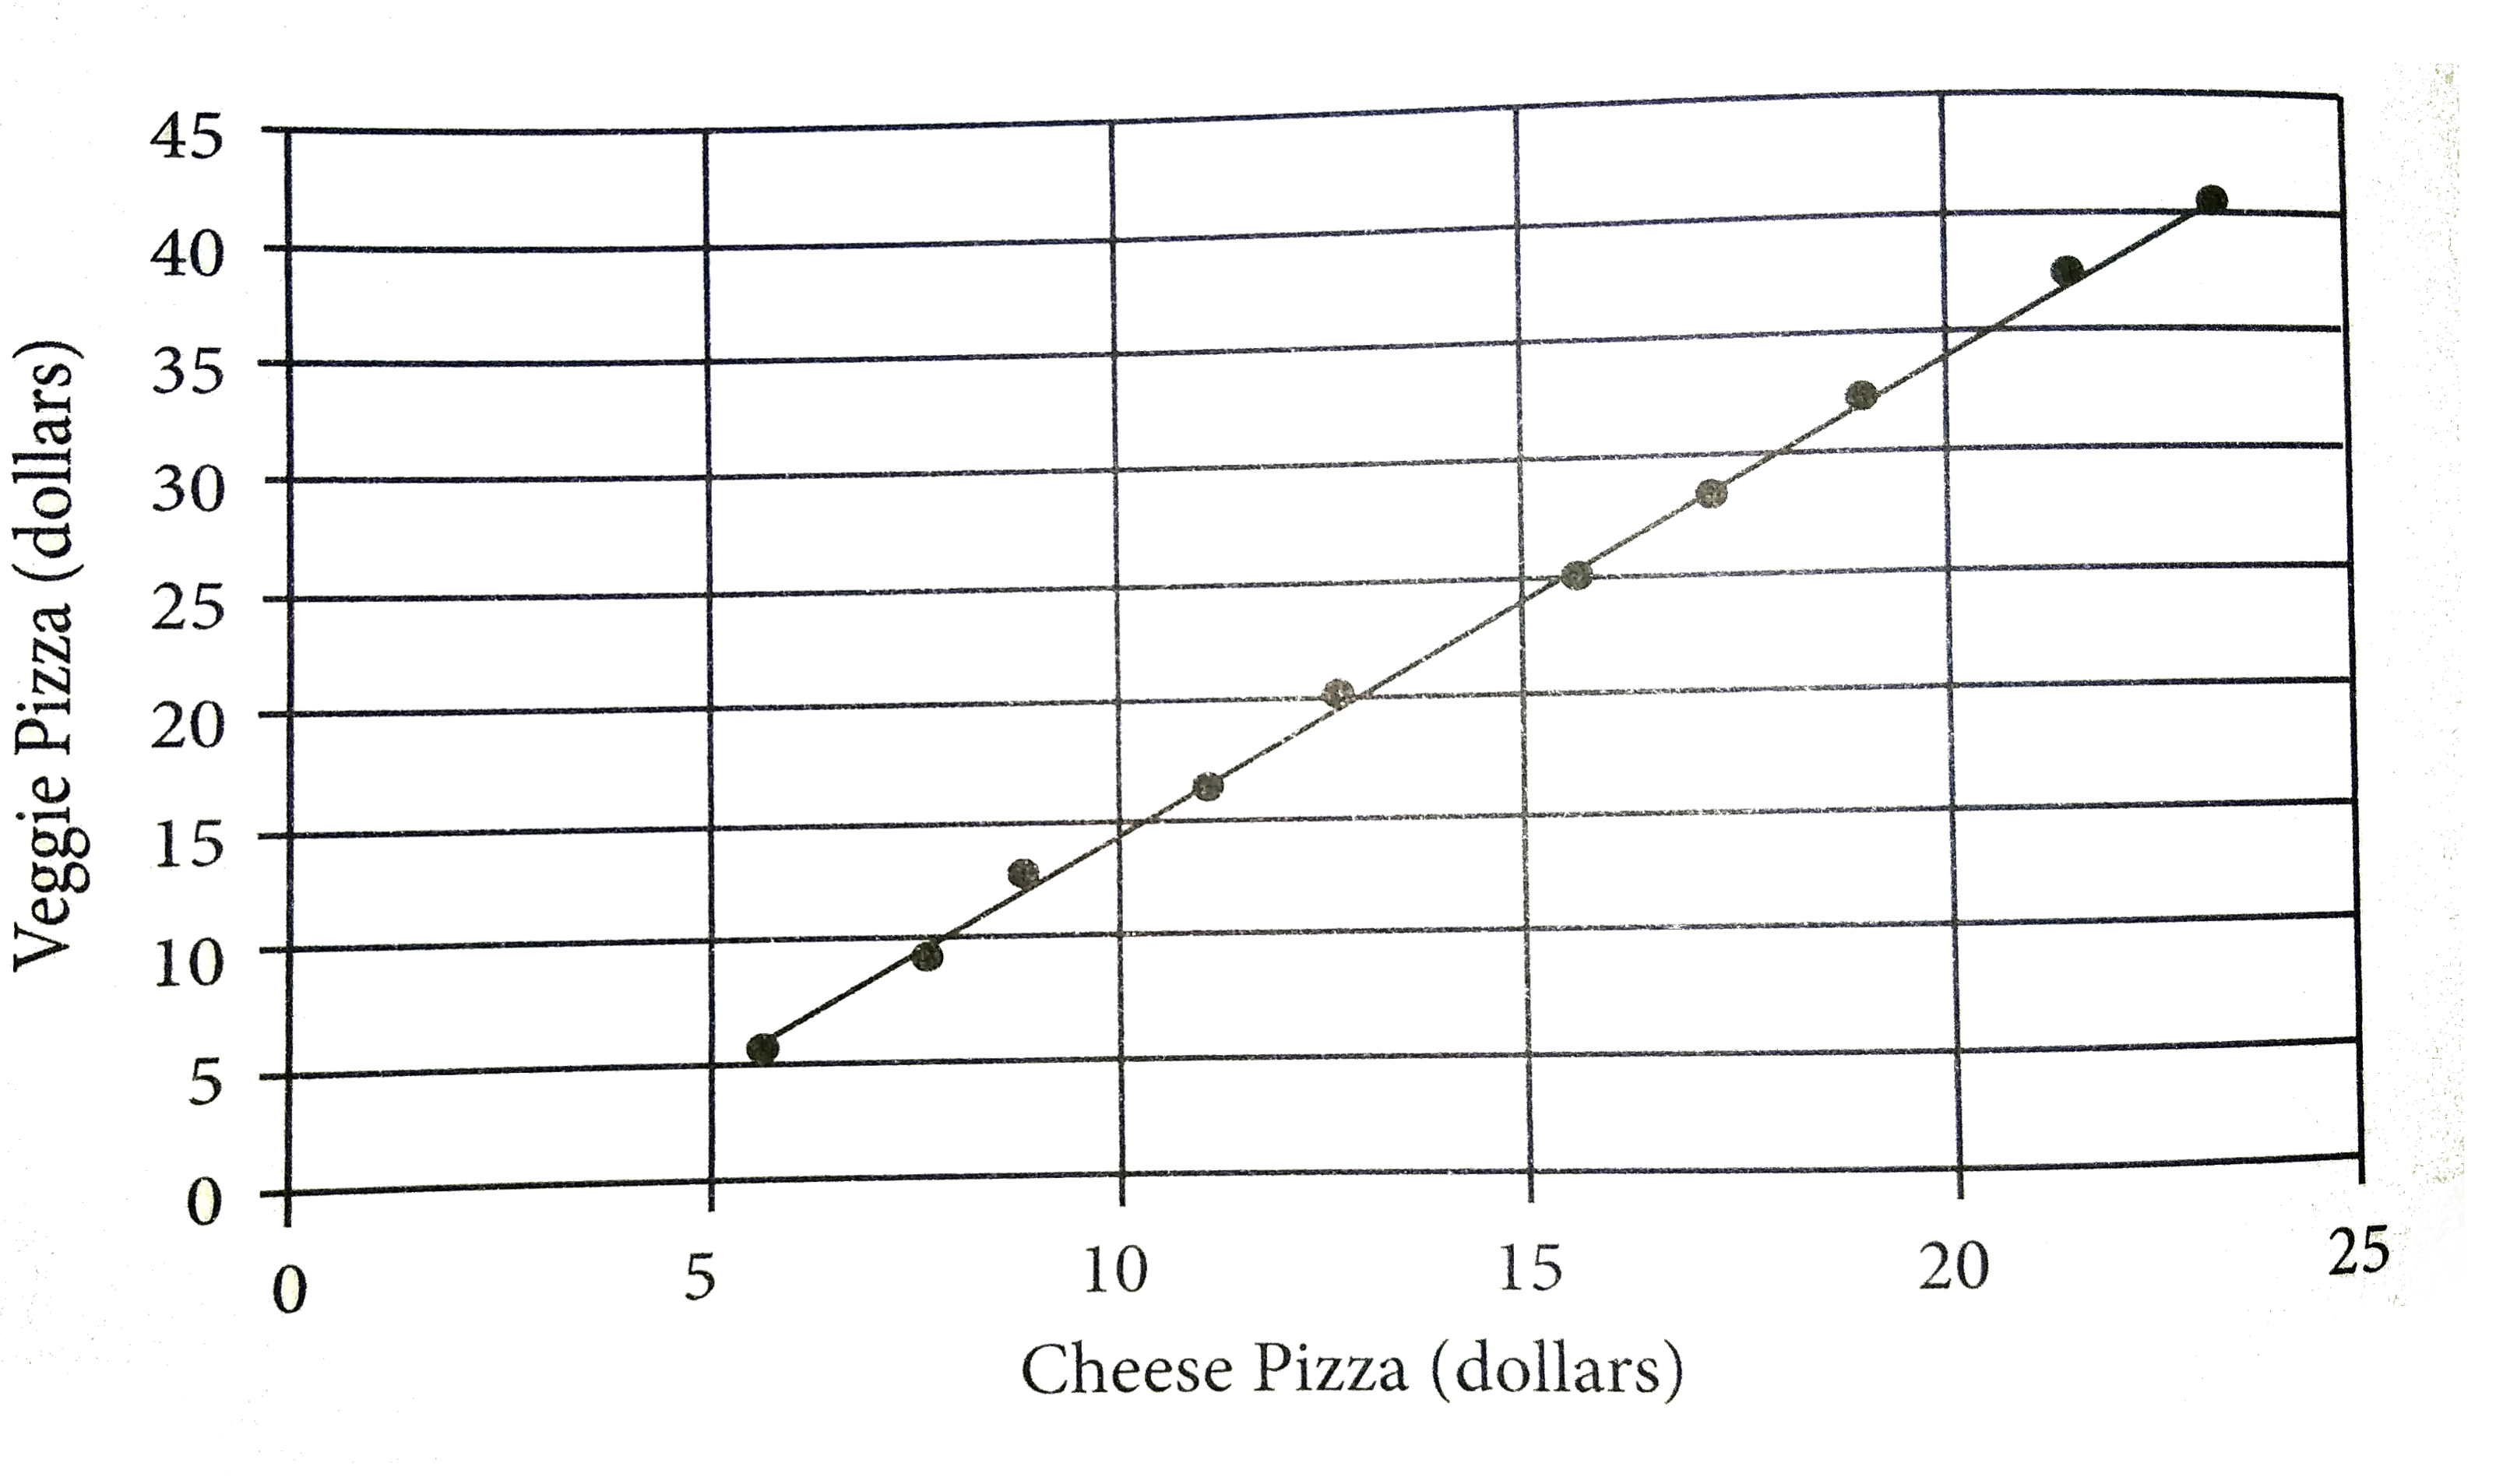
The scatterplot above shows the price, in dollars, for both cheese pizza and a veggie pizza for ten different pizzerias. The line of best fit is also shown. According to the line of best fit, which of the following is closer to the predicted increase in the price of a veggie pizza, in dollars, for every 1 dollar increase in the price of a cheese pizza?A1.5B2.0C2.5D3.0
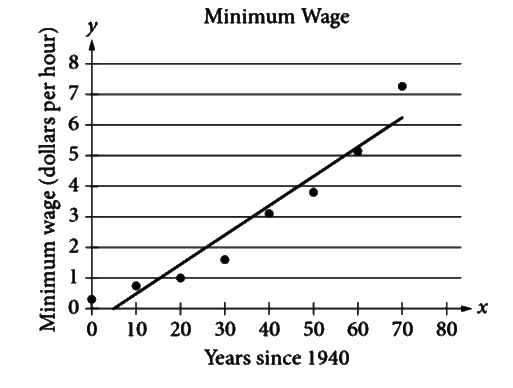
The scatterplot above shows the federal-mandated minimum wage every 10 years between 1940 and 2010. A line of best fit is shown, and its equation is y = 0.096x − 0.488.What does the line of best fit predict about the increase in the minimum wage over the 70-year period?
View SolutionStudent in a finance class surveyed 20 percent of the account holders at Docven Bank to determine whether the bank's "Stock Market Special" savings account actually paid account holders the promised 10 percent annual interest rate. The scatterplot above shows the data the students collected from account holders about how long ago they opened their accounts and their current balances. The students calculated a lone of best fit with the equation y=120(1+.0812)12x, whihc means that the bank was actually paying account holders only an 8 percent annual interest rate. Which of the following best explains how the number 120 in the equation relates to the scatterplot?
View Solution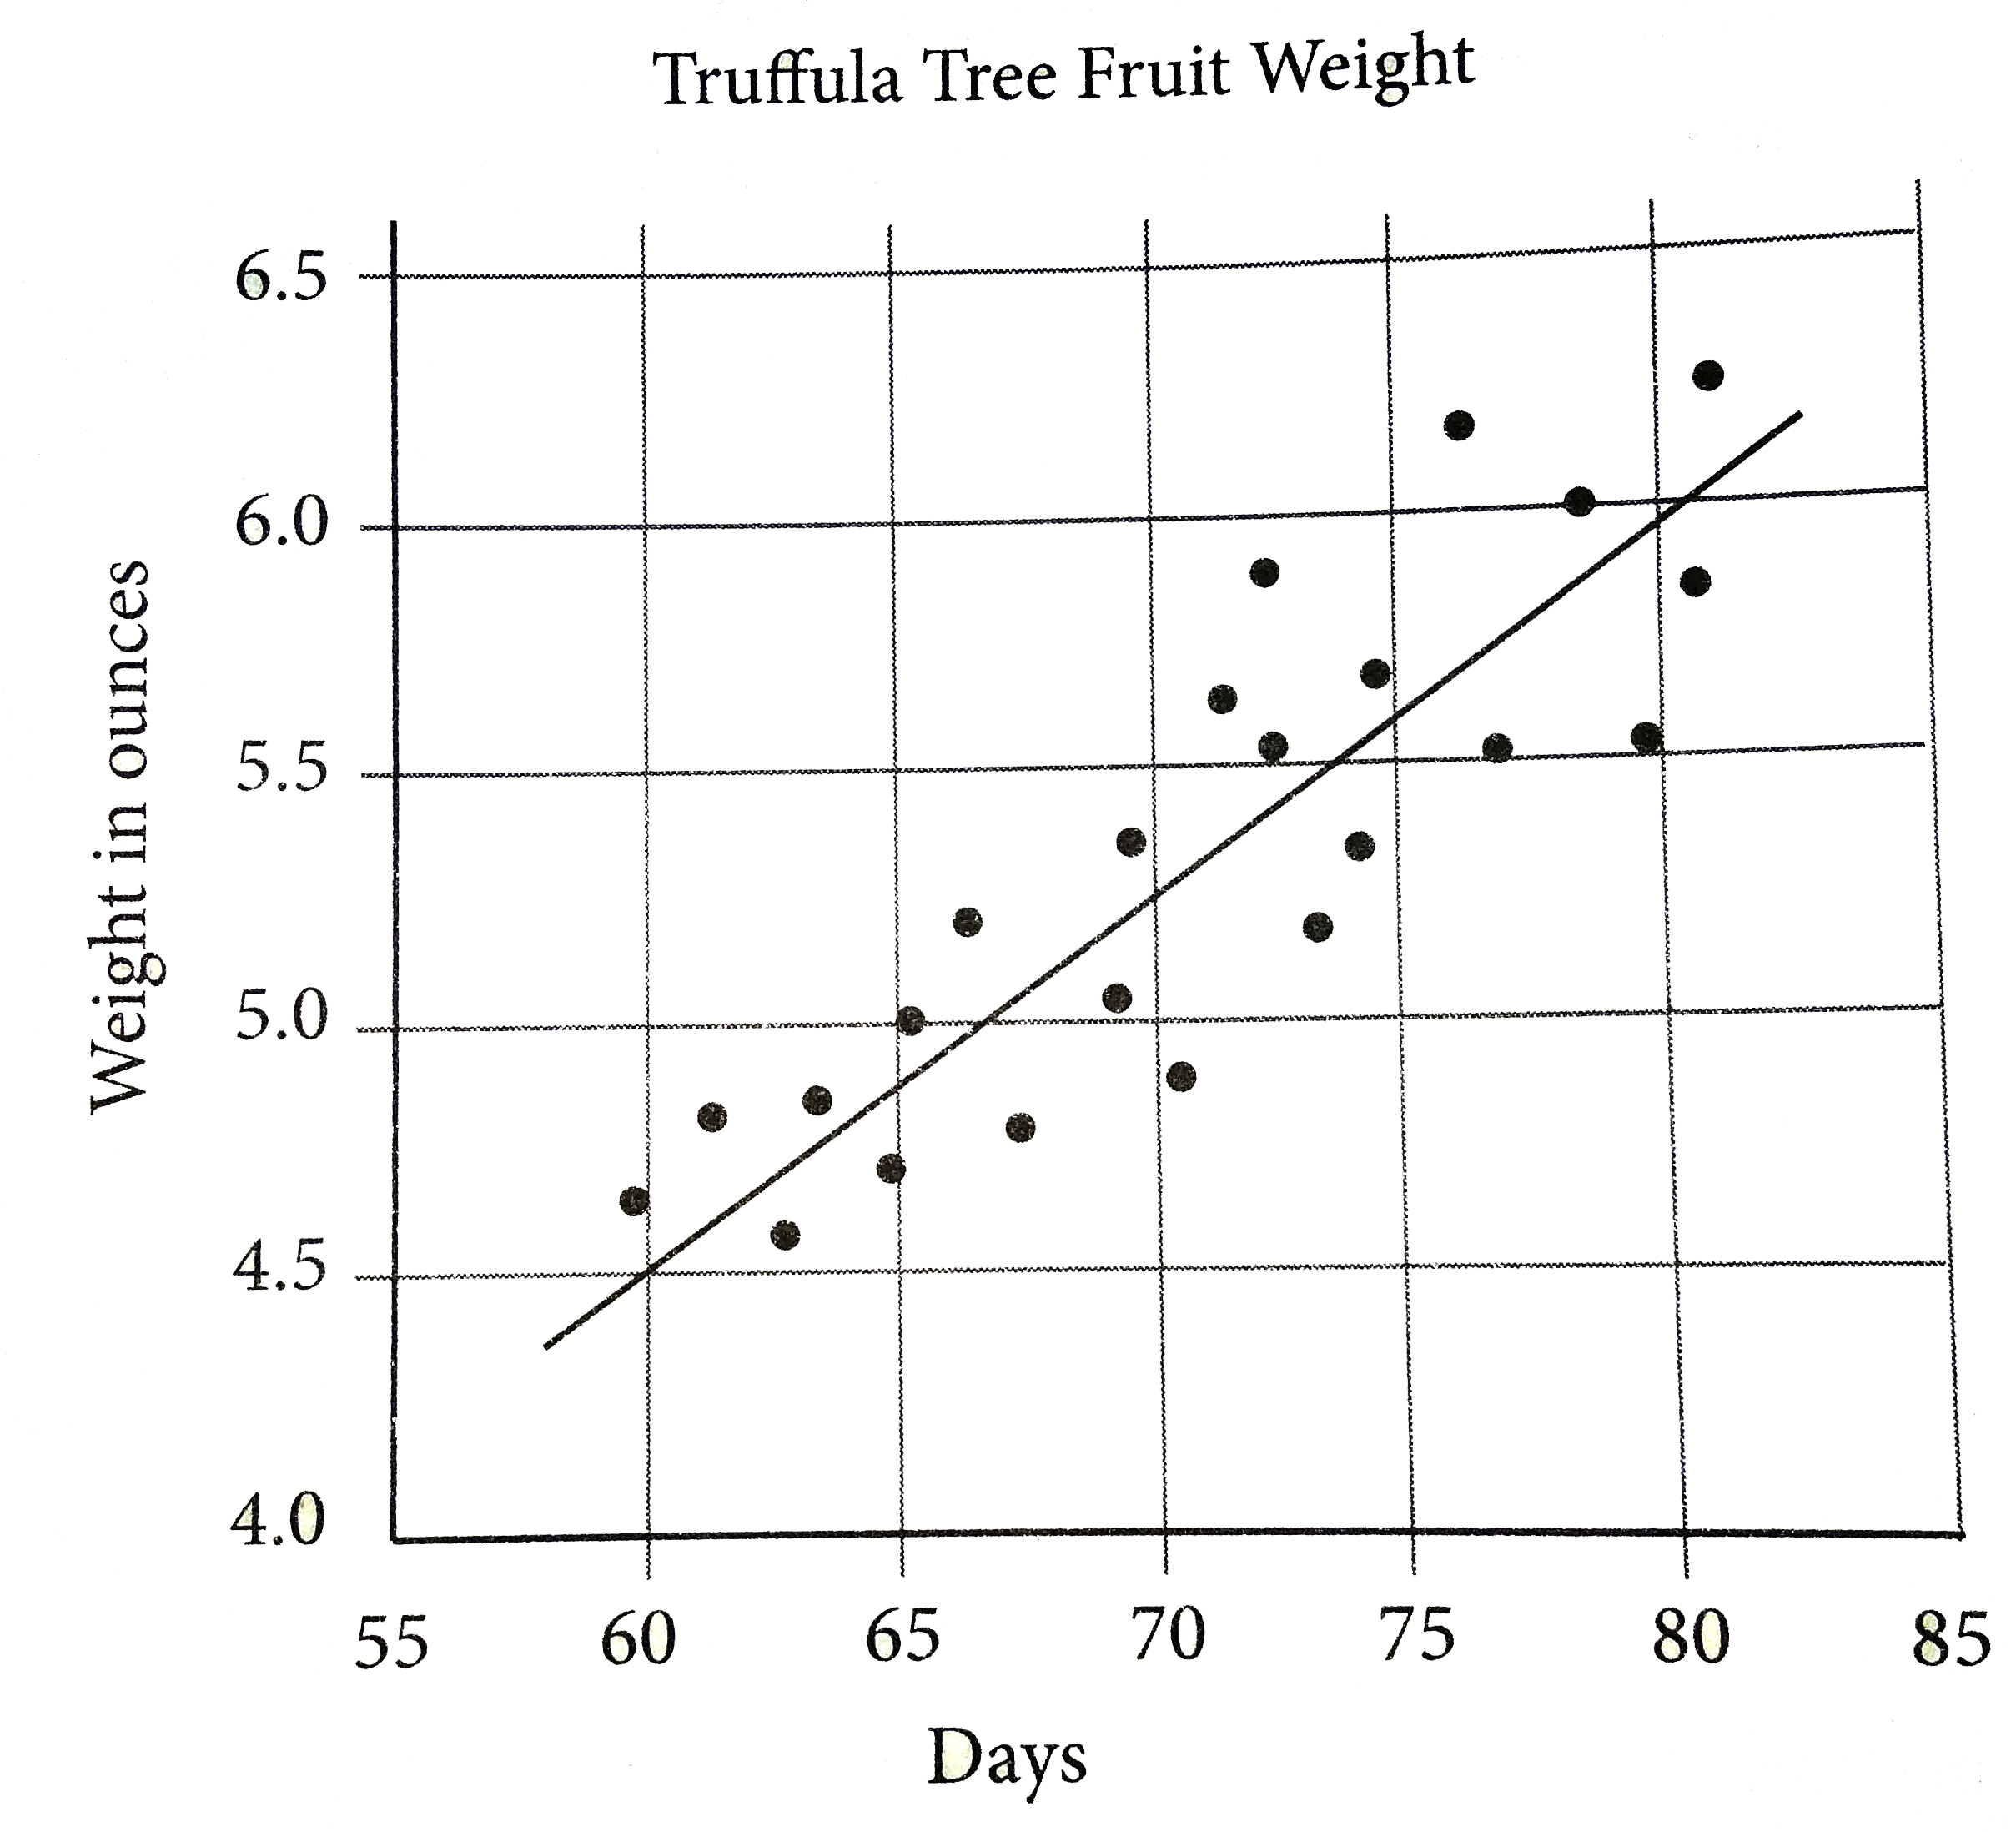
The scatterplot above shows the weight, in ounces,of the fruits on a certain truffula tree from days 55 to 85 after flowering. According to the line of best fit in the scatterplot above, which of the following is the closest approximation of the number of days after flowering of a truffula fruit that weighs 5.75 ounces?
View Solution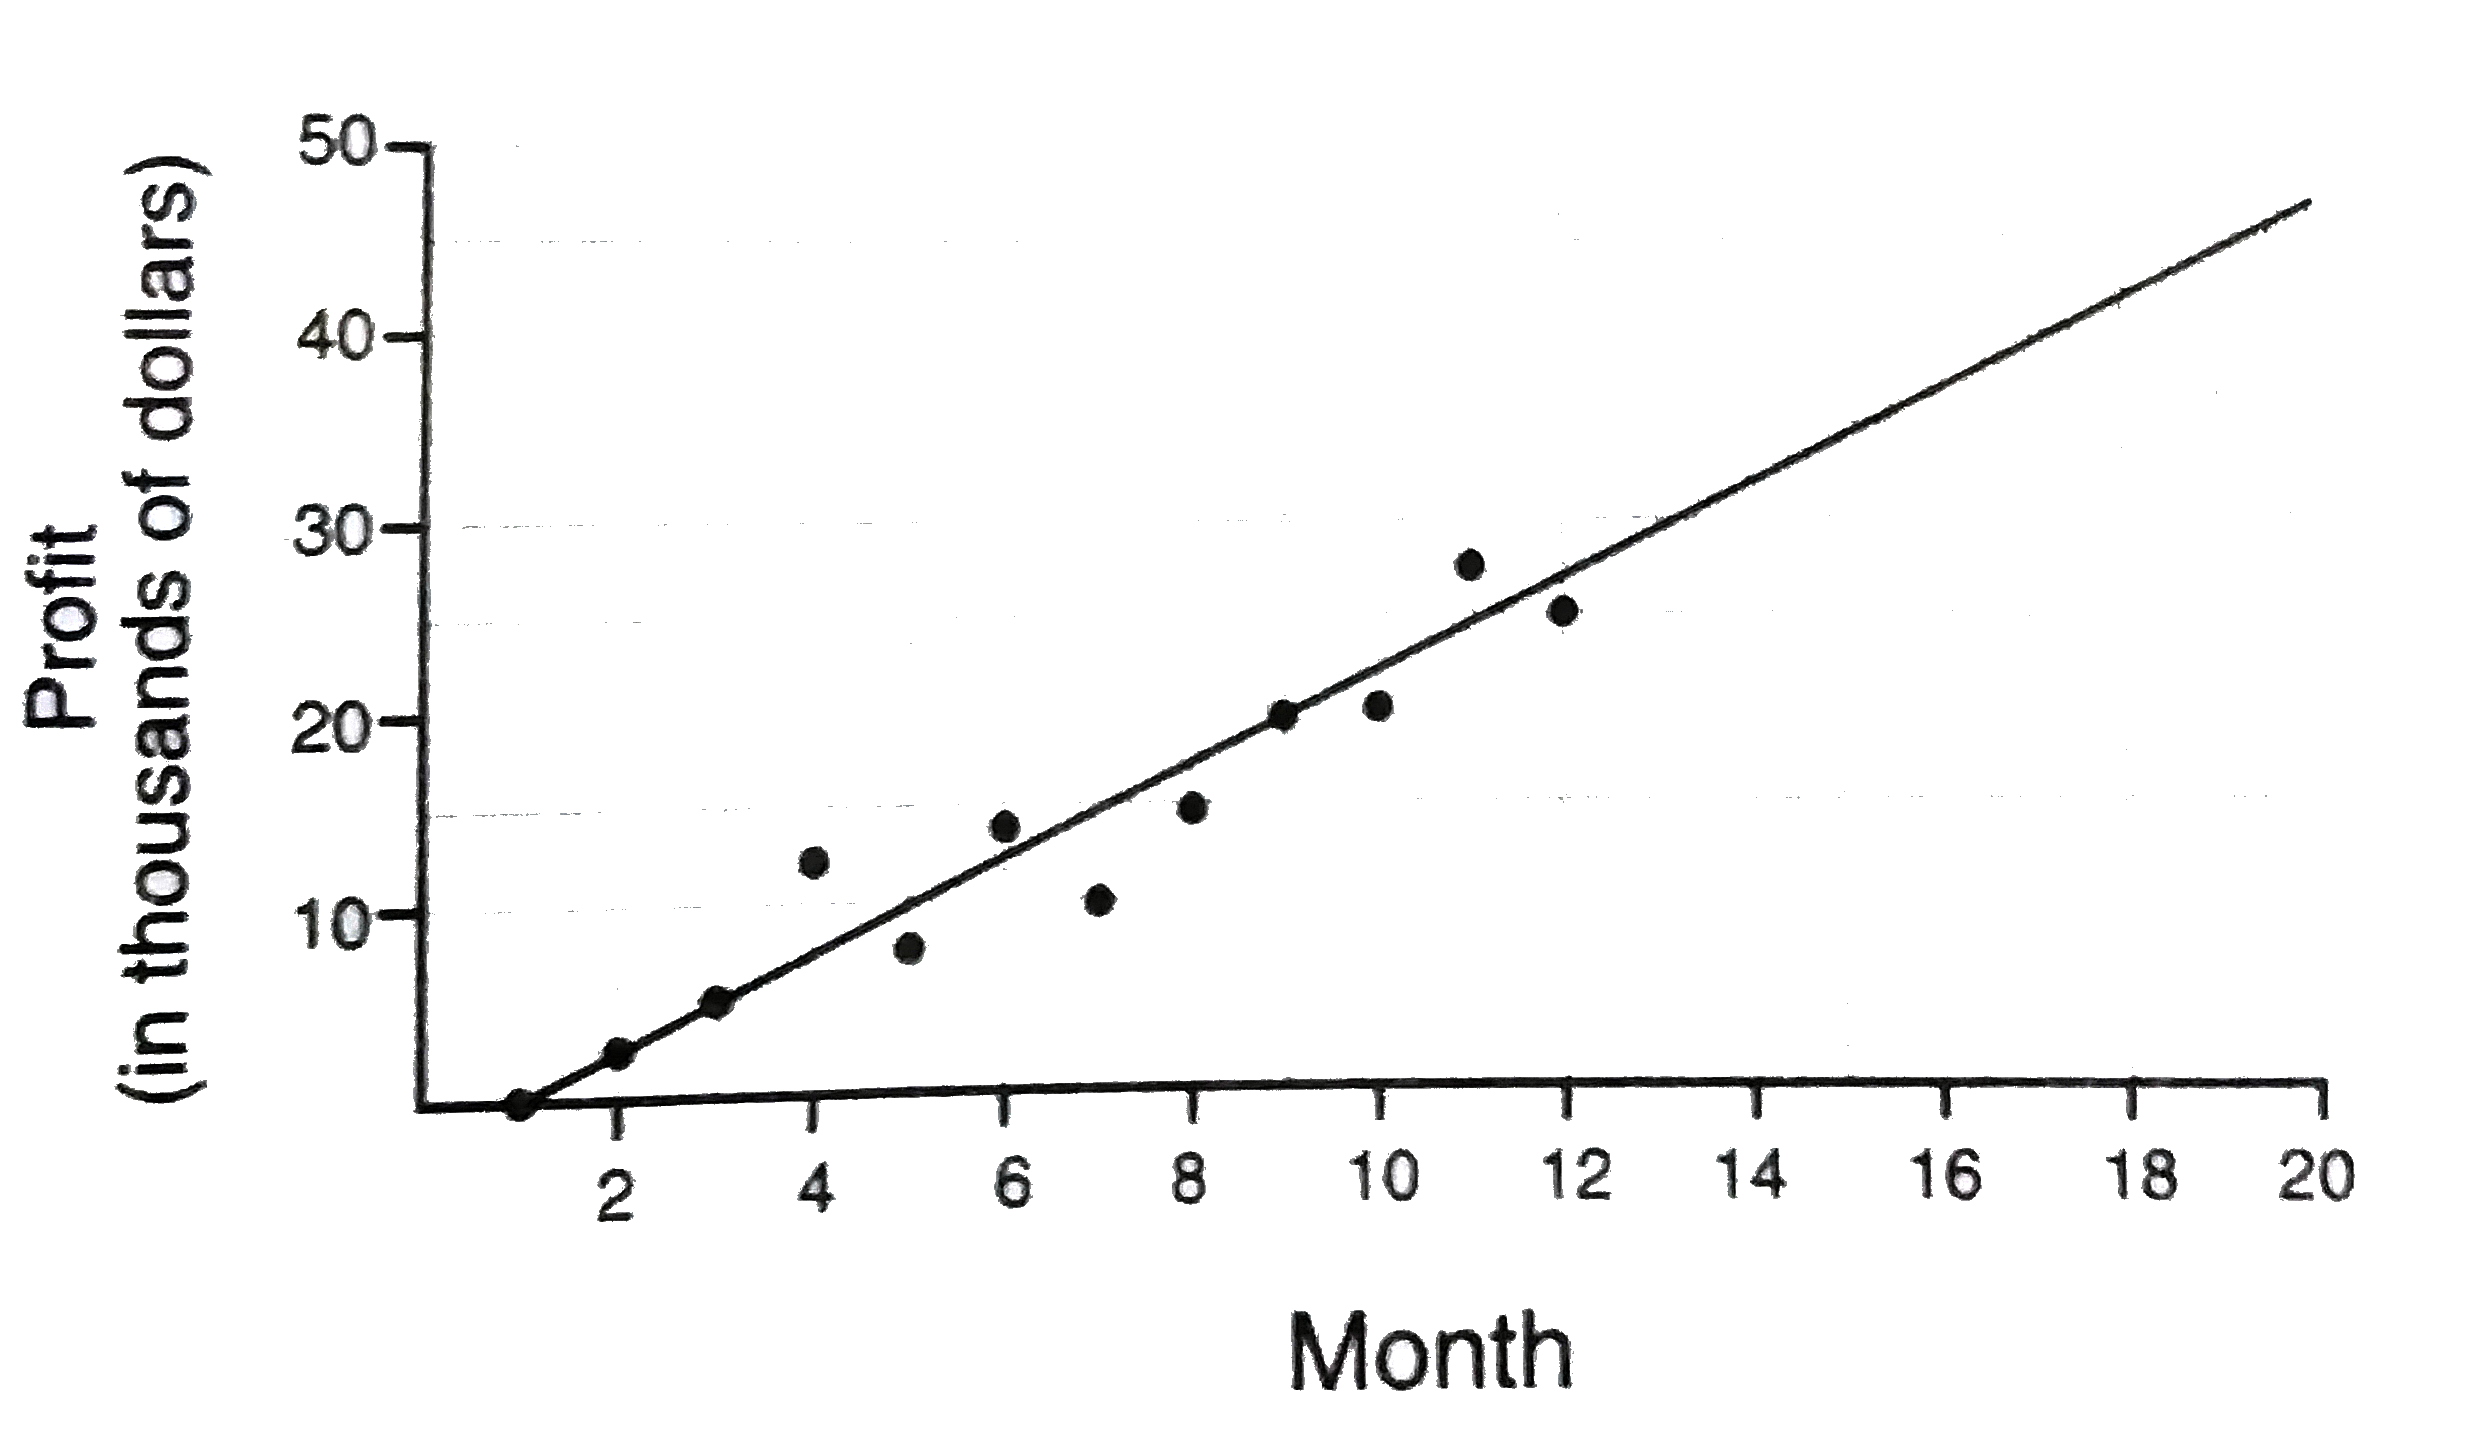
The scatterplot above shows the profit, by month, for a new company for the first year of operation. A line of best fit is also shown. Using this line, by what dollar amount did the profit in the 8th month exceed the profit in the 13th month?
View Solution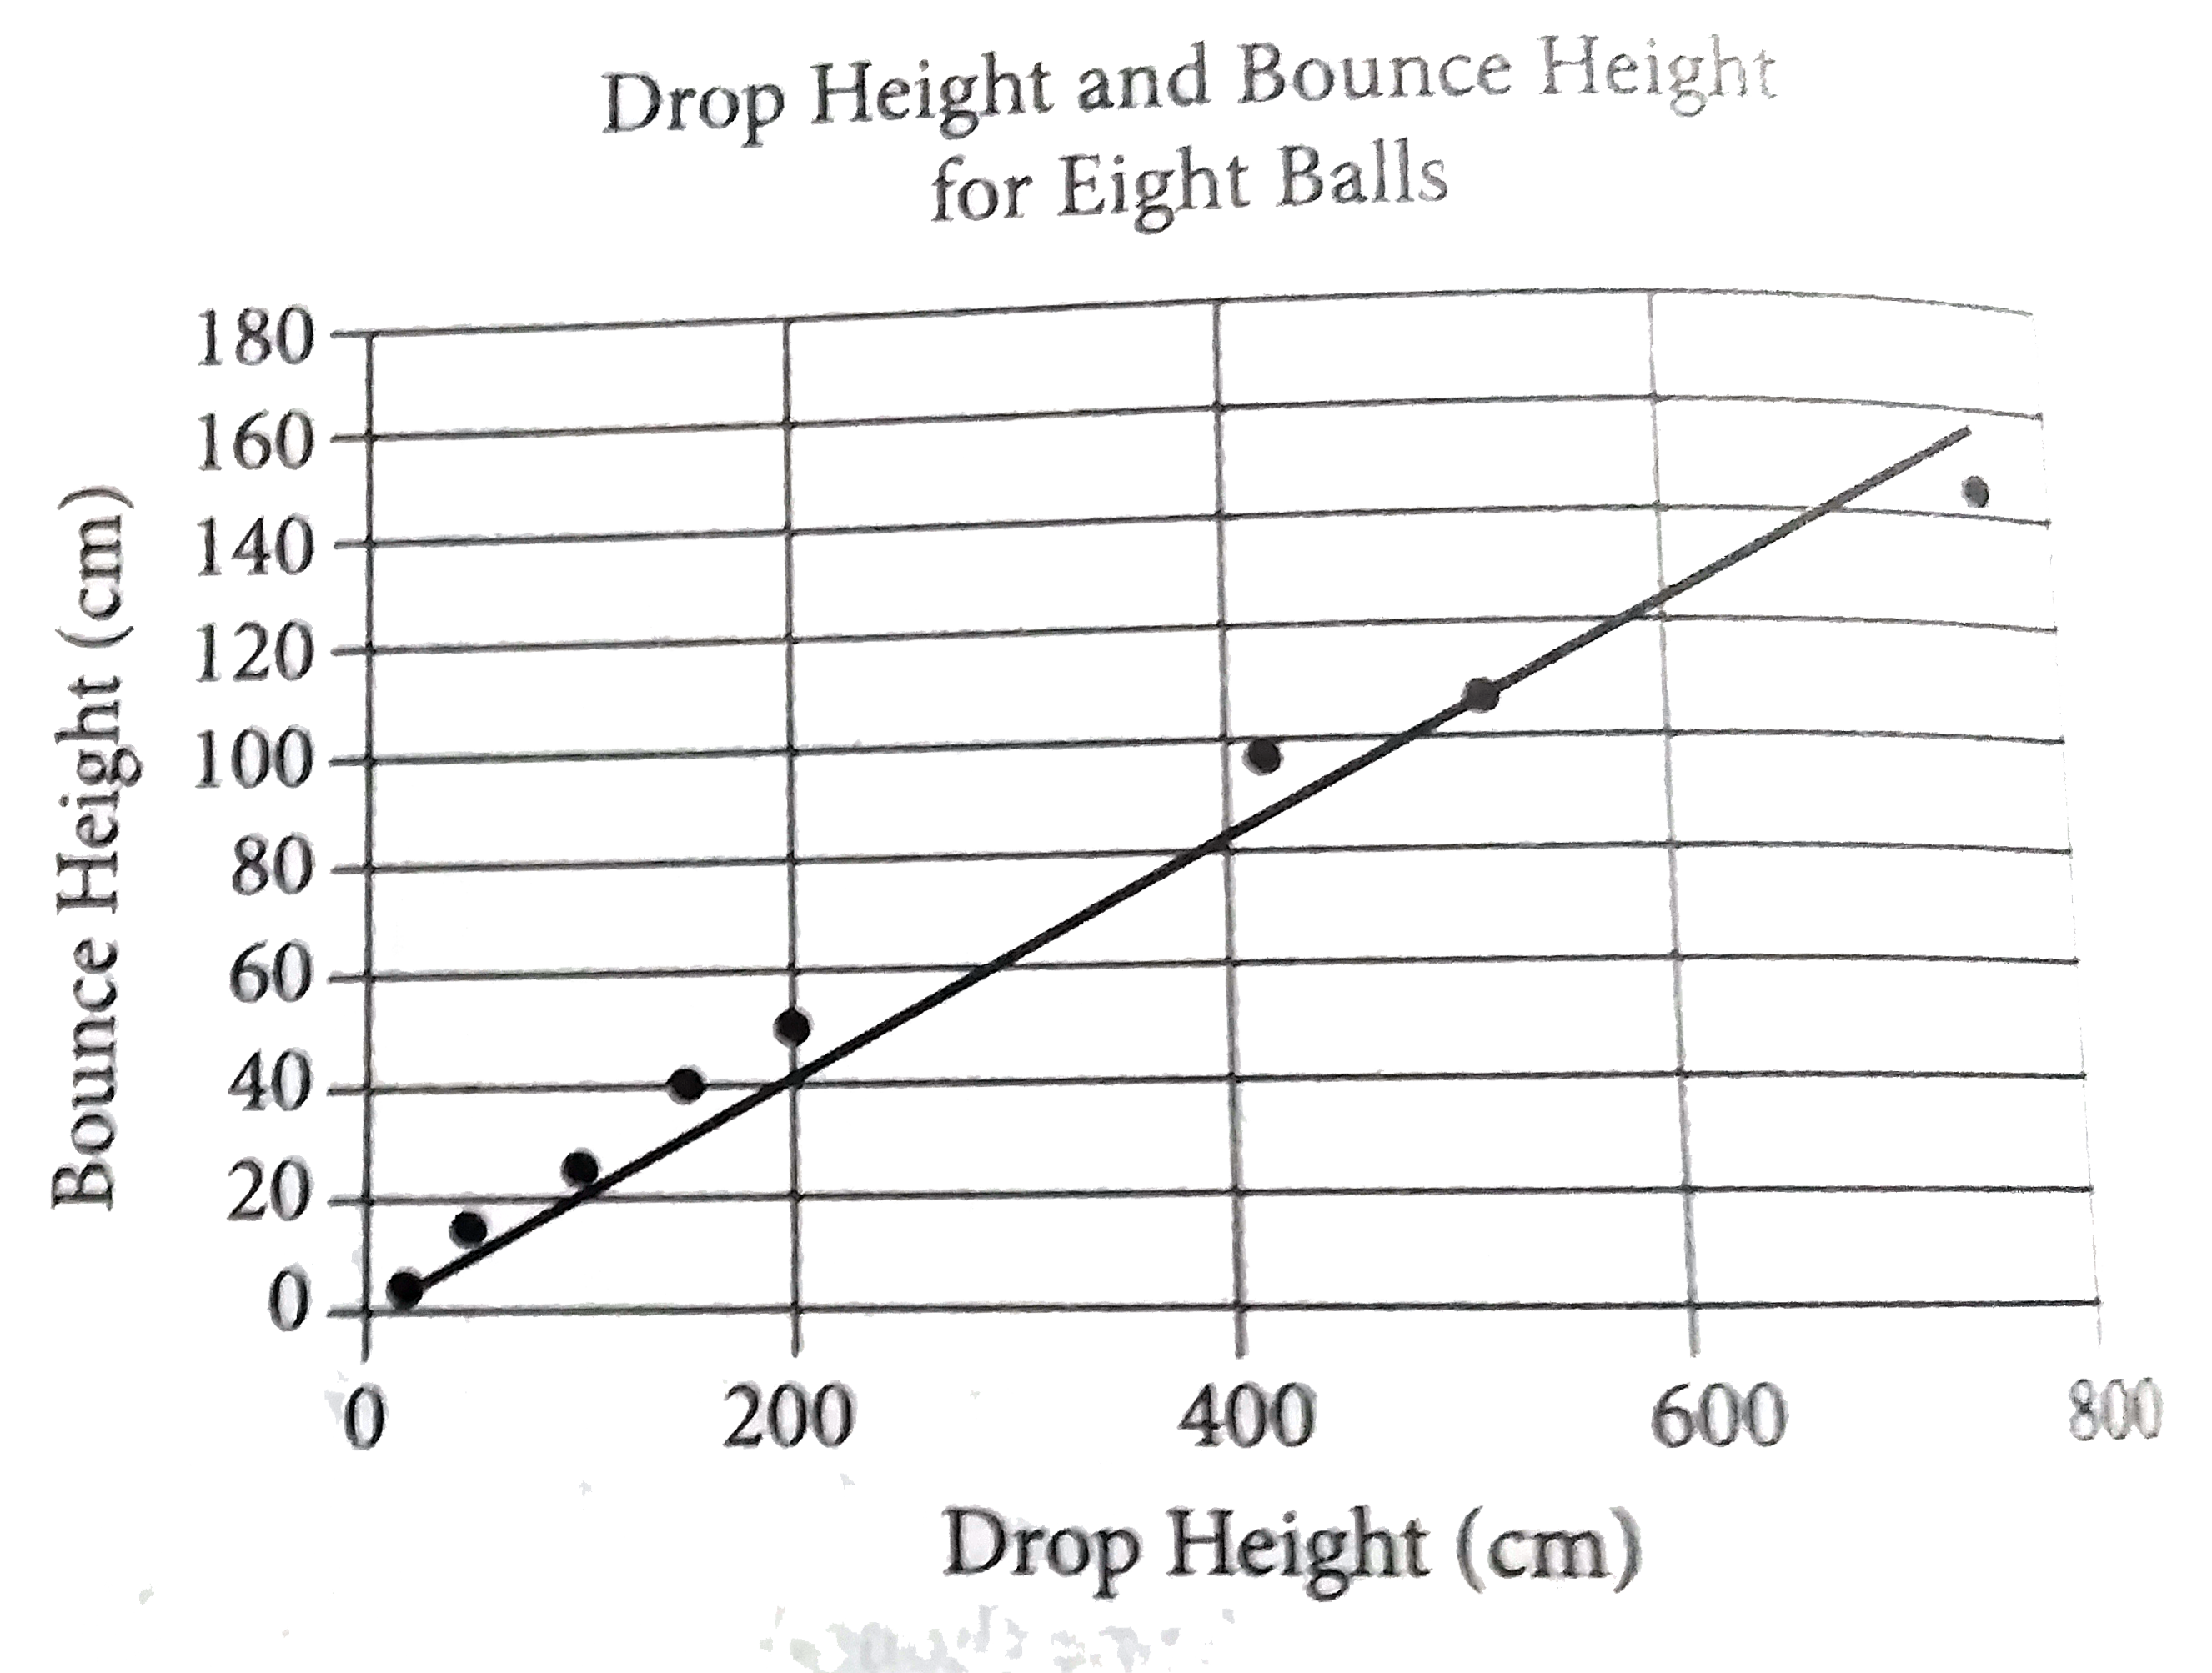
The scatterplot above shows the height in centimeters for both the drop and bounce of eight different balls of the same type. The line of best fit for the data is also shown. According to the lines of best fit, which of the following is closest to the predicted increase in bounce height, in centimeters, for every increase of 100 centimeters in drop height?
View Solution
