This bar graph shows the temperatures in degree Celsius in different cities on a certain day in February. Observe the graph and answer the questions :
What data is shown on the vertical and the horizontal lines ?
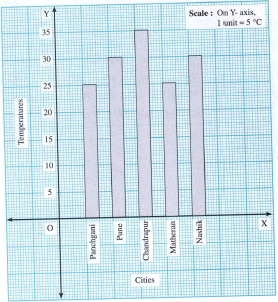
The temperatures of the cities are shown on the vertical line. Names of the cities are shown on the horizontal line
Topper's Solved these Questions
Similar Questions
This bar graph shows the temperatures in degree Celsius in different cities on a certain day in February. Observe the graph and answer the questions :
Which city had the highest temperature ?
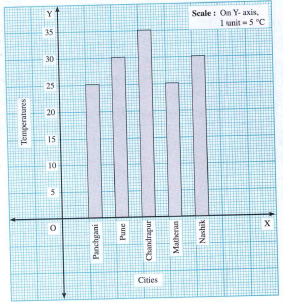
View SolutionThis bar graph shows the temperatures in degree Celsius in different cities on a certain day in February. Observe the graph and answer the questions :
Which cities had equal maximum temperatures ?
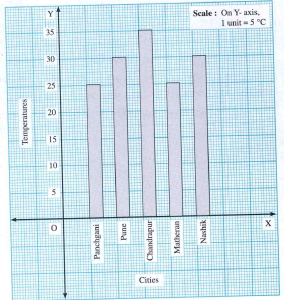
View SolutionThis bar graph shows the temperatures in degree Celsius in different cities on a certain day in February. Observe the graph and answer the questions :
Which cities had a maximum temperature of 30∘C ?
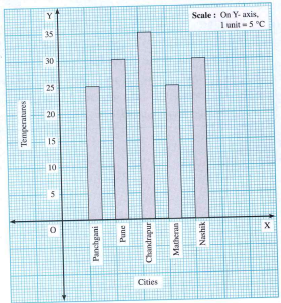
View SolutionThis bar graph shows the temperatures in degree Celsius in different cities on a certain day in February. Observe the graph and answer the questions :
What is the difference between the maximum temperatures of Panchgani and Chandrapur ?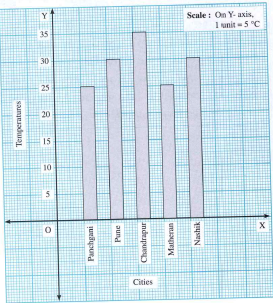
View SolutionObserve the graph and answer the following questions.
The temperature is minimum at
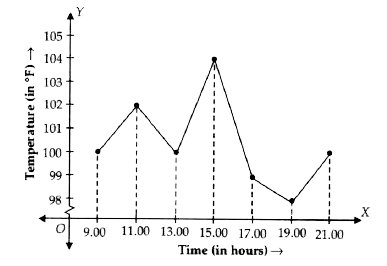
View SolutionObserve the graph and answer the following questions.
The temperature is maximum at
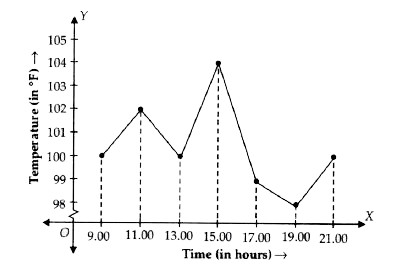
View SolutionRead the graph and answer the following questions
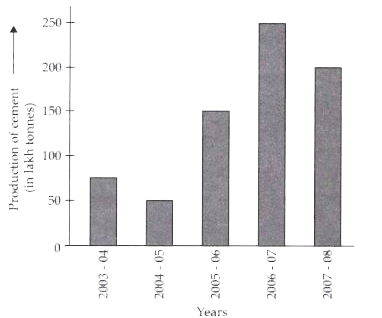
What information is conveyed by the bar graph
View SolutionObserve the graph and answer the following questions.
The temperature of the patient at 11.00 hours is
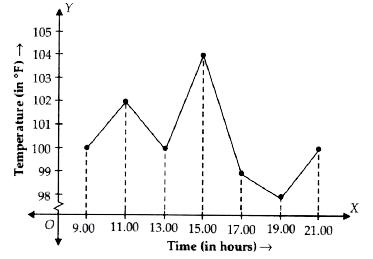
View SolutionObserve the graph and answer the following questions.
The temperature of the patient at 15: 00 hours is
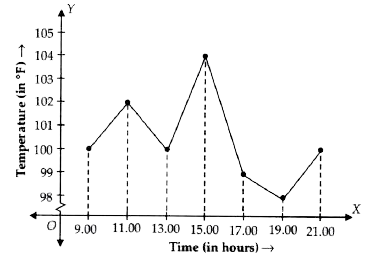
View SolutionThe bar graph shows the temperatures in 6 cities.
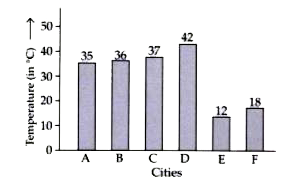
The difference between the maximum and the minimum temperature is ______ .
View Solution
