Complete Solutions to Assignment (SECTION - D) of chapter MOTION IN STRAIGHT LINE of Class 12 book with complete answers and questions
| Class 12 | PHYSICS |
| Chapter | MOTION IN STRAIGHT LINE |
| AAKASH INSTITUTE | Assignment (SECTION - D) |
| Number Of Questions | 24 |
| Academic Year | 2023-24 |
Graphs are very useful to represent a physical situation. Various quantities can be easily represented on graphs and other quantites can be determined from the graph. For example the slope of velocity-time graph represents instantaneous acceleration. For a motion with constant acceleration slope of velocity-time graph is constant. If acceleration is changing with time, slope with change and thus velocity-time graph will be a non-linear curve. Further the area of velocity-time graph gives displacement.
The velocity-time graph for two objects P and Q are shown. The ratio of their respective acceleration is
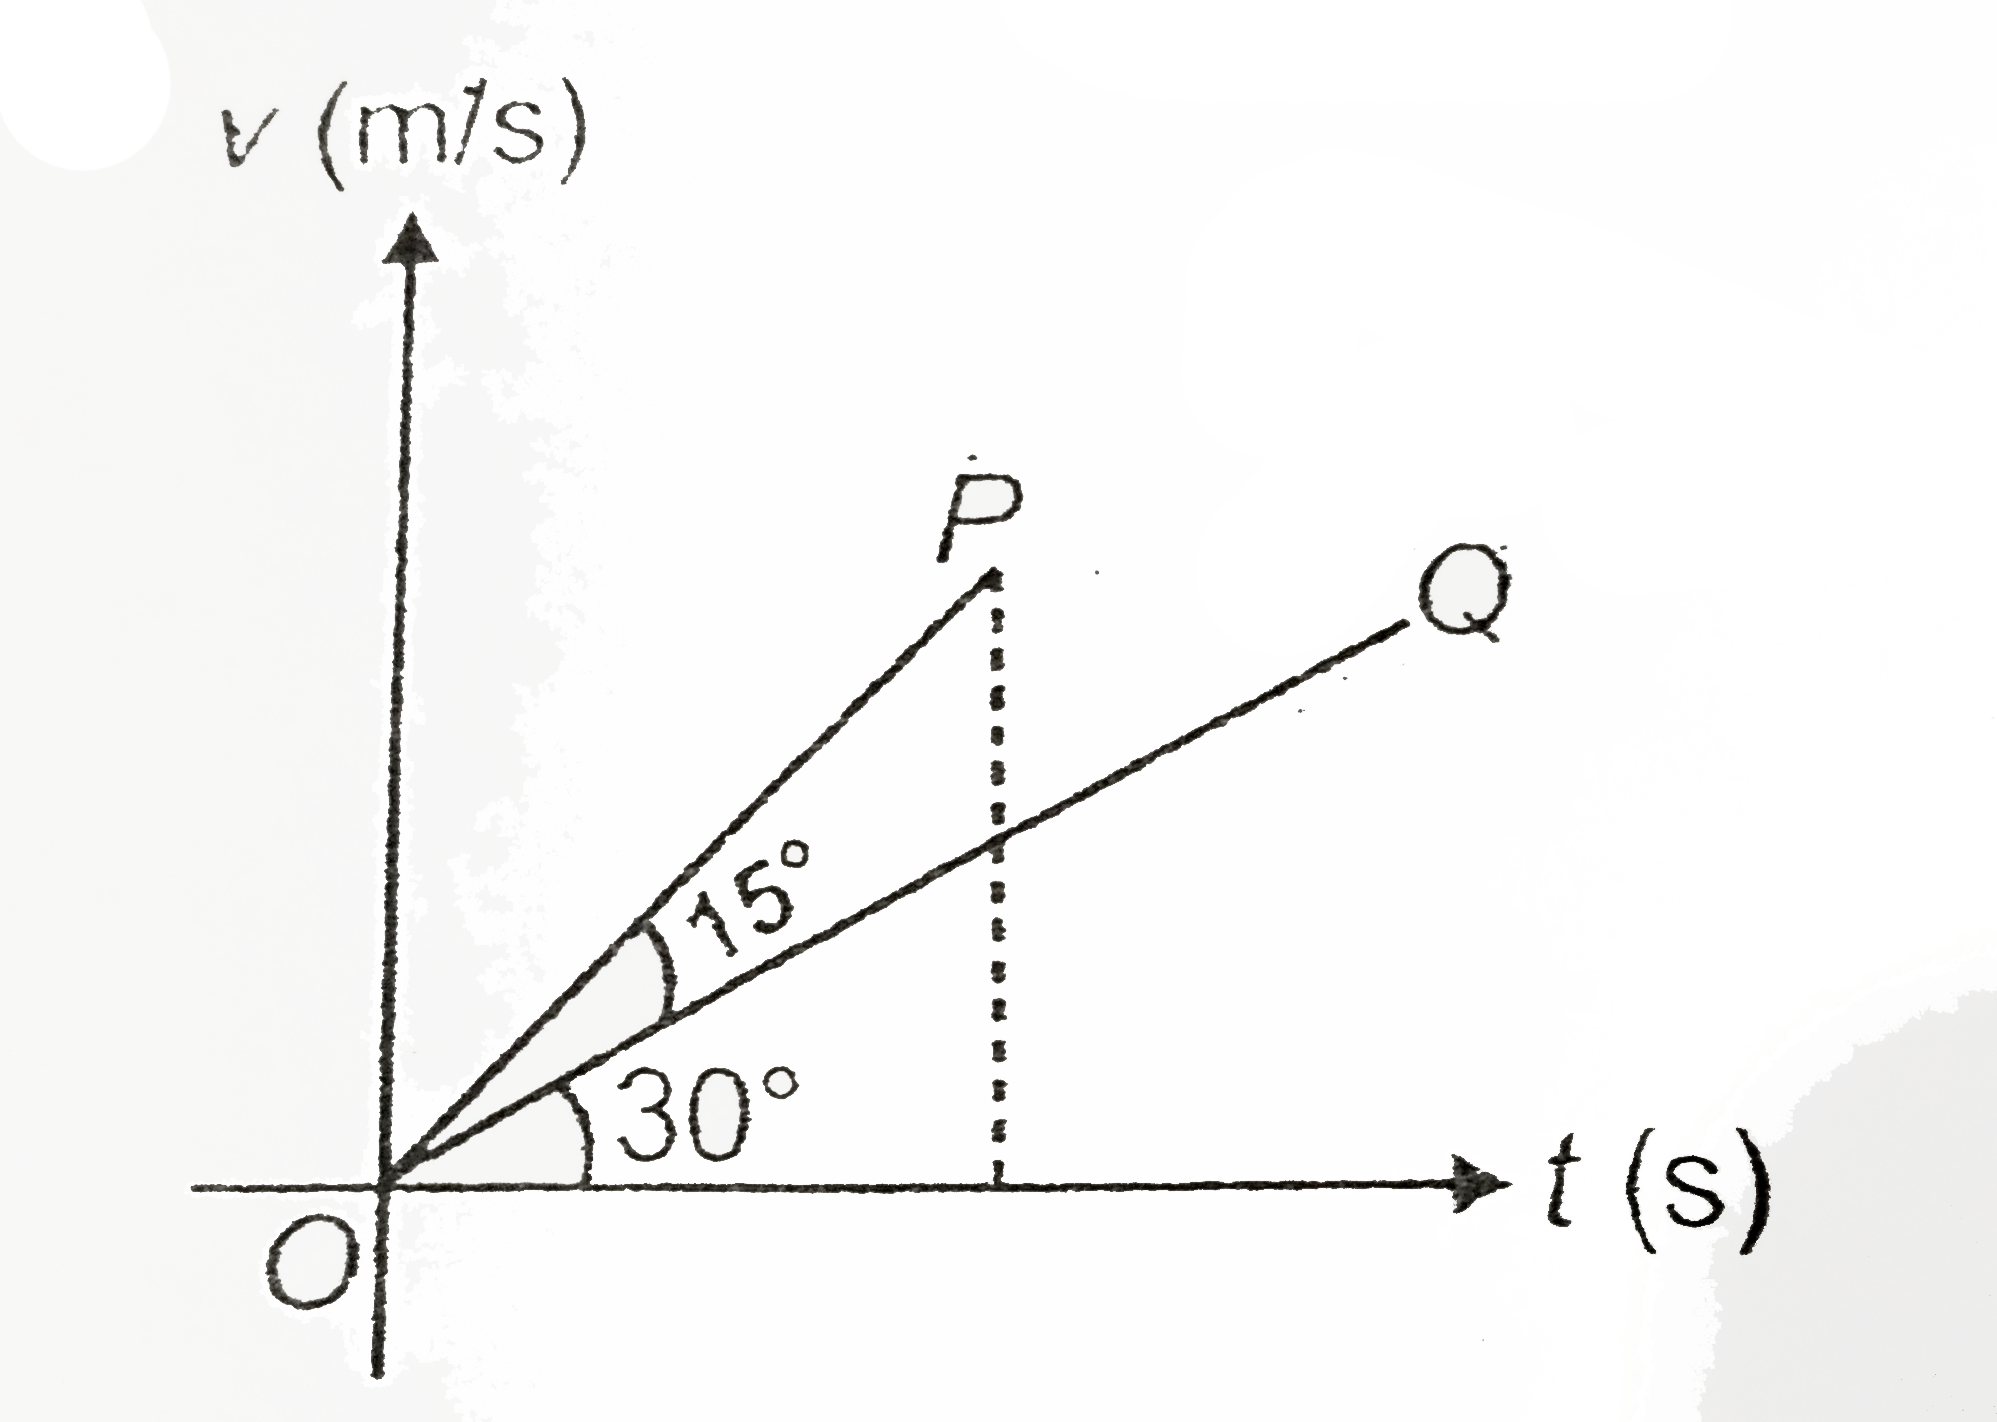
View SolutionGraphs are very useful to represent a physical situation. Various quantities can be easily represented on graphs and other quantites can be determined from the graph. For example the slope of velocity-time graph represents instantaneous acceleration. For a motion with constant acceleration slope of velocity-time graph is constant. If acceleration is changing with time, slope will change and thus velocity-time graph will be a non-linear curve. Further the area of velocity-time graph gives displacement.
For the given velocity-time graph the displacement of the object between t = 2 s to t = 4 s is
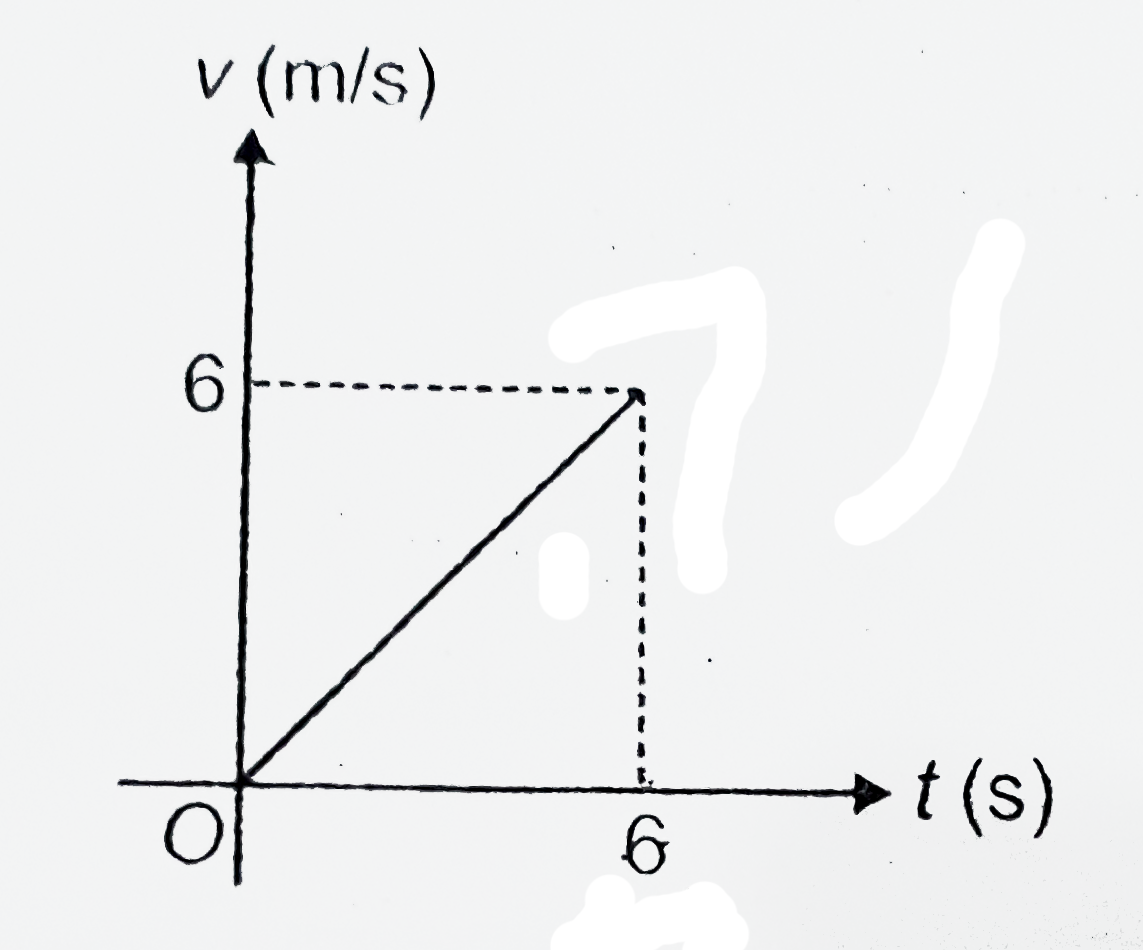
View SolutionGraphs are very useful to represent a physical situation. Various quantities can be easily represented on graphs and other quantites can be determined from the graph. For example the slope of velocity-time graph represents instantaneous acceleration. For a motion with constant acceleration slope of velocity-time graph is constant. If acceleration is changing with time, slope will change and thus velocity-time graph will be a non-linear curve. Further the area of velocity-time graph gives displacement.
For the given velocity-time graph the possibly correct acceleration-time relationship is
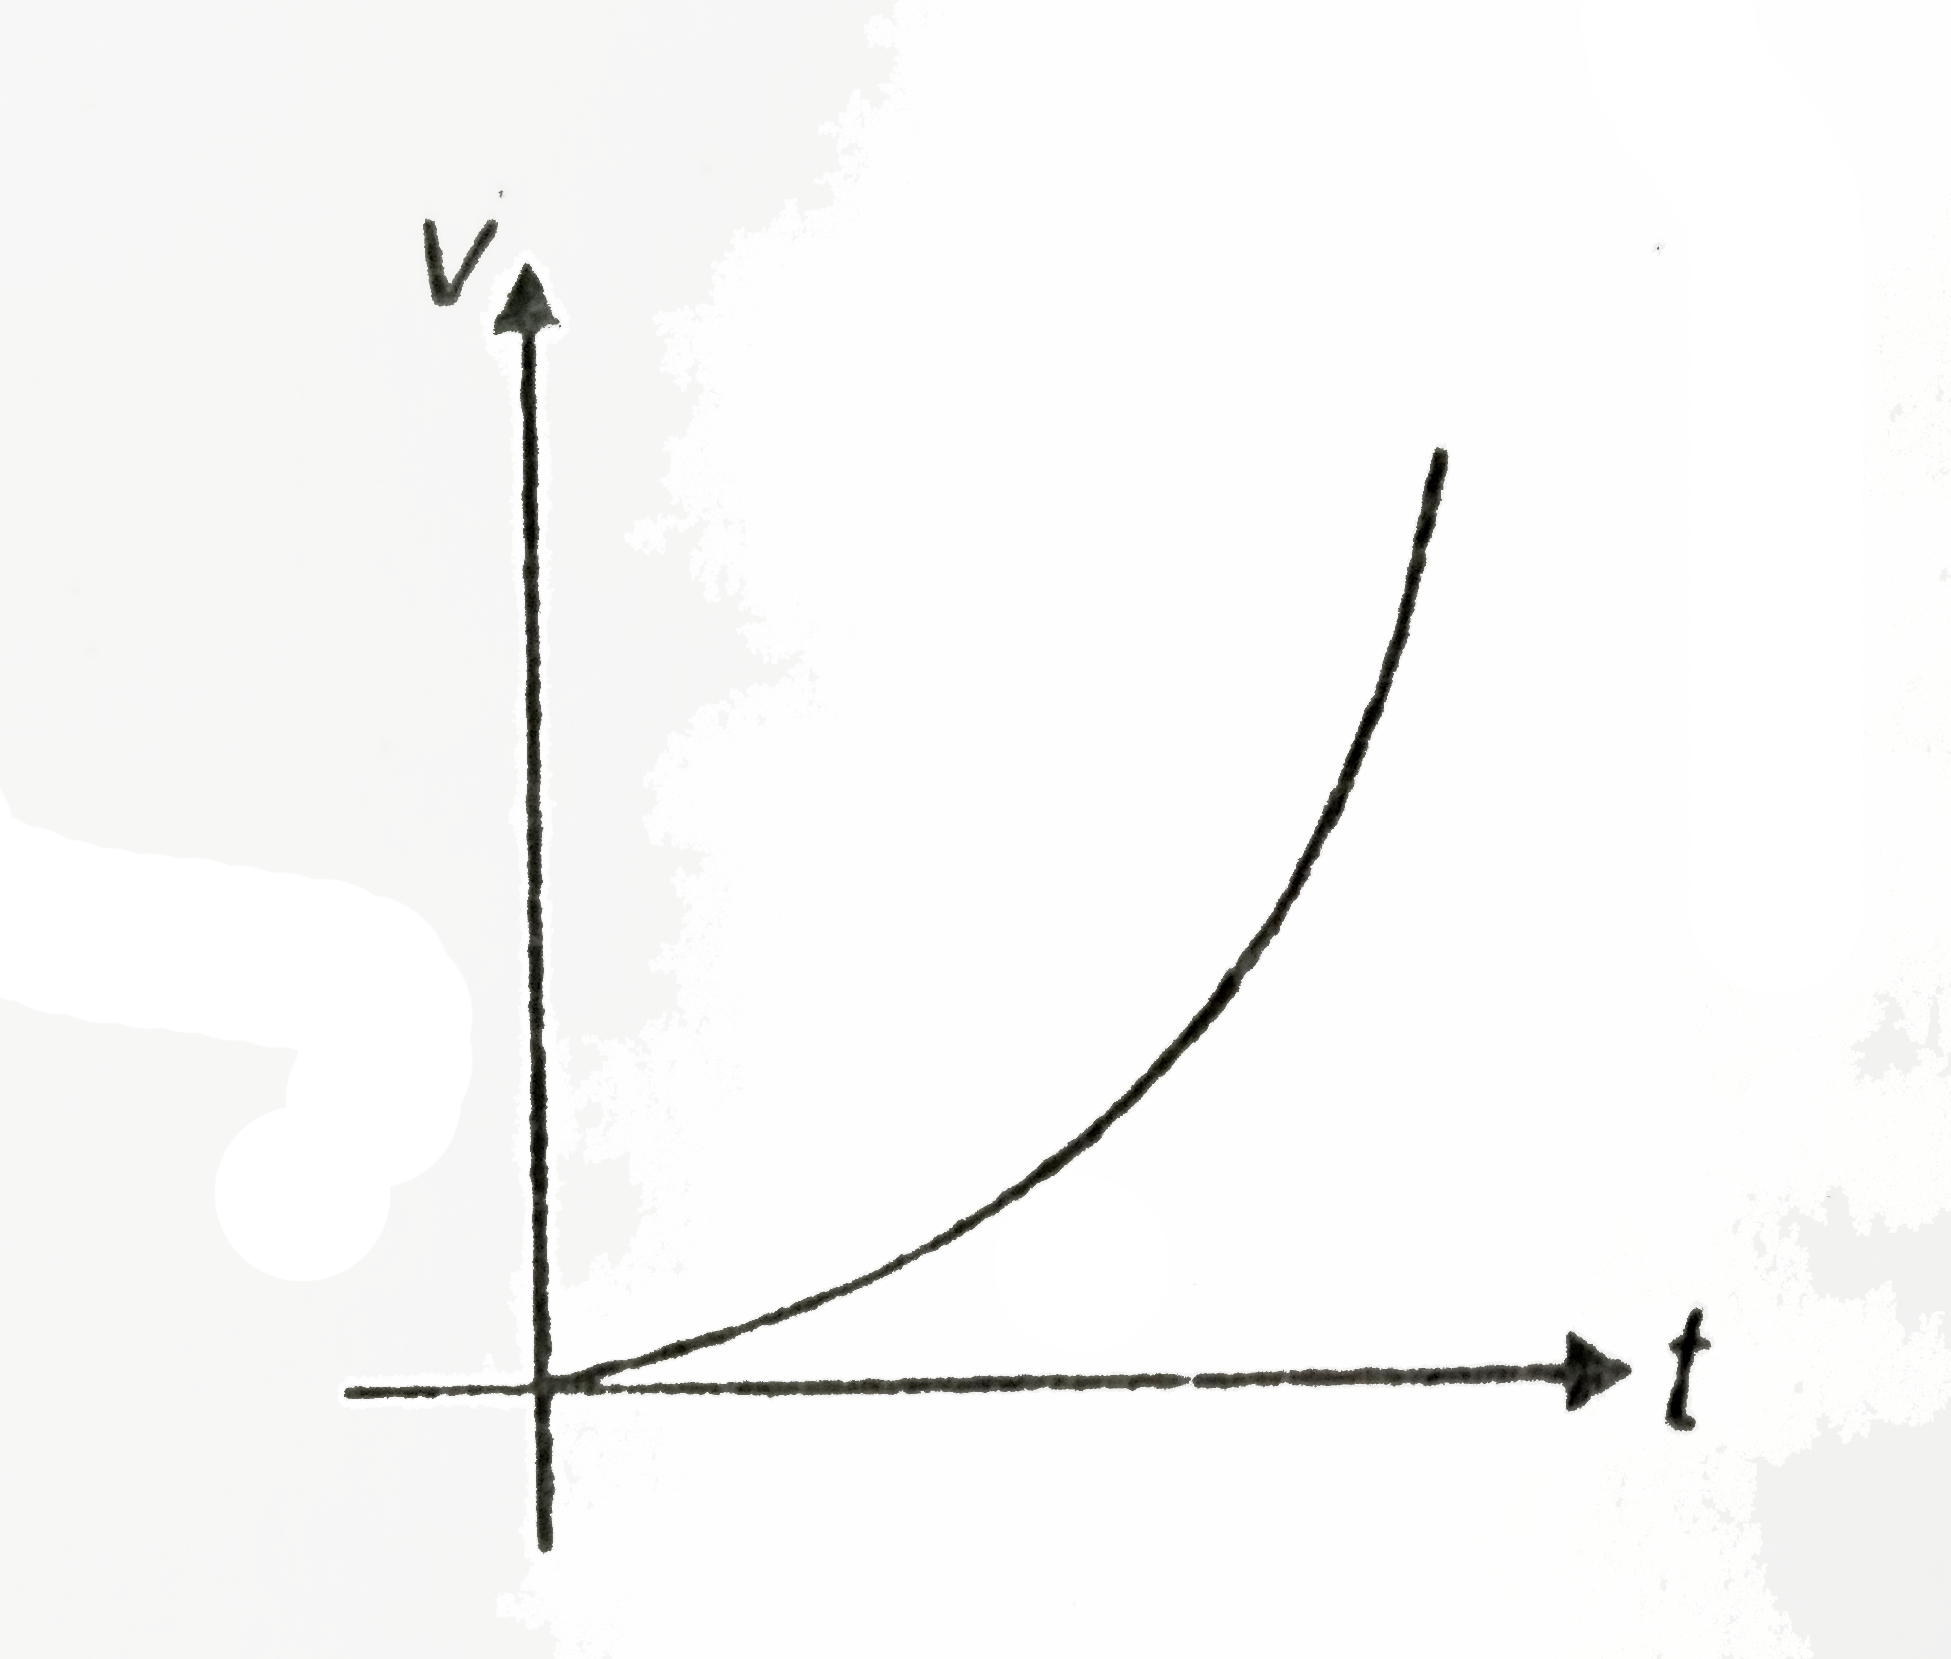
View SolutionGraphs are very useful to represent a physical situation. Various quantities can be easily represented on graphs and other quantites can be determined from the graph. For example the slope of velocity-time graph represents instantaneous acceleration. For a motion with constant acceleration slope of velocity-time graph is constant. If acceleration is changing with time, slope with change and thus velocity-time graph will be a non-linear curve. Further the area of velocity-time graph gives displacement.
A car starts from rest with a constant acceleration `a_(1)` for some time and attains a velocity `v_(0)`. Then it immediately retards at a constant rate `a_(2)` to rest. The total time to journey is `t_(0)` Identify the correct velocity-time graph
View SolutionGraphs are very useful to represent a physical situation. Various quantities can be easily represented on graphs and other quantites can be determined from the graph. For example the slope of velocity-time graph represents instantaneous acceleration. For a motion with constant acceleration slope of velocity-time graph is constant. If acceleration is changing with time, slope with change and thus velocity-time graph will be a non-linear curve. Further the area of velocity-time graph gives displacement.
For the above situation let `t_(1)` be the time of accelerated motion and `t_(2)` be the time or retarded motion, then the correct relation is
View SolutionGraphs are very useful to represent a physical situation. Various quantities can be easily represented on graphs and other quantites can be determined from the graph. For example the slope of velocity-time graph represents instantaneous acceleration. For a motion with constant acceleration slope of velocity-time graph is constant. If acceleration is changing with time, slope will change and thus velocity-time graph will be a non-linear curve. Further the area of velocity-time graph gives displacement.
The correct relation between `v_(0),a_(1),a_(2) and t_(0)` is
View SolutionGraphs are very useful to represent a physical situation. Various quantities can be easily represented on graphs and other quantites can be determined from the graph. For example the slope of velocity-time graph represents instantaneous acceleration. For a motion with constant acceleration slope of velocity-time graph is constant. If acceleration is changing with time, slope with change and thus velocity-time graph will be a non-linear curve. Further the area of velocity-time graph gives displacement.
The average velocity of the car for the entire trip is
View SolutionA car starts moving on a straight road. It makes the entire journey in three parts. The total time of journey is 25 s. For first part it accelerates at a constant rate `5m//s^(2)`. For second part it moves with a constant speed. For the third part it retards at constant rate `5m//s^(2)` to come to rest.
The correct velocity-time graph is
View SolutionA car starts moving on a straight road. It makes the entire journey in three parts. The total time of journey is 25 s. For first part it accelerates at a constant rate `5m//s^(2)`. For second part it moves with a constant speed. For the third part it retards at constant rate `5m//s^(2)` to come to rest.
Let `t_(1)` be the time for first part, `t_(2)` be the time for 2nd part then correct relation is
View SolutionA car starts moving on a straight road. It makes the entire journey in three parts. The total time of journey is 25 s. For first part it accelerates at a constant rate `5m//s^(2)`. For second part it moves with a constant speed. For the third part it retards at constant rate `5m//s^(2)` to come to rest.
If the average speed for entire journey is 20 m/s, time period of first part of journey is
View SolutionA rocket is fired upwards such that its engine takes 10 s to explods fully. Its velocity- time graph is as shown in the figure. Acceleration due to gravity is `10m//s^(2)`.
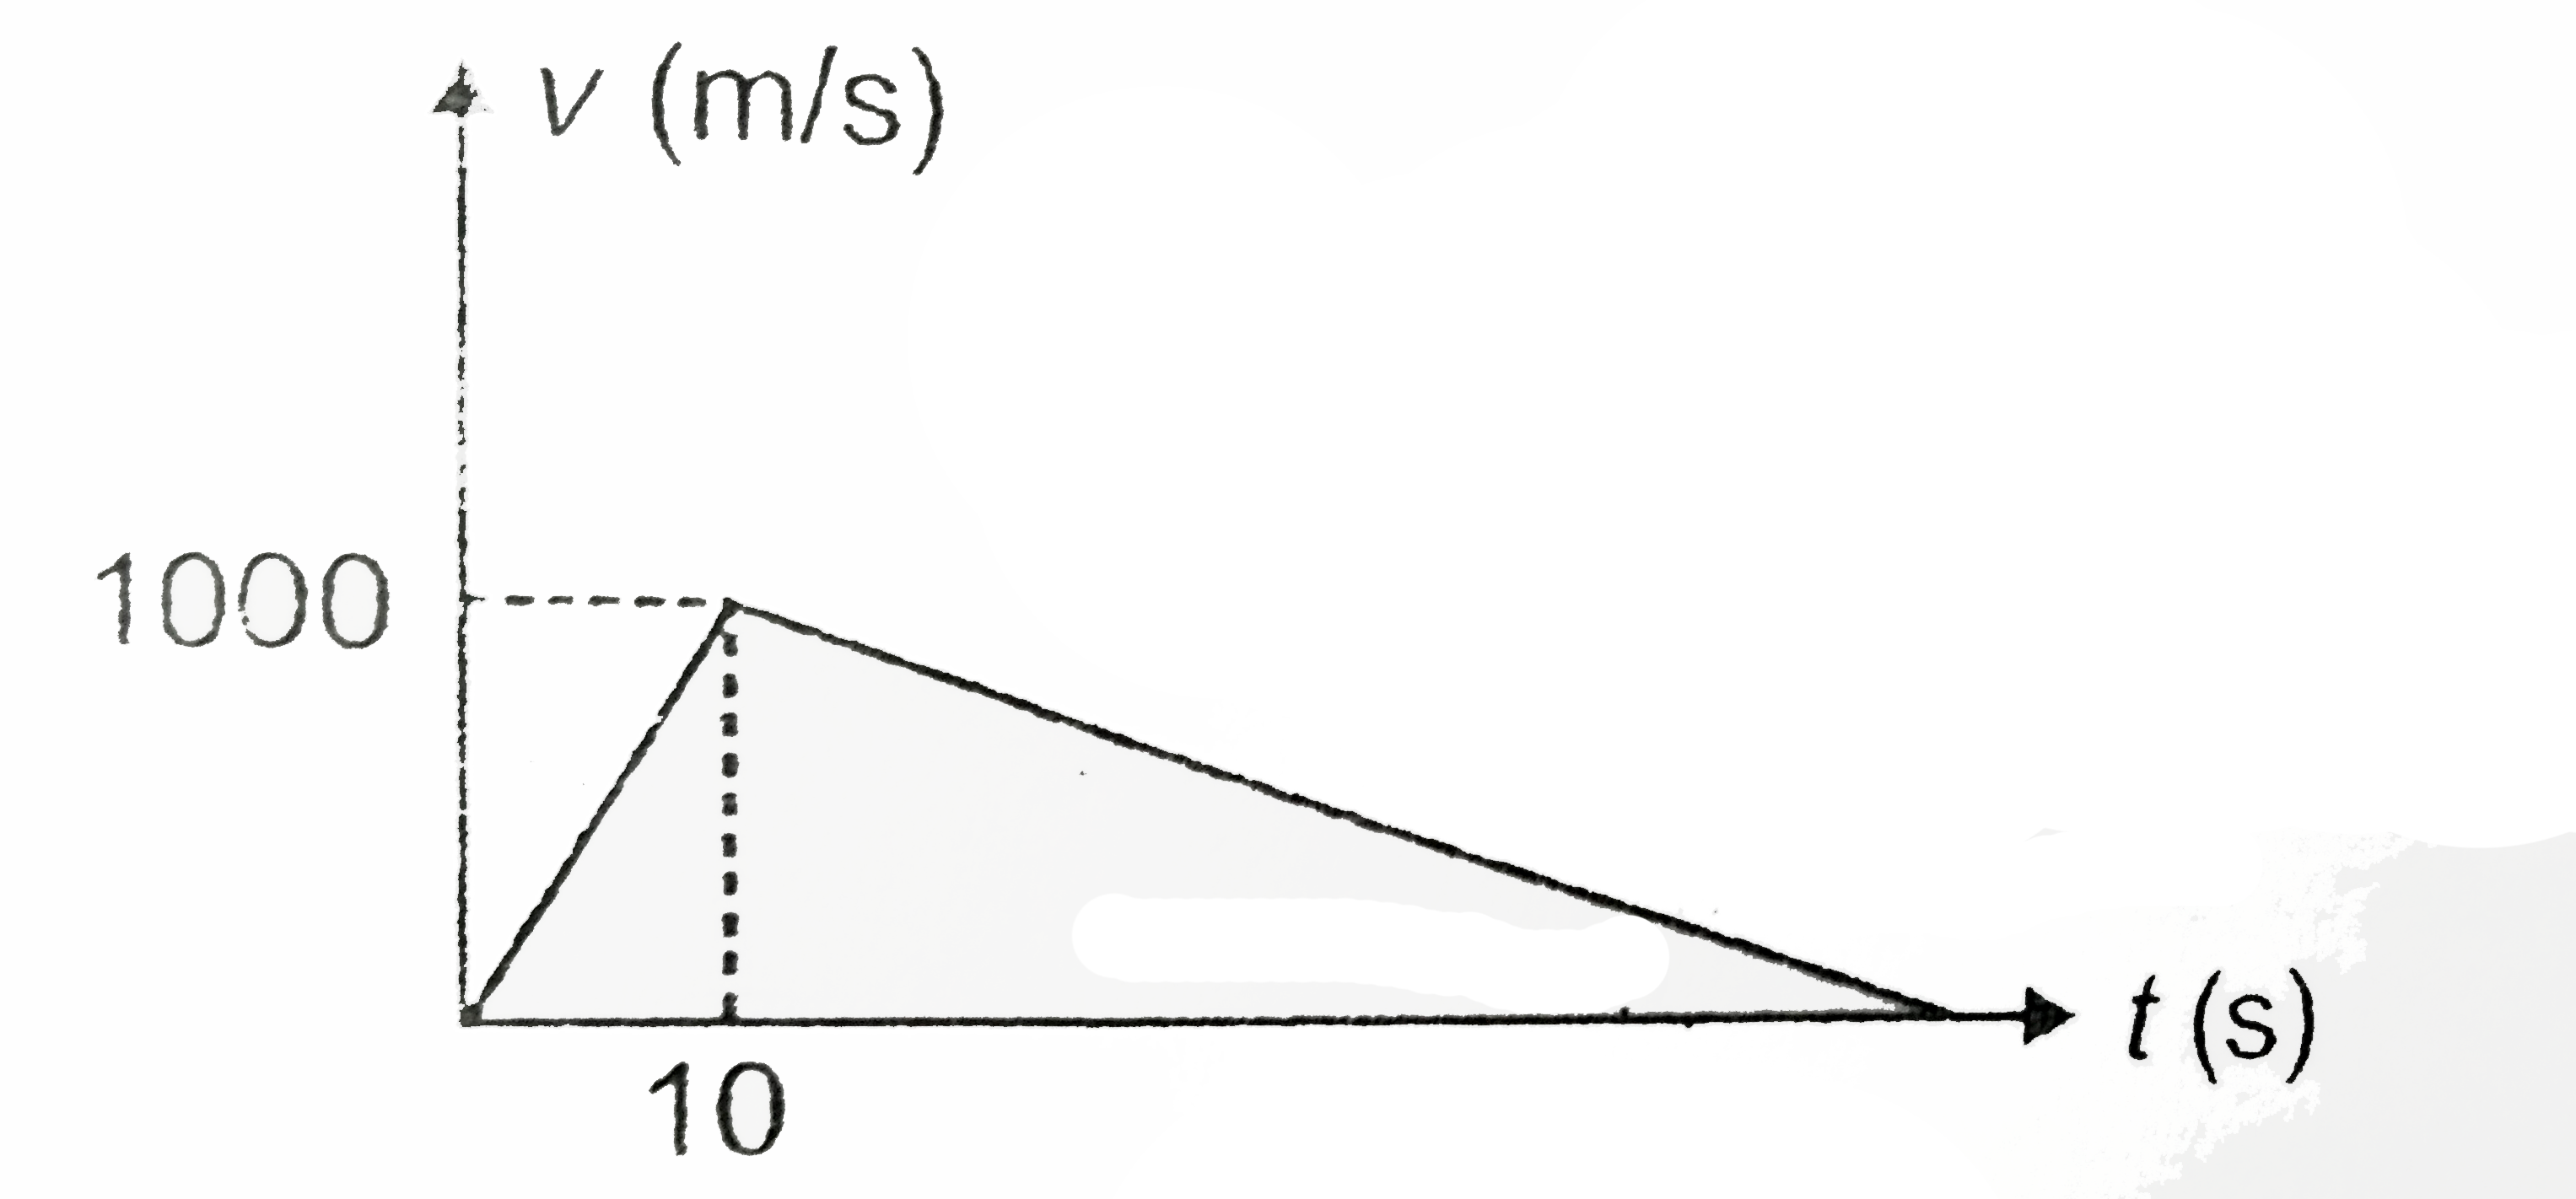
The total time for which the rocket moves upwards is
View SolutionA rocket is fired upwards such that its engine takes 10 s to explods fully. Its velocity- time graph is as shown in the figure. Acceleration due to gravity is `10m//s^(2)`.
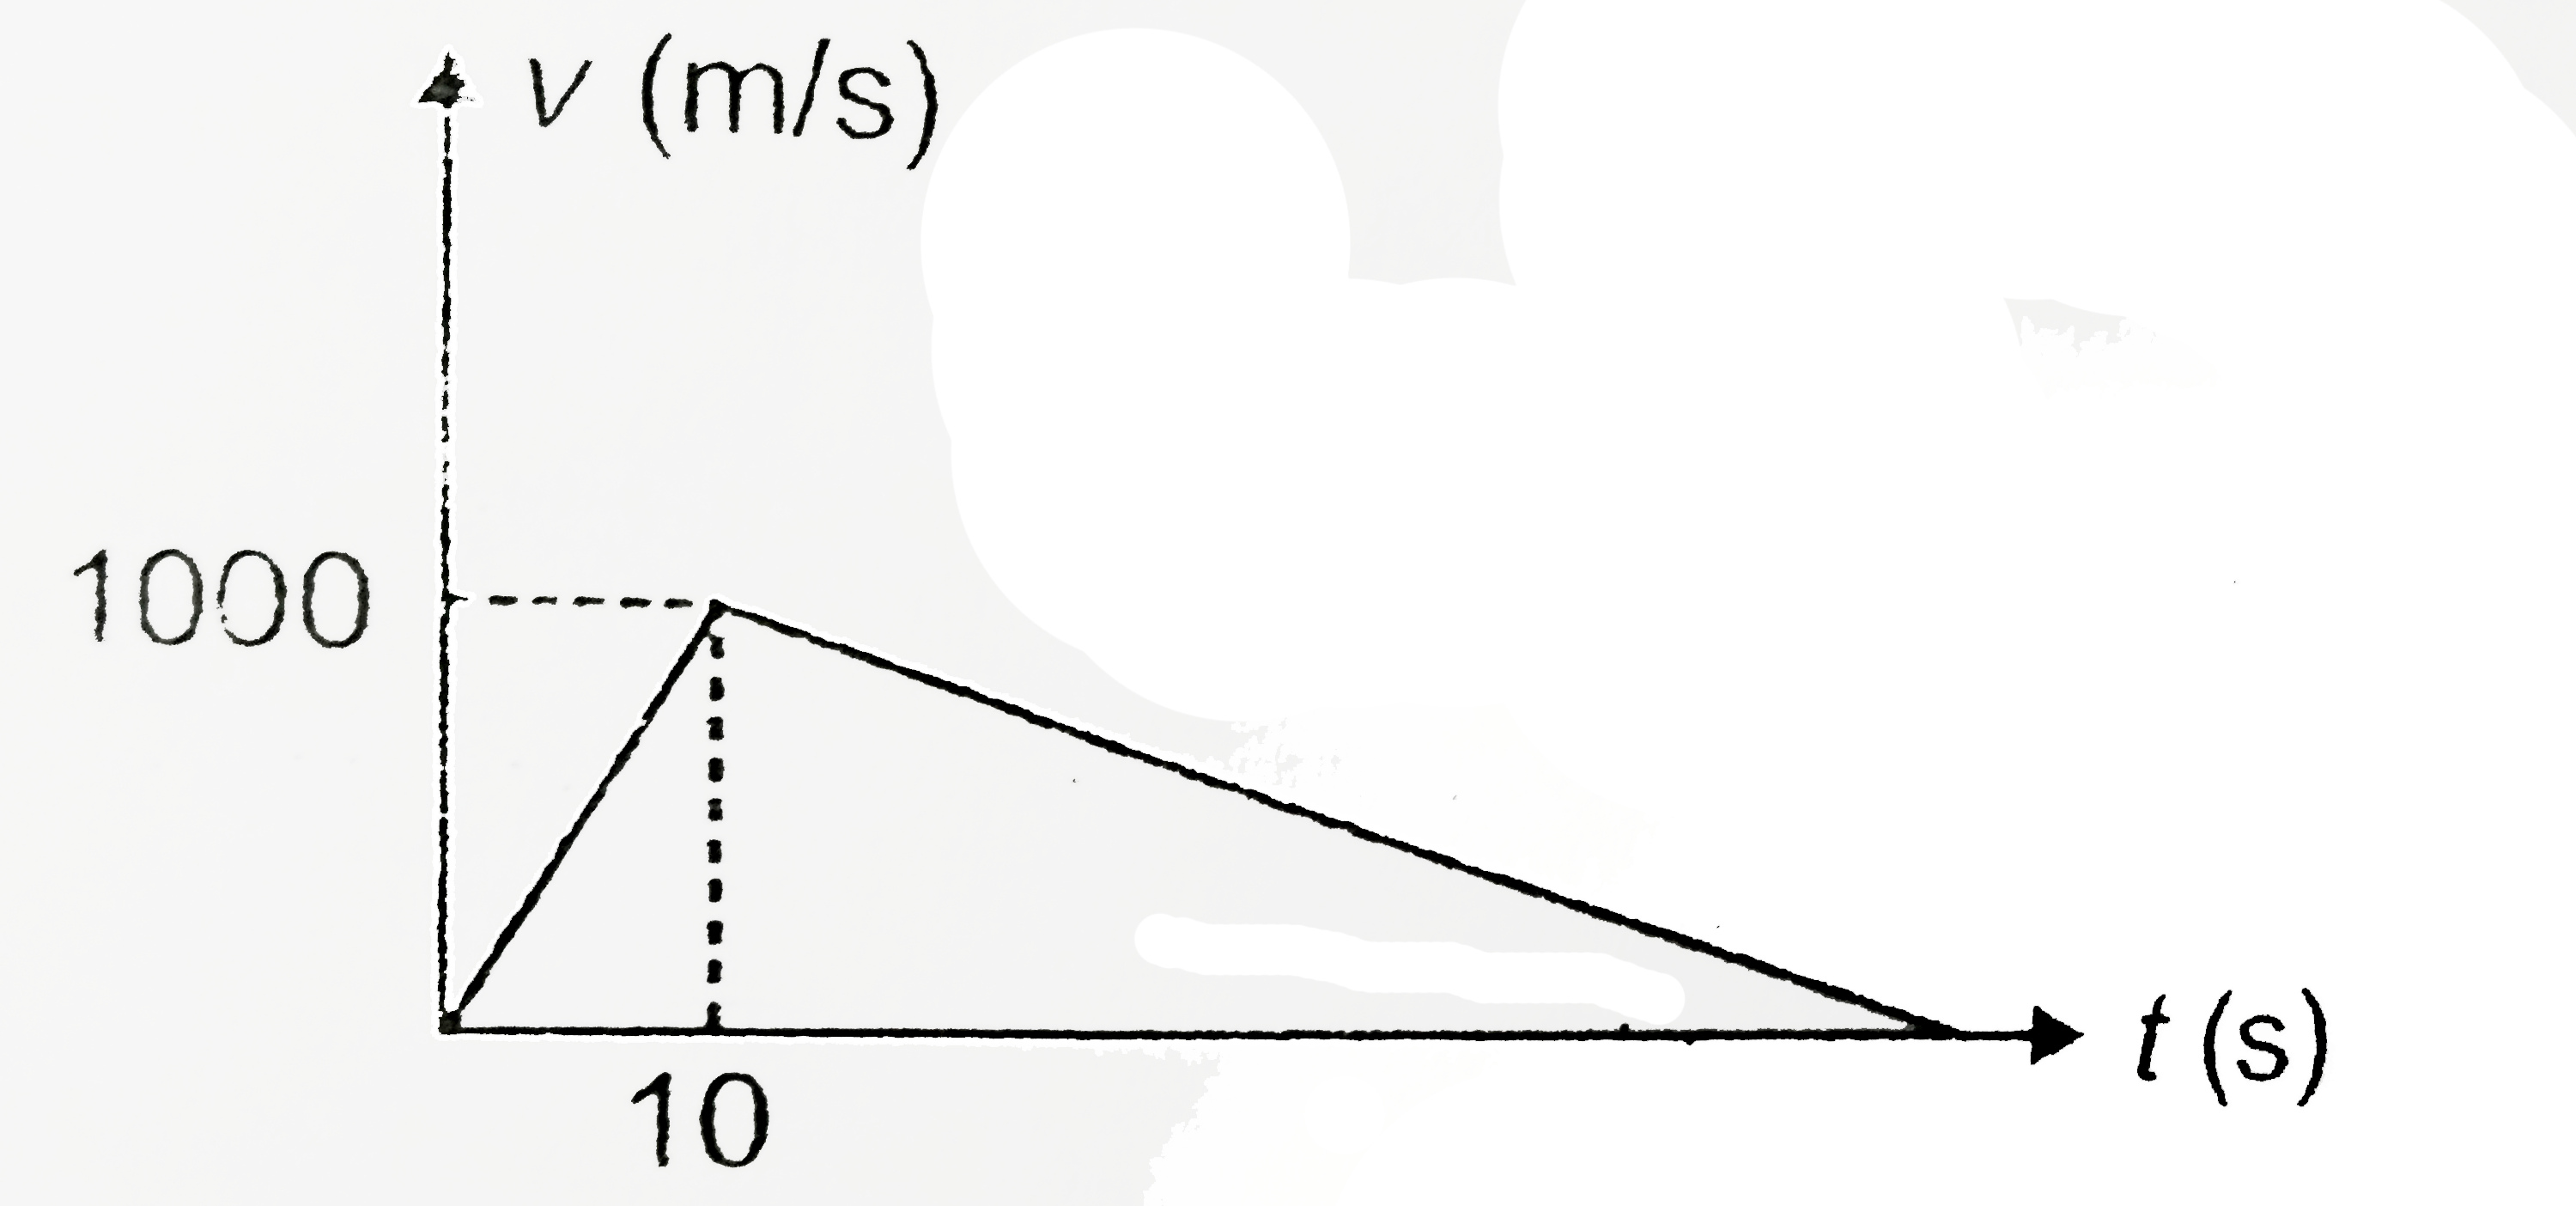
The height reached by the rocket till its engine explodes is
View SolutionA rocket is fired upwards such that its engine takes 10 s to explods fully. Its velocity- time graph is as shown in the figure. Acceleration due to gravity is `10m//s^(2)`.
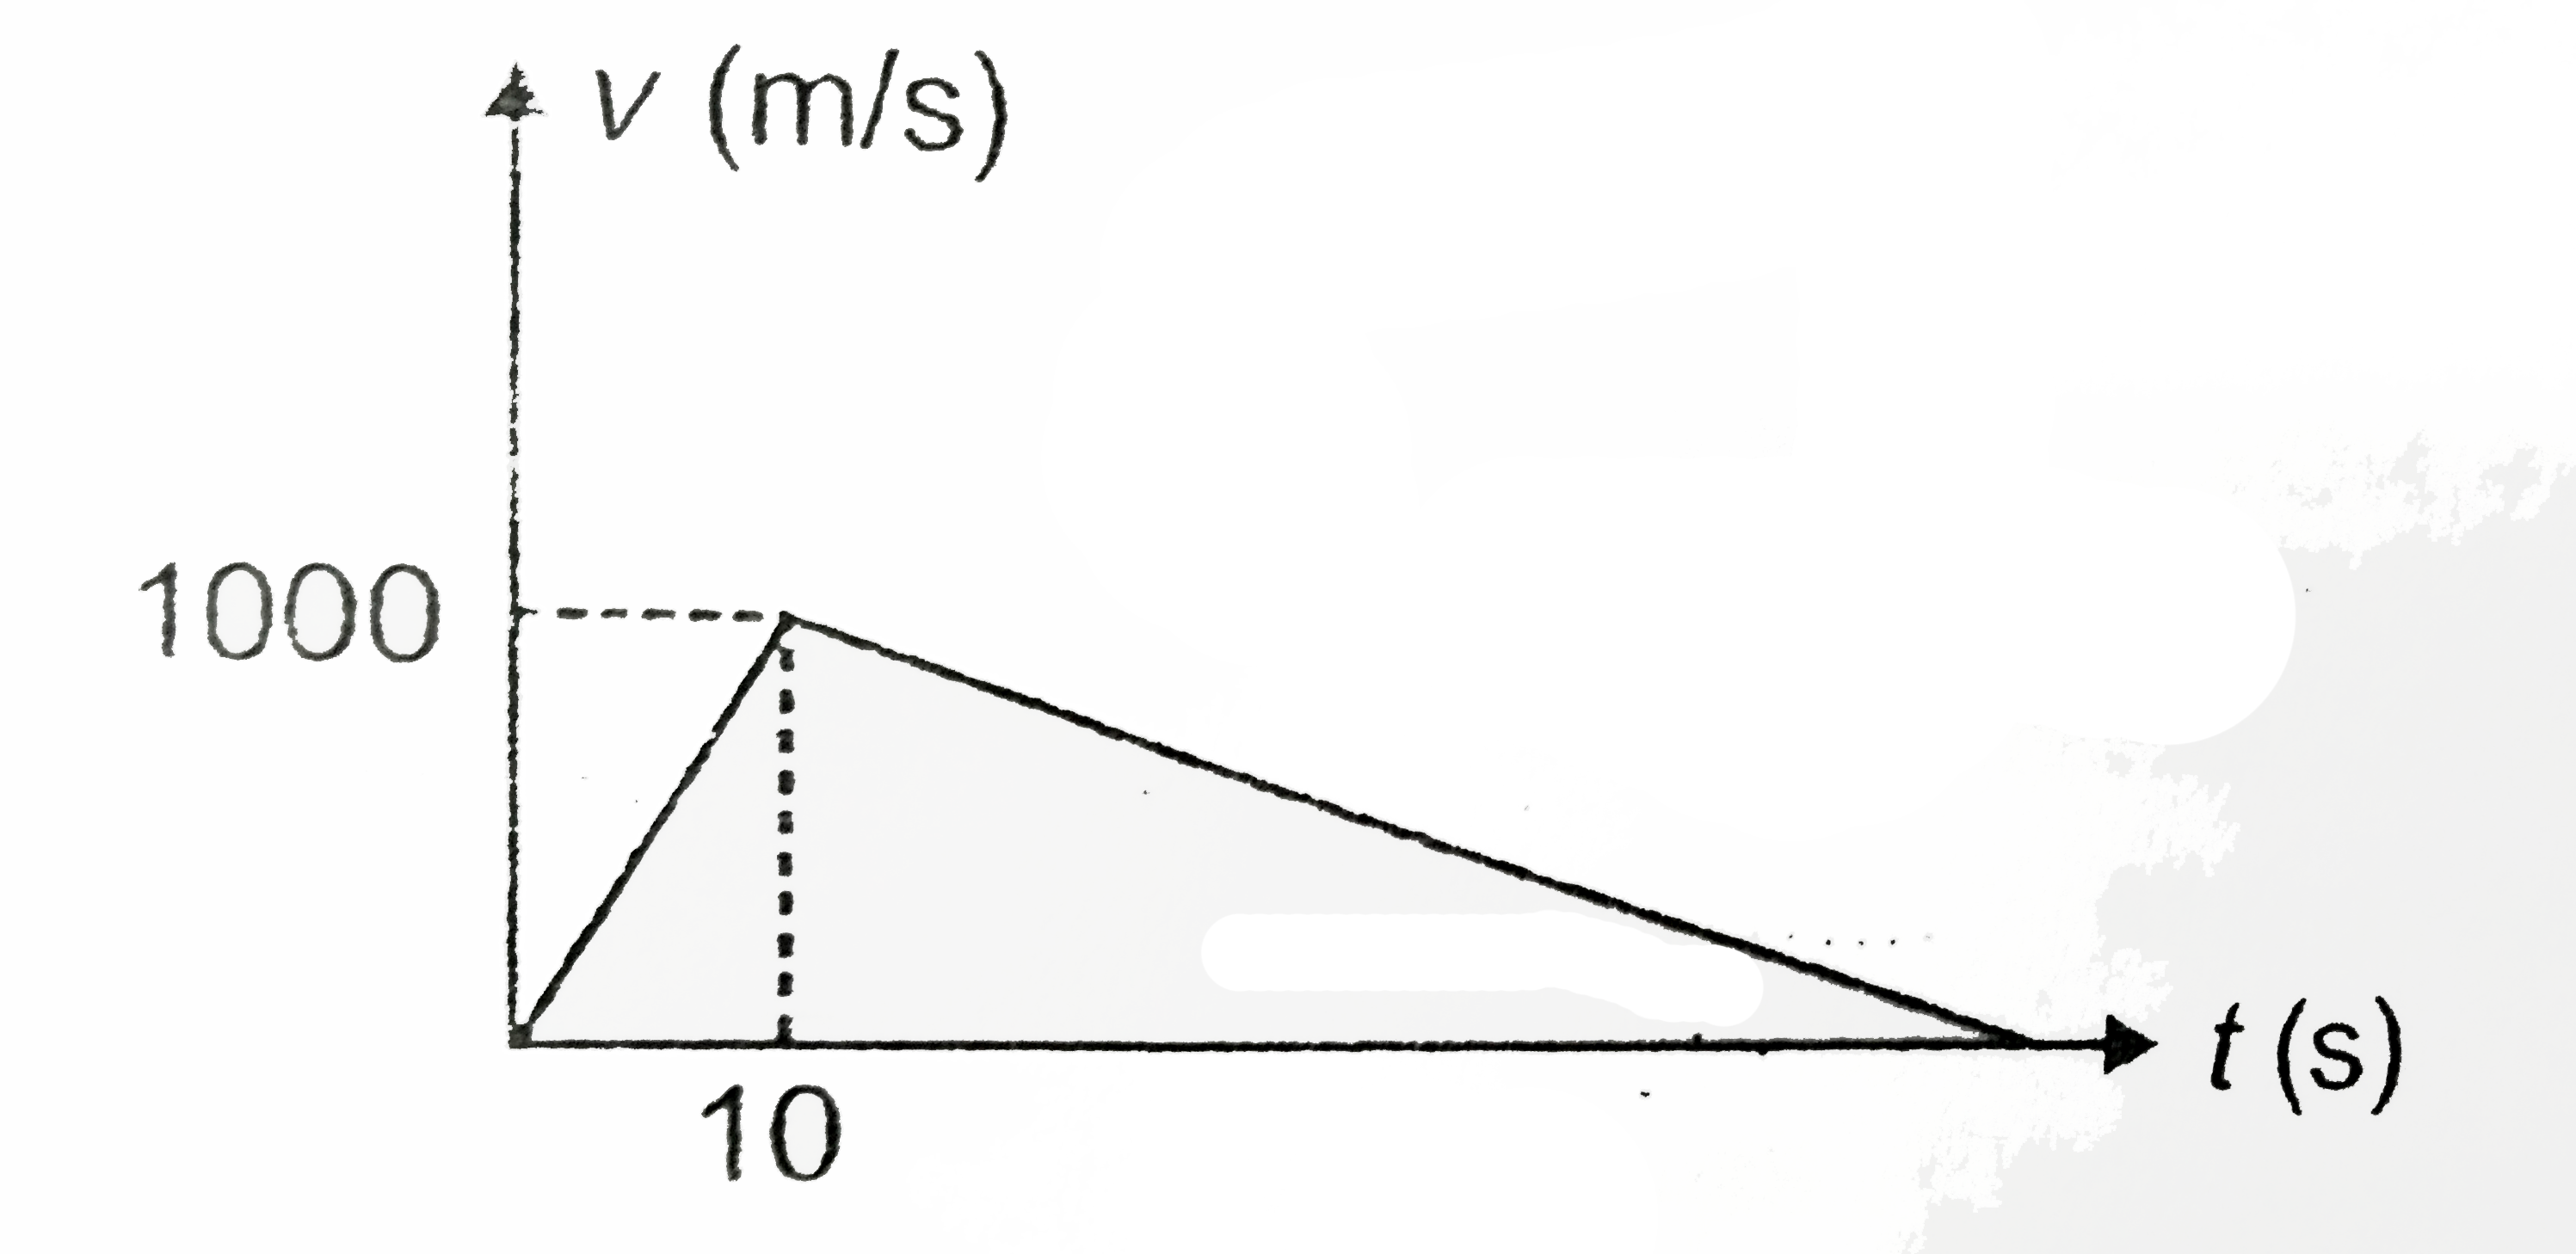
The maximum height attained by the rocket is
View SolutionA car accelerates from rest at constant rate of `2ms^(-2)` for some time. Immediately after this, it retards at a constant rate of `4ms^(-2)` and comes to rest. The total time for which it remains in motion is 3 s. Taking the moment of start of motion as t = 0, answer the following questions.
If the time of acceleration is `t_(1)`, then the speed of the car at `t=t_(1)` is
View SolutionA car accelerates from rest at constant rate of `2ms^(-2)` for some time. Immediately after this, it retards at a constant rate of `4ms^(-2)` and comes to rest. The total time for which it remains in motion is 3 s. Taking the moment of start of motion as t = 0, answer the following questions.
Let t be a time instant greater than `t_(1)` but less than 3 s. The velocity at this time instant is
View SolutionA car accelerates from rest at constant rate of `2ms^(-2)` for some time. Immediately after this, it retards at a constant rate of `4ms^(-2)` and comes to rest. The total time for which it remains in motion is 3 s. Taking the moment of start of motion as t = 0, answer the following questions.
At t = 3 s, the speed of the car is zero. The time for which it increases its speed is
View SolutionA car acceleration from rest at a constant rate `2m//s^(2)` for some time. Then, it retards at a constant rate of `4 m//s^(2)` and comes to rest. If it remains motion for 3 second, then the maximum speed attained by the car is:-
View SolutionA car accelerates from rest at constant rate of `2ms^(-2)` for some time. Immediately after this, it retards at a constant rate of `4ms^(-2)` and comes to rest. The total time for which it remains in motion is 3 s. Taking the moment of start of motion as t = 0, answer the following questions.
What is the distance travelled by it during the time of increasing speed ?
View SolutionA car accelerates from rest at constant rate of `2ms^(-2)` for some time. Immediately after this, it retards at a constant rate of `4ms^(-2)` and comes to rest. The total time for which it remains in motion is 3 s. Taking the moment of start of motion as t = 0, answer the following questions.
What is the distance travelled by it during the time of decreasing speed ?
View SolutionA car accelerates from rest at constant rate of `2ms^(-2)` for some time. Immediately after this, it retards at a constant rate of `4ms^(-2)` and comes to rest. The total time for which it remains in motion is 3 s. Taking the moment of start of motion as t = 0, answer the following questions.
What is the average speed of the car for the journey .
a. 2 m/s
b. 3 m/s
c. 1 m/s
d. Zero
View SolutionThe figure shows position time graph of two riders C and D. Based on the information represented by the graph, answer the following questions.
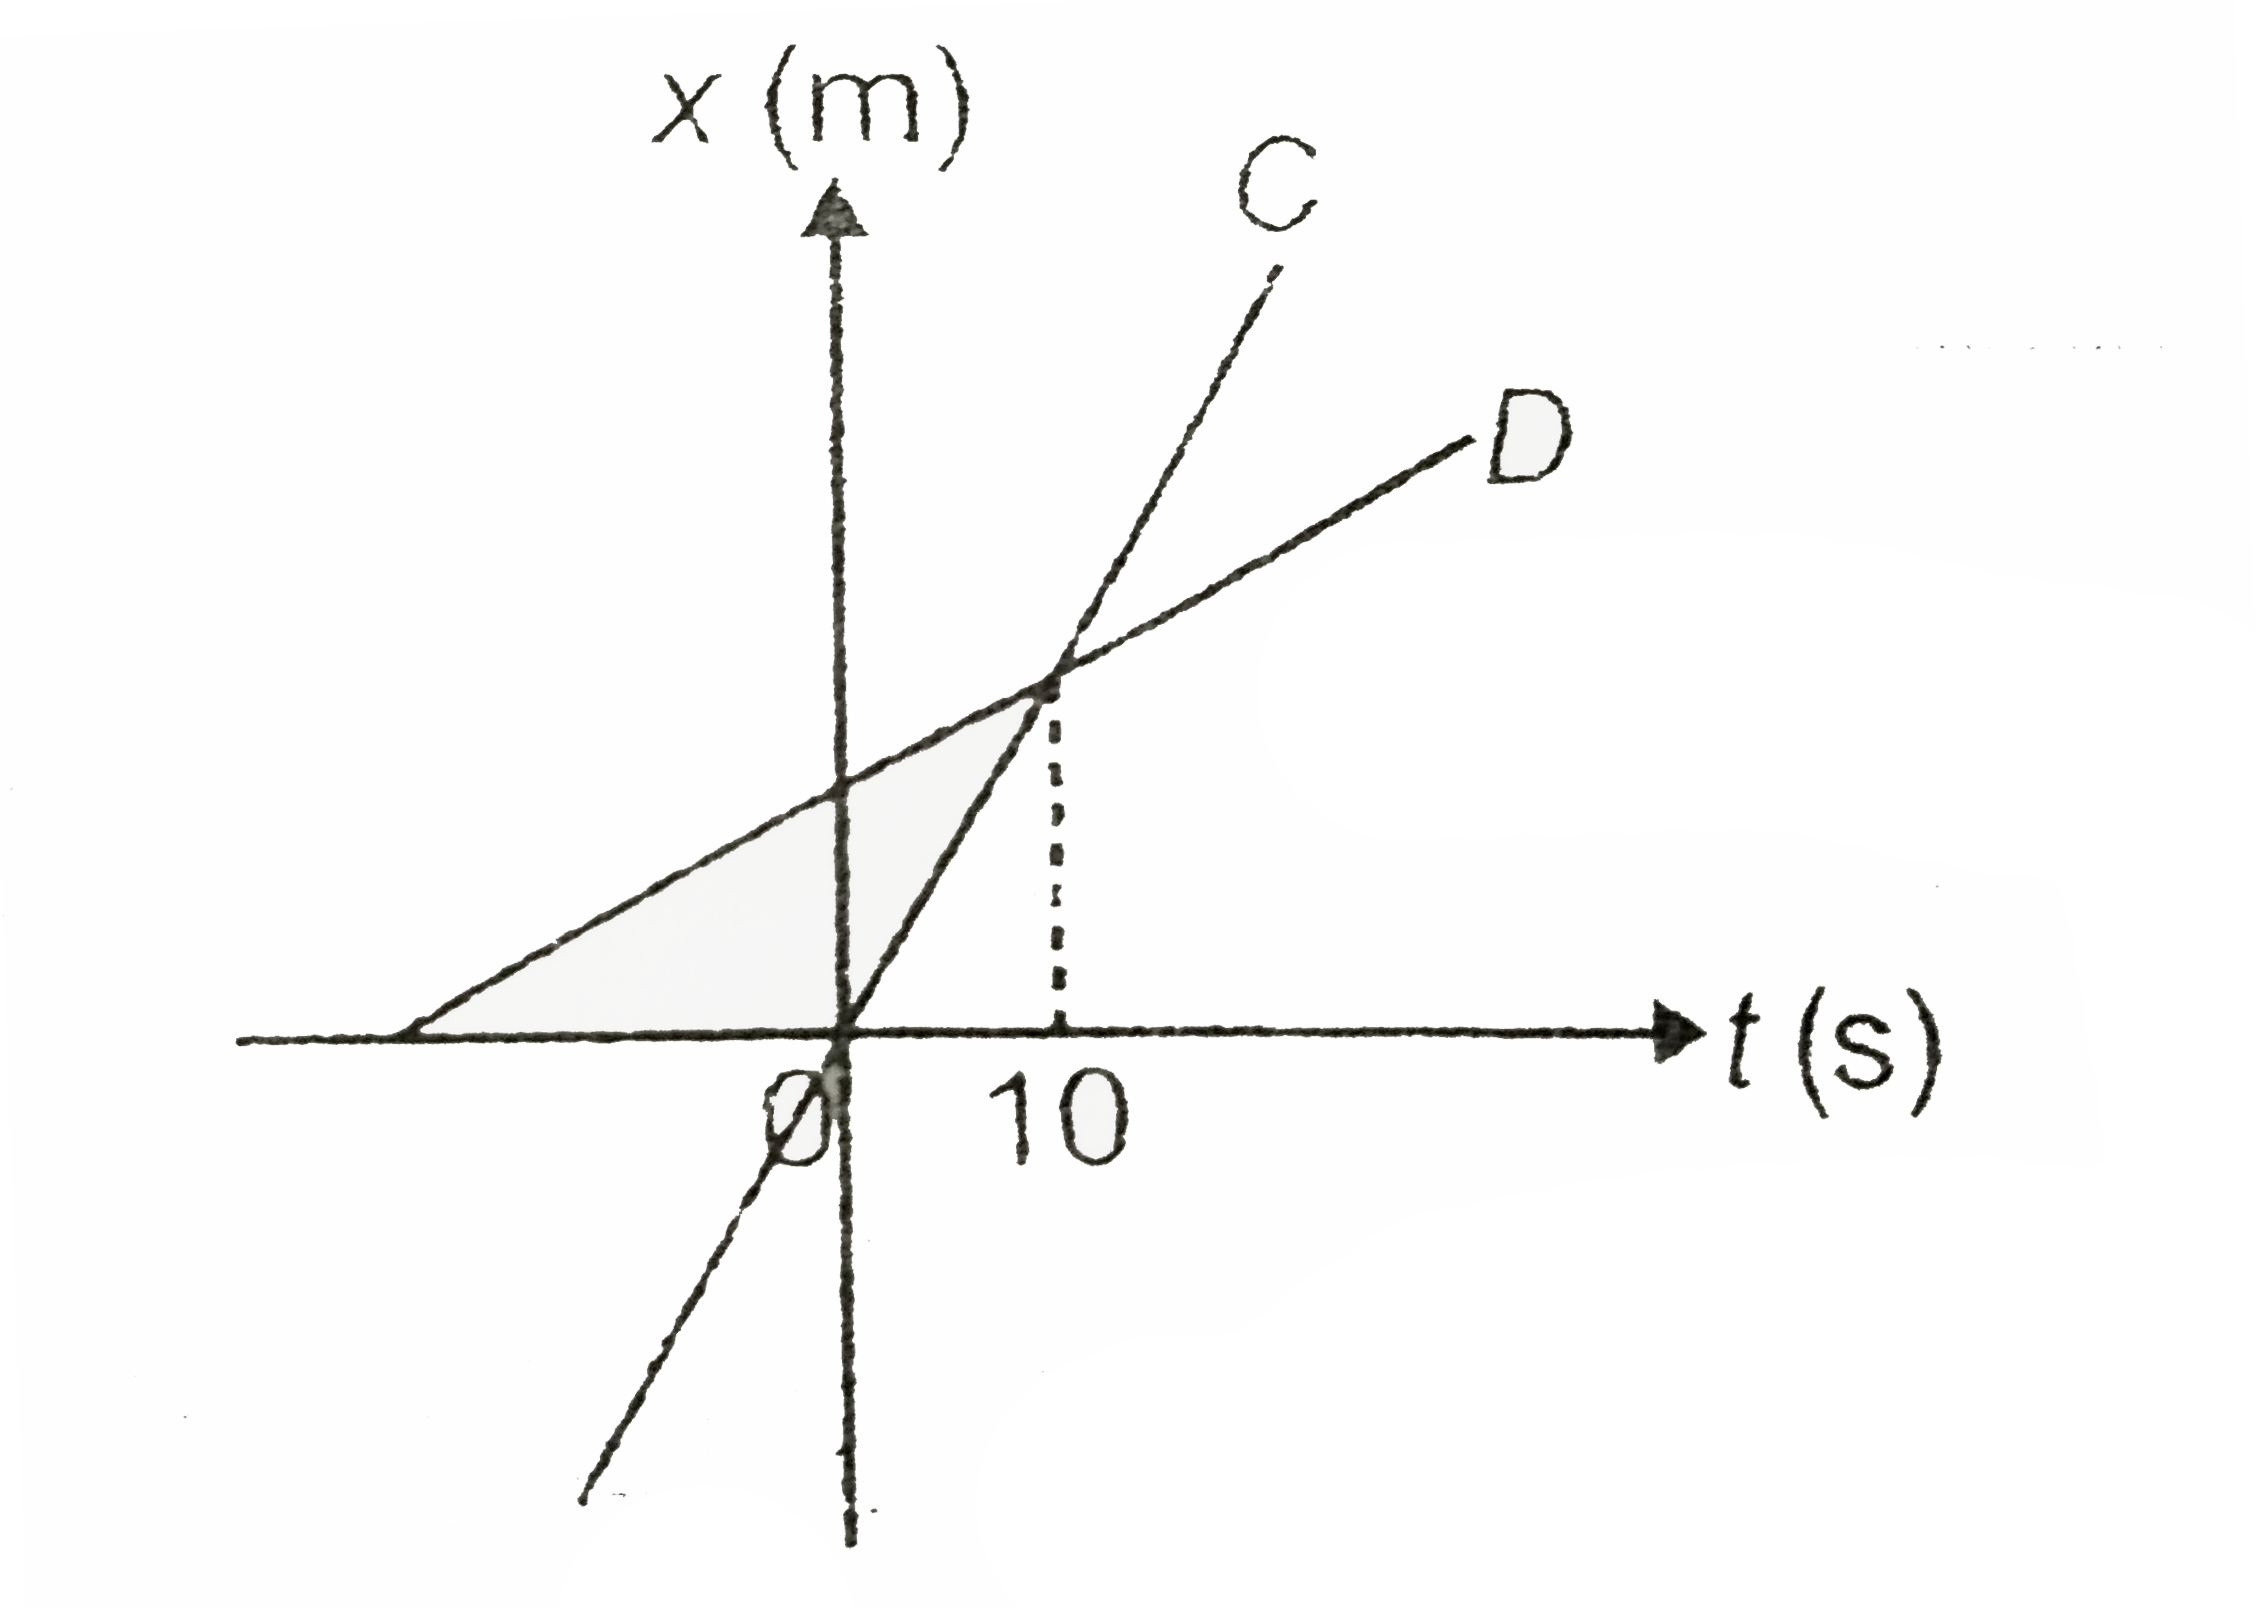
At t = 0 s
View SolutionThe figure shows position time graph of two riders C and D. Based on the information represented by the graph, answer the following questions.
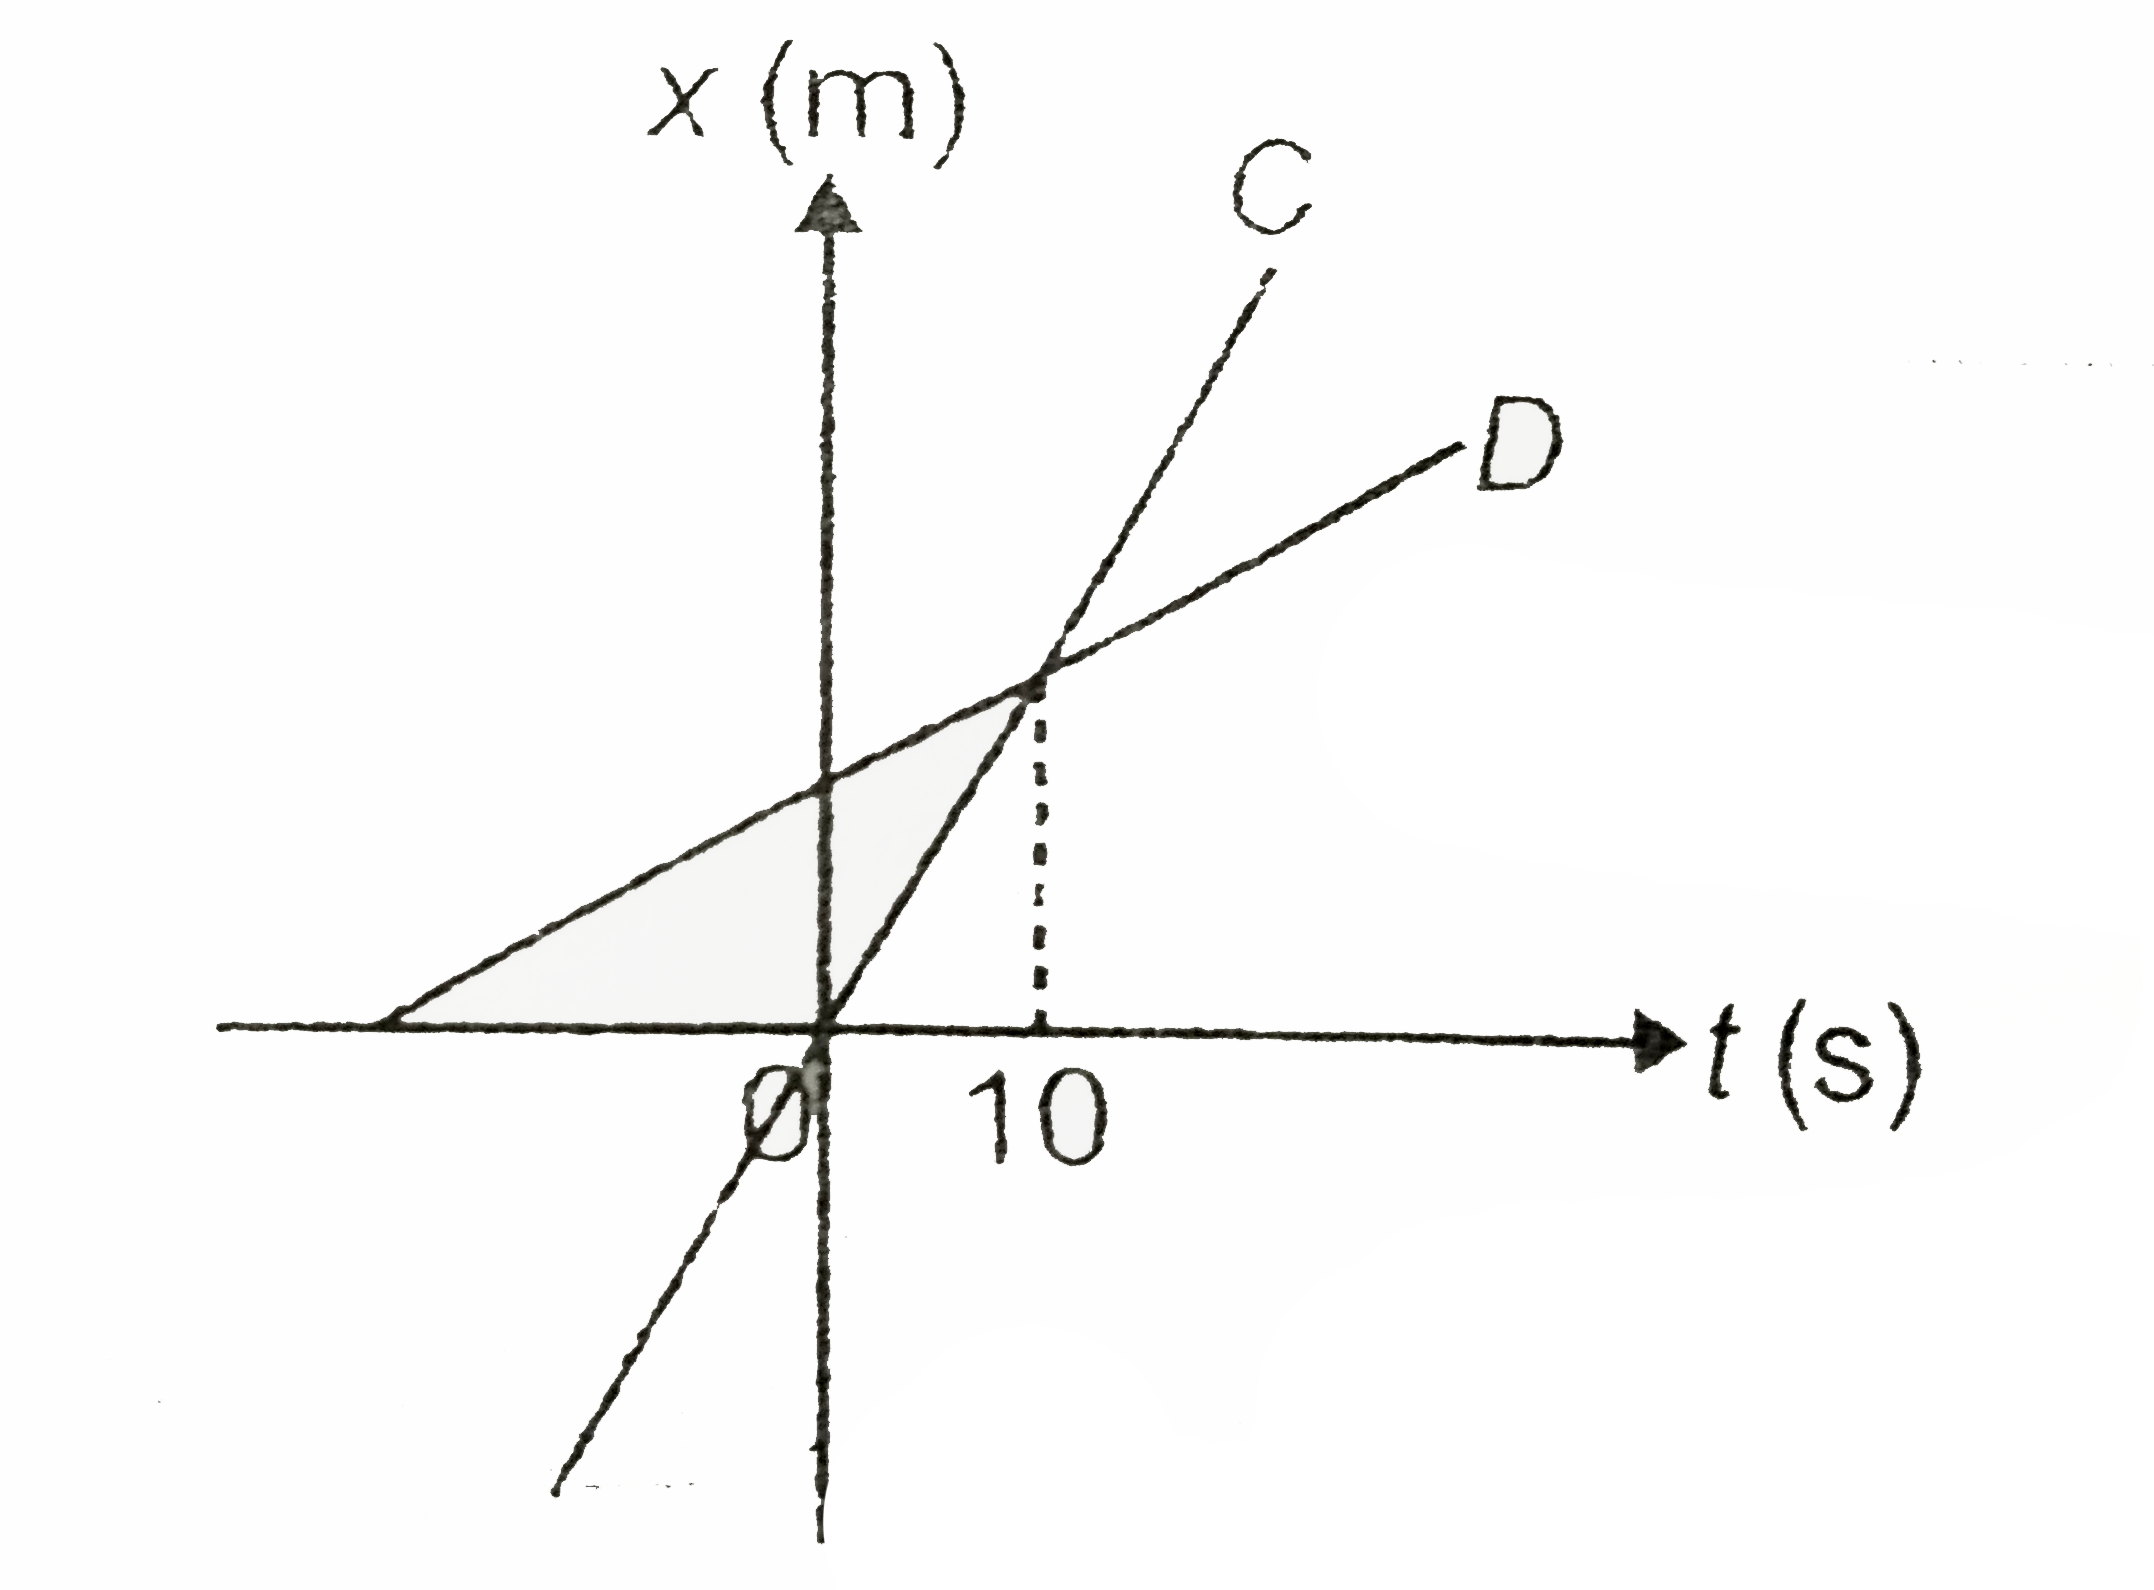
At t = 0 s
View SolutionThe figure shows position time graph of two riders C and D. Based on the information represented by the graph, answer the following questions.
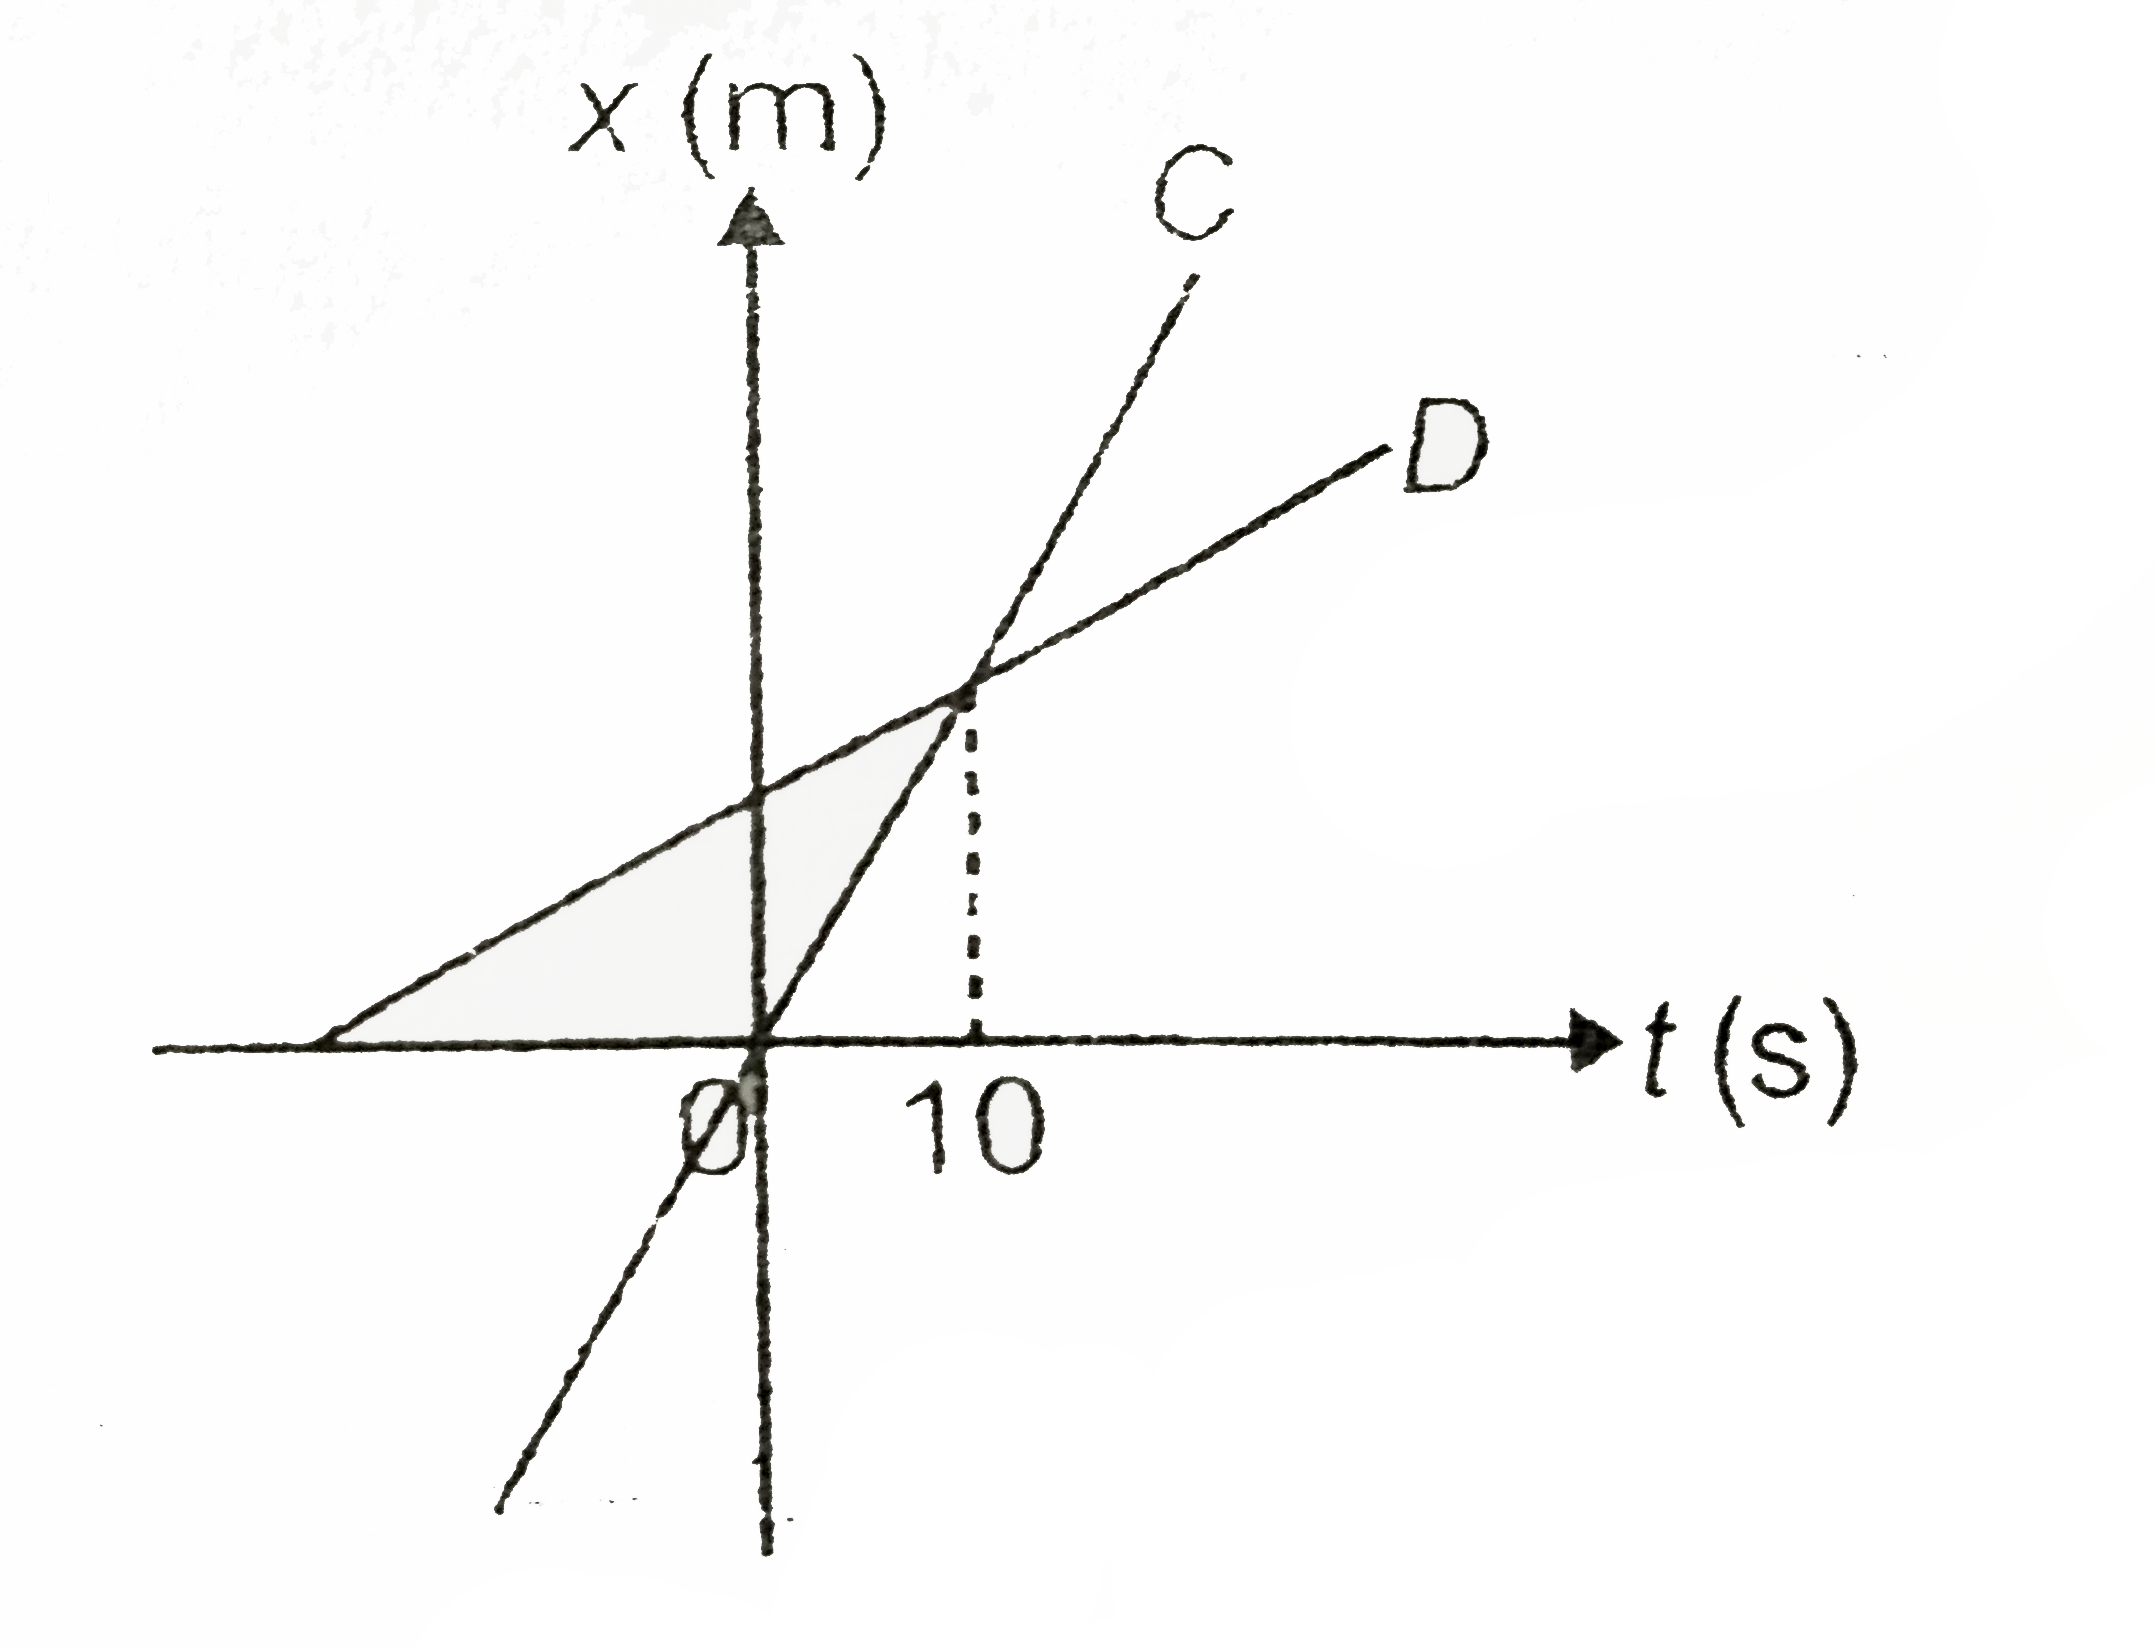
At t = 0 s
View SolutionThe figure shows position time graph of two riders C and D. Based on the information represented by the graph, answer the following questions.
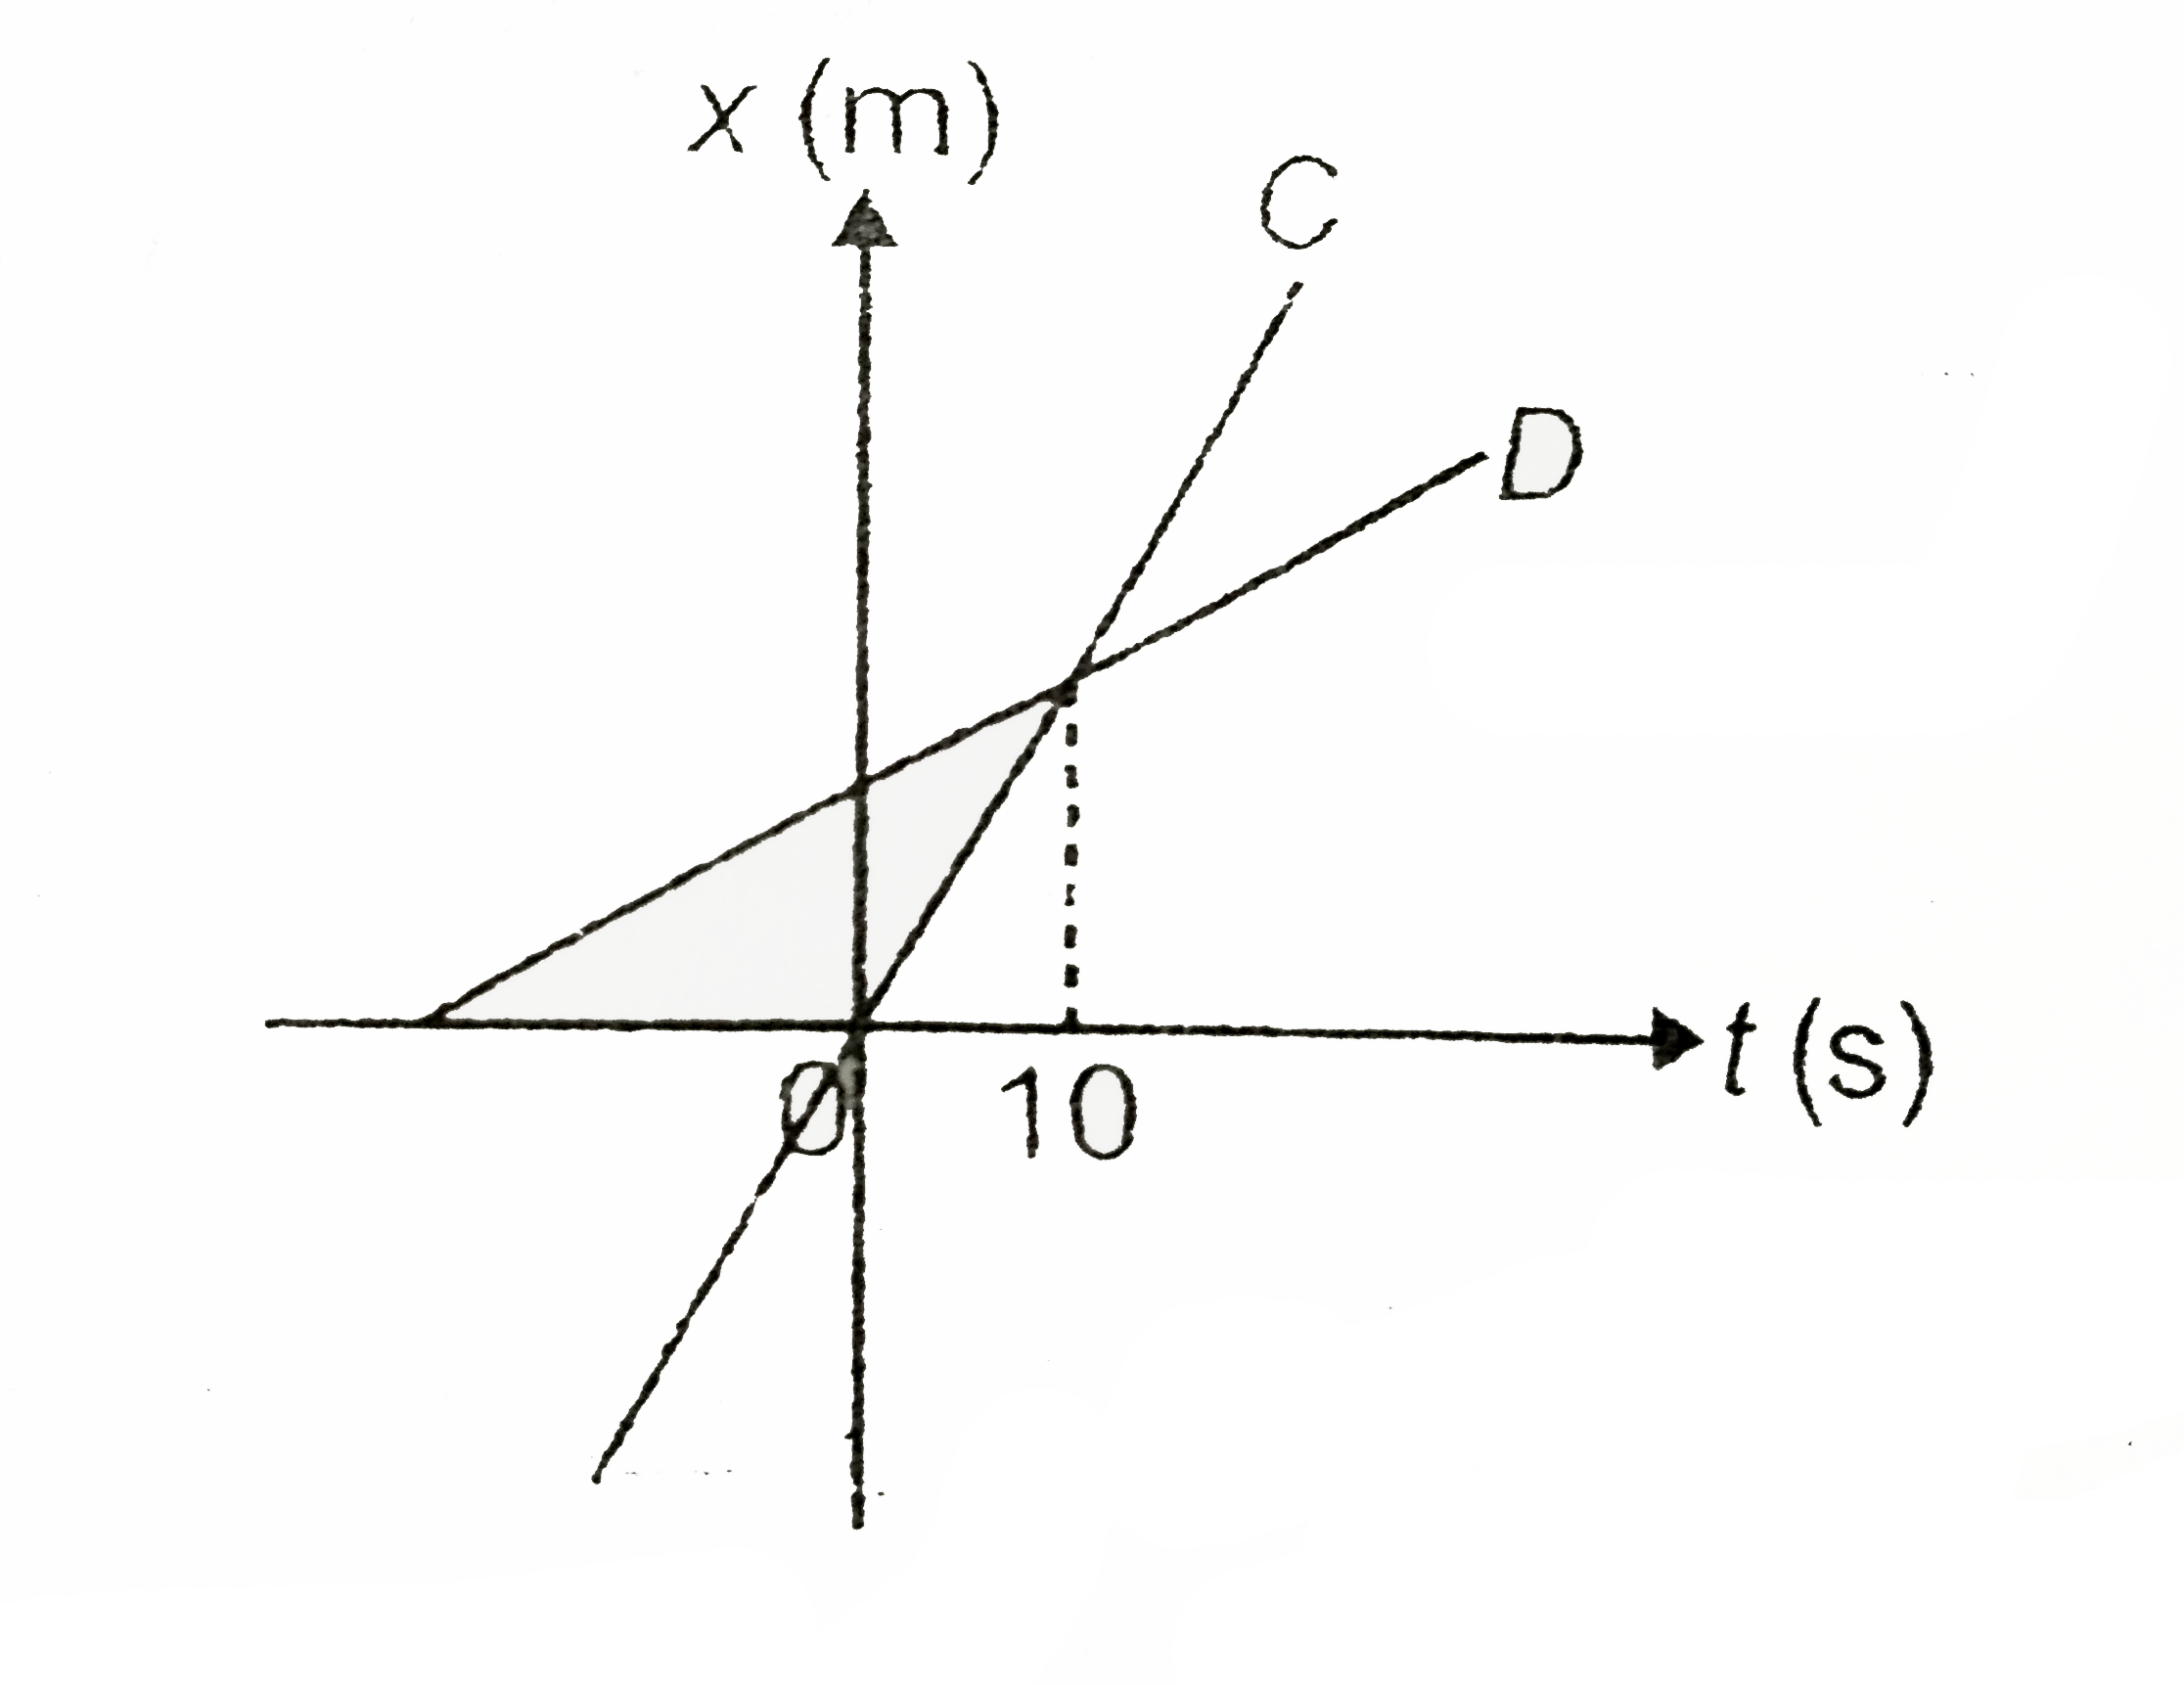
At t = 10 s
View Solution
Assignment (SECTION - D) questions and complete solutions for chapter MOTION IN STRAIGHT LINE of AAKASH INSTITUTE ENGLISH of Class 12