Complete Solutions to Exercise (Subjective Problems (Short Answer Type)) of chapter DATA HANDLING of Class 6 book with complete answers and questions
| Class 6 | MATHS |
| Chapter | DATA HANDLING |
| MTG IIT JEE FOUNDATION | Exercise (Subjective Problems (Short Answer Type)) |
| Number Of Questions | 12 |
| Academic Year | 2023-24 |
The sales of rings on different days of the week is shown below. Based on the information given in pictograph, answer the following questions.
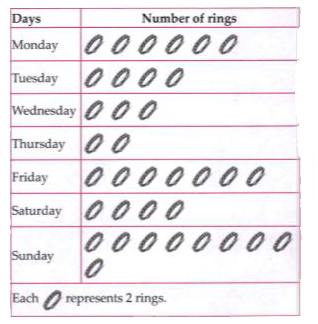
How many rings were sold on Tuesday ?01:48View SolutionThe sales of rings on different days of the week is shown below. Based on the information given in pictograph, answer the following questions.
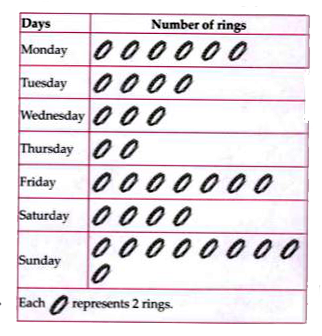
On which day, the maximum number of rings were sold ?01:16View SolutionThe birth rate per thousand of five countries over a period of time is shown below.

Country with the highest and lowest birth respectively is:01:11View SolutionA dice was thrown 26 times and following outcomes were noted.
4, 3, 3, 2, 5, 4, 4, 6, 1, 2, 2, 3, 4, 6, 2, 3, 3, 4, 5, 6, 3, 2, 1, 3, 4, 3.
Represent the above data in the tubular form using tally marks.06:34View SolutionThe heights (in cm) of 20 boys of Class VI are : 140, 138, 139, 140, 140, 147, 139, 139, 139, 139, 140, 147, 138, 140, 139, 140, 147, 147, 138, 139. Which height has the maximum frequency and the minimum frequency in the given data ?
05:01View SolutionDraw a pictograph for representing the number of students in each class based on the given data.
 03:16View Solution
The data for the various height (in ft) of students in a class is given below :
`"4 5 2 2 5 4 3 4 5 5 3 2 4 2 2 2 2 3"`
Make a table using tally marks.06:24View SolutionThe given bar graph shows the marks obtained by students in a Science test.
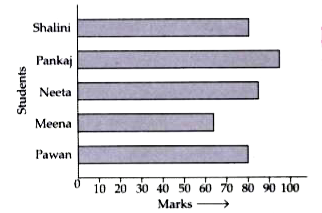
Who scored the highest marks in the test ? Whats in the score ?01:05View SolutionGiven below is the pictorial representation of various kind of apples in a food store which were sold.
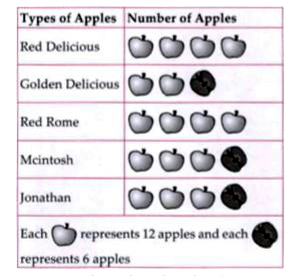
What is the total number of apples sold for golden delicious and Jonathan varieties ?03:13View SolutionGiven below is the pictorial representation of various kind of apples in a food store which were sold.
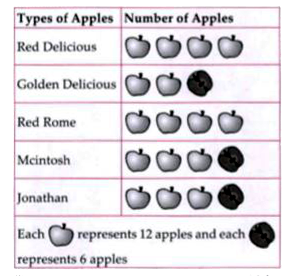
How many apples were sold of Mcintosh variety ?02:27View SolutionGiven below data is the marks in maths test of 30 children of Class VI out of 35.
32, 28, 27, 31, 35, 32, 35, 30, 32, 35, 27, 32, 30, 31, 33, 35, 34, 27, 30, 33, 31, 34, 27, 28, 32, 30, 27, 30, 31.
Arrange the data in decreasing order in frequency table using tally marks.02:56View SolutionDraw a pictograph to represent the data given below :
 02:26View Solution
Exercise (Subjective Problems (Short Answer Type)) questions and complete solutions for chapter DATA HANDLING of MTG IIT JEE FOUNDATION of Class 6
All Exercises from MTG IIT JEE FOUNDATION Class 6 MATHS DATA HANDLING
- Exercise (Assertion & Reason Type )
- Exercise (Comprehension Type )
- Exercise (Match the following)
- Exercise (Multiple Choice Questions) Level -1
- Exercise (Multiple Choice Questions) Level -2
- Exercise (Subjective Problems (Integer/Numerical Value Type )
- Exercise (Subjective Problems (Long Answer Type)
- Exercise (Subjective Problems (Short Answer Type))
- Exercise (Subjective Problems (Very Short Answer Type))
- Illustrations
- NCERT Section (Exercise 9.1)
- NCERT Section (Exercise 9.2)
- NCERT Section (Exercise 9.3)
- NCERT Section (Exercise 9.4)
- Olympiad/HOTS Corner
- Solved Examples
