Complete Solutions to Solved Examples of chapter DATA HANDLING of Class 6 book with complete answers and questions
| Class 6 | MATHS |
| Chapter | DATA HANDLING |
| MTG IIT JEE FOUNDATION | Solved Examples |
| Number Of Questions | 37 |
| Academic Year | 2023-24 |
In a survey of 20 families, each family is found to have the following number of children. 1, 2, 2, 3, 2, 3, 3, 4, 1, 1, 4, 4, 2, 2, 3, 1, 5, 1, 1, 2
Represent the data in tabular form using tally marks.02:02View SolutionStudy the bar graph and answer the following questions.
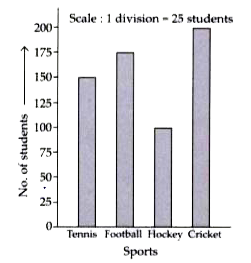
Which is the most popular sport ?01:07View SolutionStudy the bar graph and answer the following questions.
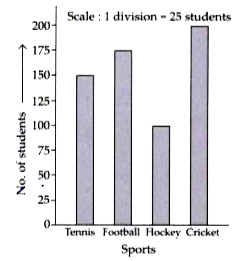
Which sport is preferred least ?01:28View SolutionStudy the bar graph and answer the following questions.
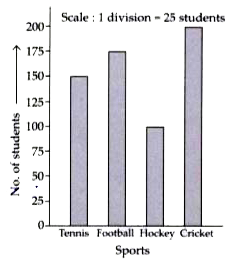
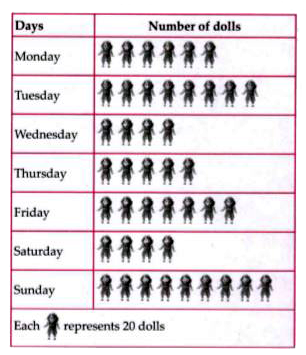
What is the difference between number of students playing football and hockey ?01:11View SolutionThe sale of number of dolls on different days of a week in a shopping mall is shown below :
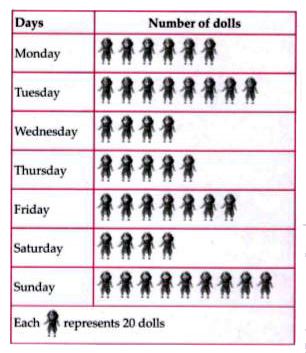
Observe the pictograph and answer the following questions.
How many dolls were sold on Tuesday ?01:22View SolutionThe sale of number of dolls on different days of a week in a shopping mall is shown below :
Observe the pictograph and answer the following questions.
On which day maximum number of dolls were sold ?01:33View SolutionThe sale of number of dolls on different days of a week in a shopping mall is shown below :
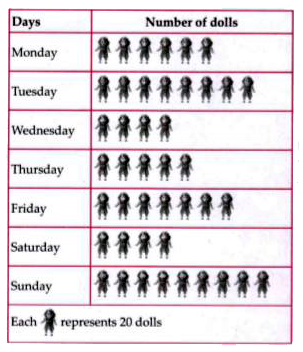
Observe the pictograph and answer the following questions.
Find the total number of dolls sold in first three days of the week.02:16View SolutionThe number of benches in each class of a school is depicted by the pictograph.
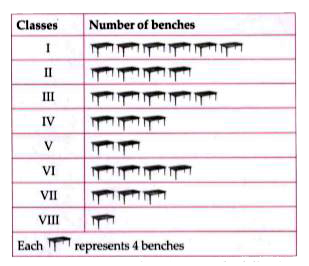
Observe the pictograph and answer the following questions.
How many benches are there in class VI ?01:01View SolutionThe number of benches in each class of a school is depicted by the pictograph.
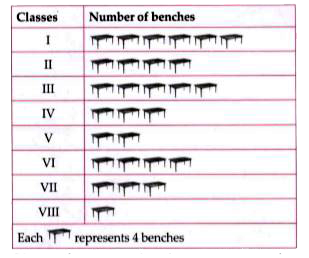
Observe the pictograph and answer the following questions.
Which class has maximum number of benches ? Also, find the number of benches in that class ?01:37View SolutionThe number of benches in each class of a school is depicted by the pictograph.
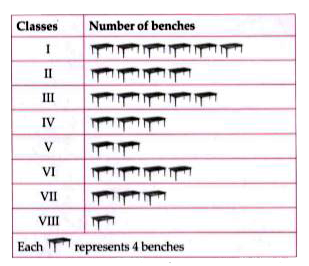
Observe the pictograph and answer the following questions.
Which class has least number of benches ?01:15View SolutionRead the bar graph and answer the questions.
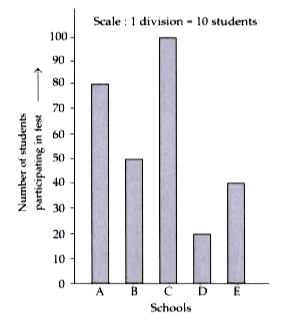
From which school 80 students participated ?01:07View SolutionRead the bar graph carefully and answer the following questions.
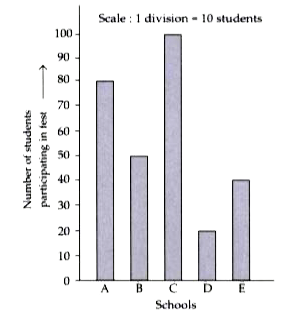 How may students of school B participated in the fest ?01:16View Solution
Read the bar graph carefully and answer the following questions.
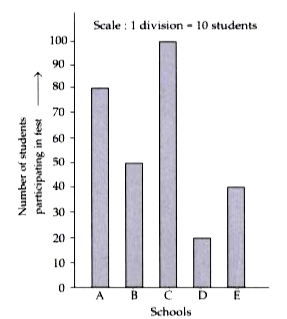 From which school maximum number of students participated ?01:16View Solution
Read the bar graph carefully and answer the following questions.
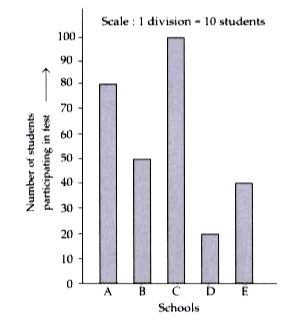 What is the difference between the numbr of students participated from school C and D ?01:19View Solution
In a village, fruit sellers sold the following number of watermelons in a particular week.
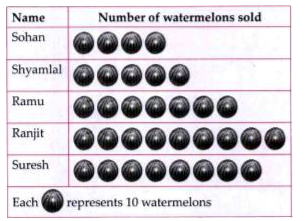
Which fruit seller sold the minimum number of watermelons ?01:55View SolutionIn a village, fruit sellers sold the following number of watermelons in a particular week.
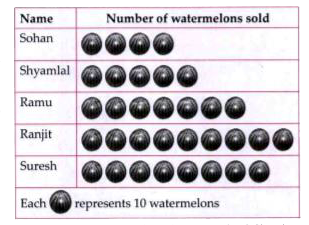
How many watermelons were sold by Suresh ?01:04View SolutionIn a village, fruit sellers sold the following number of watermelons in a particular week.
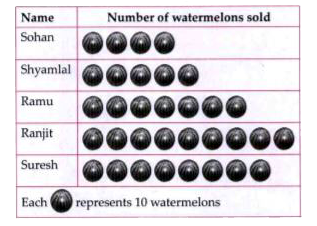
The sellers who have sold 60 or more number of watermelons are?01:29View SolutionThe weights (in kg) of 22 students of a class are given below.
44, 46., 42, 40, 44, 44, 46, 43, 43, 44, 42, 46, 44, 43, 43, 42, 40, 40, 44, 46, 46, 44
Represent the data in tabular form using tally marks.02:50View SolutionThe following data shows the number of students born in different months of a particular year of class VI. Make the bar graph based on the given information.
 03:17View Solution
Number of wrist watches manufactured by a factory in six days of a particular week is given below.
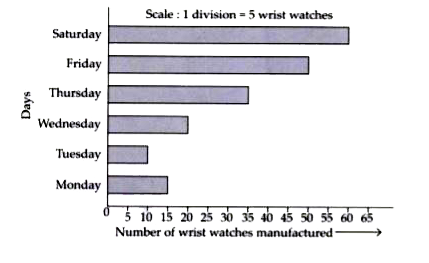
Read the bar graph and answer the following questions.
What information does the bar graph gives ?02:12View SolutionNumber of wrist watches manufactured by a factory in six days of a particular week is given below.
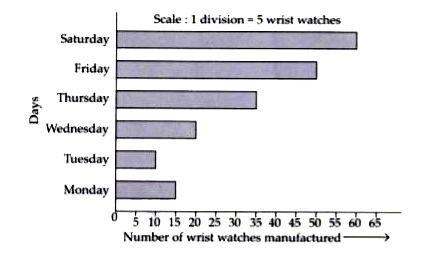
Read the bar graph and answer the following questions.
On which day, the maximum number of wrist watches were manufactured ? How many wrist watches were manufactured on that day ?01:55View SolutionNumber of wrist watches manufactured by a factory in six days of a particular week is given below.
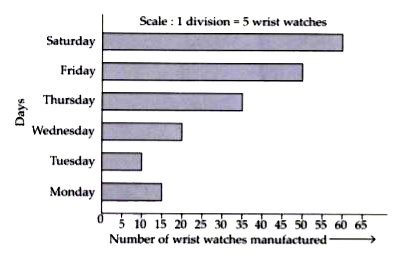
Read the bar graph and answer the following questions.
On which day, the minimum number of wrist watches were manufactured ?01:11View SolutionNumber of wrist watches manufactured by a factory in six days of a particular week is given below.
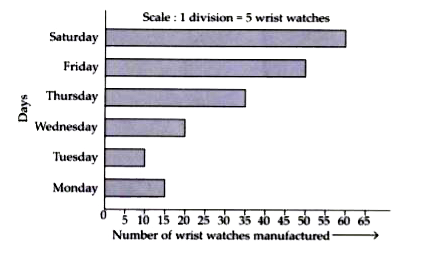
Read the bar graph and answer the following questions.
How many wrist watches were manufactured on Tuesday ?01:21View Solution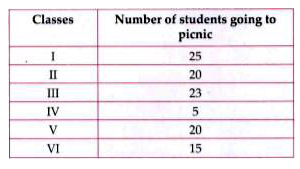
Observe the table above and calculate total number of students from class III and VI are going to the picnic.01:14View SolutionThe given pictograph represents the number of students in 5 sections of class VI.
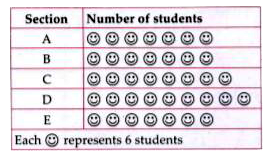
Study the given pictograph and answer the following questions.
How may students are there in section E ?01:13View SolutionThe given pictograph represents the number of students in 5 sections of class VI.
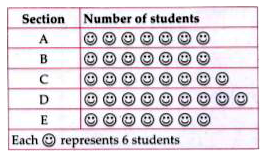
Study the given pictograph and answer the following questions.
Find the total number of students in 5 sections of Class VI.03:30View SolutionThe given pictograph represents the number of students in 5 sections of class VI.
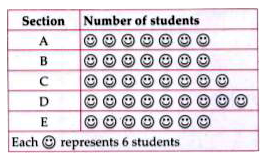
Study the given pictograph and answer the following questions.
How many less students are there in section E than section D ?02:27View SolutionThe given pictograph represents the number of students in 5 sections of class VI.
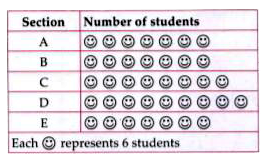
Study the given pictograph and answer the following questions.
Which section has 48 students ?02:08View SolutionThe given pictograph represents the number of students in 5 sections of class VI.
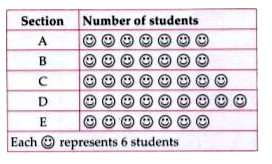
Study the given pictograph and answer the following questions.
Find the difference between the number of students in section E and the total number of students in section C and D together.03:35View SolutionIn a school library, there are books on the following subjects : English = 500, History = 700, Maths = 800, Science = 900.
Draw the pictograph for the above numerical data and answer the following questions.
How many books are there in the school library ?04:47View SolutionIn a school library, there are books on the following subjects : English = 500, History = 700, Maths = 800, Science = 900.
Draw the pictograph for the above numerical data and answer the following questions.
Which subjects have maximum and minimum number of books ?02:31View SolutionRead the given bar graph, showing the number of games played by different number of students of a school.
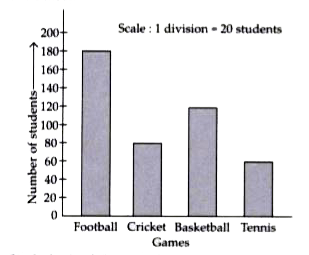
Which game is played by the maximum number of students ?01:05View SolutionRead the given bar graph, showing the number of games played by different number of students of a school.
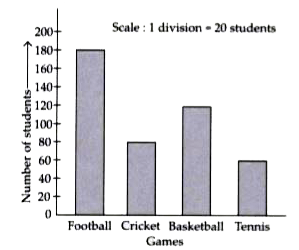
Which game is played by the minimum number of students ?01:11View SolutionRead the given bar graph, showing the number of games played by different number of students of a school.
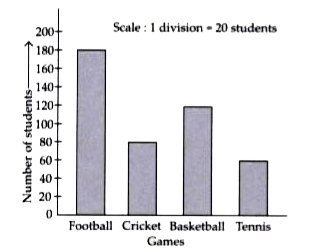
Which game is played by only 120 students ?01:02View SolutionRead the given bar graph, showing the number of games played by different number of students of a school.
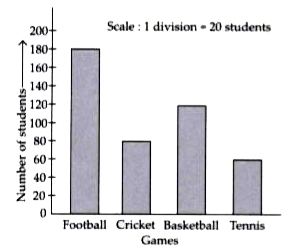
How many students play Cricket and Tennis together ?01:09View SolutionDraw a bar graph using the data given in the following table.
 02:21View Solution
The following data shows the number of students who attended the school on weekdays. Draw a bar graph to represent information by using appropriate scale.
 05:08View Solution
Solved Examples questions and complete solutions for chapter DATA HANDLING of MTG IIT JEE FOUNDATION of Class 6
All Exercises from MTG IIT JEE FOUNDATION Class 6 MATHS DATA HANDLING
- Exercise (Assertion & Reason Type )
- Exercise (Comprehension Type )
- Exercise (Match the following)
- Exercise (Multiple Choice Questions) Level -1
- Exercise (Multiple Choice Questions) Level -2
- Exercise (Subjective Problems (Integer/Numerical Value Type )
- Exercise (Subjective Problems (Long Answer Type)
- Exercise (Subjective Problems (Short Answer Type))
- Exercise (Subjective Problems (Very Short Answer Type))
- Illustrations
- NCERT Section (Exercise 9.1)
- NCERT Section (Exercise 9.2)
- NCERT Section (Exercise 9.3)
- NCERT Section (Exercise 9.4)
- Olympiad/HOTS Corner
- Solved Examples
