Complete Solutions to Illustrations of chapter DATA HANDLING of Class 6 book with complete answers and questions
| Class 6 | MATHS |
| Chapter | DATA HANDLING |
| MTG IIT JEE FOUNDATION | Illustrations |
| Number Of Questions | 20 |
| Academic Year | 2023-24 |
Given below is the marks obtained by 30 students in a unit test of class VI, out of 50.
32, 48, 40, 31, 40, 32, 25, 42, 39, 15, 48, 32, 25, 22, 32, 25, 19, 31, 48, 32, 42, 15, 25, 19, 32, 31, 25, 48, 22, 15, Represent the data in a tabular form using tally marks.04:56View SolutionPriya is playing with a die. She noted the number comes up each time after throwing it. The number appeared on the dice each time is shown below.
`{:(2,3,5,6,6,6,6,6,6,3,5,2,4),(1,3,3,5,5,4,4,6,6,3,3,2,):}`
Make a table using tally marks and answer the following questions.
Which number on the dice appeare minimum number of times ?02:17View SolutionPriya is playing with a die. She noted the number comes up each time after throwing it. The number appeared on the dice each time is shown below.
`{:(2,3,5,6,6,6,6,6,6,3,5,2,4),(1,3,3,5,5,4,4,6,6,3,3,2,):}`
Make a table using tally marks and answer the following questions.
Which number on the dice appeared maximum number of times ?02:21View SolutionPriya is playing with a die. She noted the number comes up each time after throwing it. The number appeared on the dice each time is shown below.
`{:(2,3,5,6,6,6,6,6,6,3,5,2,4),(1,3,3,5,5,4,4,6,6,3,3,2,):}`
Make a table using tally marks and answer the following questions.
How many times the number '4' appeared ?02:27View SolutionFollowing data shows the favourite fast food of 20 students of class VI.
Burger, Burger, Pizza, Momos, Sandwich, Momos, Pizza, Burger, Sandwich, Burger, Pizza, Pizza, Sandwich, Momos, Burger, Sandwich, Momos , Pizza, Sandwich, Burger.
Prepare a table using tally marks and answer the following questions.
Which two fast foods are liked equally by the students ?02:13View SolutionFollowing data shows the favourite fast food of 20 students of class VI.
Burger, Burger, Pizza, Momos, Sandwich, Momos, Pizza, Burger, Sandwich, Burger, Pizza, Pizza, Sandwich, Momos, Burger, Sandwich, Momos , Pizza, Sandwich, Burger.
Prepare a table using tally marks and answer the following questions.
Which fast food is liked most by the students ?02:17View SolutionFollowing data shows the favourite fast food of 20 students of class VI.
Burger, Burger, Pizza, Momos, Sandwich, Momos, Pizza, Burger, Sandwich, Burger, Pizza, Pizza, Sandwich, Momos, Burger, Sandwich, Momos , Pizza, Sandwich, Burger.
Prepare a table using tally marks and answer the following questions.
Which fast food is liked least by the students ?02:45View SolutionThe pictograph shows the number of bicycles made by a factory during the four weeks of a month. Answer the following questions.
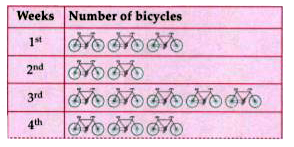

How many bicycles were made by the factory during `1^(st)` week ?01:02View SolutionThe pictograph shows the number of bicycles made by a factory during the four weeks of a month. Answer the following questions.
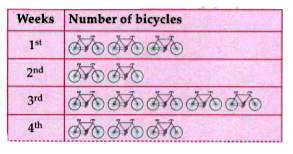

What is the difference between the number of bicycles made during `3^("rd")` week and `4^(th)` week ?01:21View SolutionThe pictograph shows the number of bicycles made by a factory during the four weeks of a month. Answer the following questions.
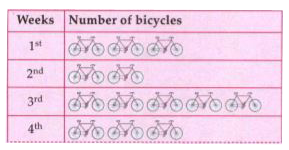

In which week maximum number of bicycles were made ?01:43View SolutionPrepare a pictograph for the given data that shows the pocket money of six children.
 03:12View Solution
The given bar graph represents the sale of cars in five different states in a month.
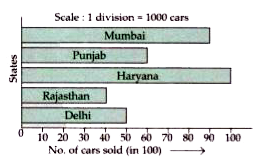
Which state sold maximum number of cars ?01:57View SolutionThe given bar graph represents the sale of cars in five different states in a month.
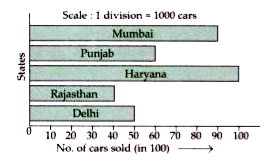 What is the difference between the numbre of cars sold in Mumbai and Punjab ?02:20View Solution
The given bar graph represents the sale of cars in five different states in a month.
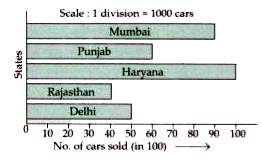
Which state sold 5000 cars ?01:18View SolutionGiven bar graph shows the number of books of difference subjects kept in a library. Study it and answer the following questions :
How many Hindi books are kept in the library ?01:24View SolutionGiven bar graph shows the number of books of difference subjects kept in a library. Study it and answer the following questions :
Are number of books of Science more than that of Mathematics ? If yes, then by how much ?02:04View SolutionGiven bar graph shows the number of books of difference subjects kept in a library. Study it and answer the following questions :
Which subject has minimum number of books in the library ?01:30View SolutionThe table represents number of tourists visiting a zoo for 5 months.

Make a bar graph representing the above information.02:36View SolutionThe are cultivated under different crops in a year was as follows.
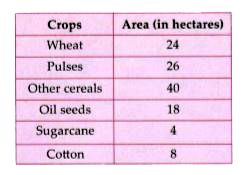
Which crop was cultivated in the smallest area ?01:15View SolutionLook at the frequency chart representing the number of books read by the class in the post month.

How many students read atleast 4 books.01:03View Solution
Illustrations questions and complete solutions for chapter DATA HANDLING of MTG IIT JEE FOUNDATION of Class 6
All Exercises from MTG IIT JEE FOUNDATION Class 6 MATHS DATA HANDLING
- Exercise (Assertion & Reason Type )
- Exercise (Comprehension Type )
- Exercise (Match the following)
- Exercise (Multiple Choice Questions) Level -1
- Exercise (Multiple Choice Questions) Level -2
- Exercise (Subjective Problems (Integer/Numerical Value Type )
- Exercise (Subjective Problems (Long Answer Type)
- Exercise (Subjective Problems (Short Answer Type))
- Exercise (Subjective Problems (Very Short Answer Type))
- Illustrations
- NCERT Section (Exercise 9.1)
- NCERT Section (Exercise 9.2)
- NCERT Section (Exercise 9.3)
- NCERT Section (Exercise 9.4)
- Olympiad/HOTS Corner
- Solved Examples
