Complete Solutions to NCERT Section (Exercise 9.3) of chapter DATA HANDLING of Class 6 book with complete answers and questions
| Class 6 | MATHS |
| Chapter | DATA HANDLING |
| MTG IIT JEE FOUNDATION | NCERT Section (Exercise 9.3) |
| Number Of Questions | 11 |
| Academic Year | 2023-24 |
The given bar graph shows the amount of wheat purchased by government during the year 1998-2002.
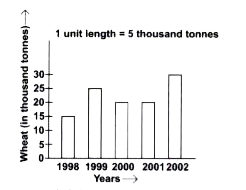
Read the bar graph and write down your observations. In which year was
the wheat production maximum ?02:23View SolutionThe given bar graph shows the amount of wheat purchased by government during the year 1998-2002.
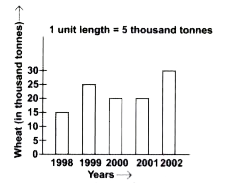
Read the bar graph and write down your observations. In which year was
the wheat production minimum ?01:40View SolutionObserve this bar graph which is showing the sale of shirts in a ready made shop from Monday to Saturday.
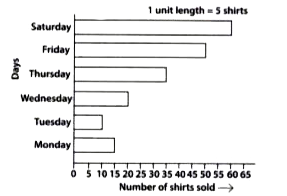
Now answer the following questions :
What information does the above bar graph give ?03:50View SolutionObserve this bar graph which is showing the sale of shirts in a ready made shop from Monday to Saturday.
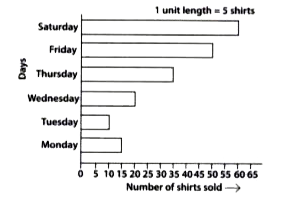
Now answer the following questions :
What is the scale chosen on the horizontal line representing number of shirts ?01:23View SolutionObserve this bar graph which is showing the sale of shirts in a ready made shop from Monday to Saturday.
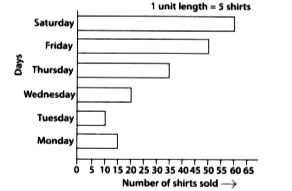
Now answer the following questions :
On which day were the maximum number of shirts sold ? How many shirts were sold on that day ?View SolutionObserve this bar graph which is showing the sale of shirts in a ready made shop from Monday to Saturday.
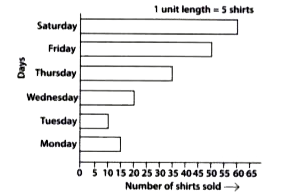
Now answer the following questions :
On which day were the minimum number of shirts sold ?01:24View SolutionObserve this bar graph which is showing the sale of shirts in a ready made shop from Monday to Saturday.
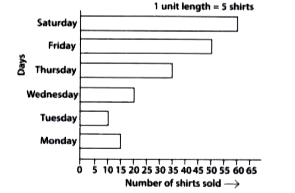
Now answer the following questions :
How many shirts were sold on Thursday ?01:07View SolutionObserve this bar graph which shows the marks obtained by Aziz in half-yearly examination in different subjects.
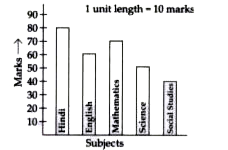
Answer the given questions.
What information does the bar graph give ?03:42View SolutionObserve this bar graph which shows the marks obtained by Aziz in half-yearly examination in different subjects.
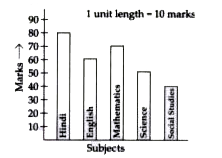
Answer the given questions.
Name the subject in which Aziz scored maximum marks.01:21View SolutionObserve this bar graph which shows the marks obtained by Aziz in half-yearly examination in different subjects.
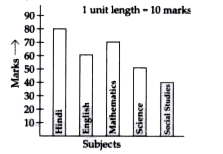
Answer the given questions.
Name the subject in which he has scored minimum marks.01:15View SolutionObserve this bar graph which shows the marks obtained by Aziz in half-yearly examination in different subjects.
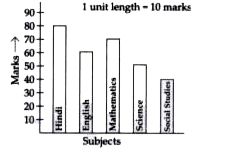
Answer the given questions.
State the name of the subjects and marks obtained in each of them.03:04View Solution
NCERT Section (Exercise 9.3) questions and complete solutions for chapter DATA HANDLING of MTG IIT JEE FOUNDATION of Class 6
All Exercises from MTG IIT JEE FOUNDATION Class 6 MATHS DATA HANDLING
- Exercise (Assertion & Reason Type )
- Exercise (Comprehension Type )
- Exercise (Match the following)
- Exercise (Multiple Choice Questions) Level -1
- Exercise (Multiple Choice Questions) Level -2
- Exercise (Subjective Problems (Integer/Numerical Value Type )
- Exercise (Subjective Problems (Long Answer Type)
- Exercise (Subjective Problems (Short Answer Type))
- Exercise (Subjective Problems (Very Short Answer Type))
- Illustrations
- NCERT Section (Exercise 9.1)
- NCERT Section (Exercise 9.2)
- NCERT Section (Exercise 9.3)
- NCERT Section (Exercise 9.4)
- Olympiad/HOTS Corner
- Solved Examples
