Complete Solutions to All Questions of chapter DATA HANDLING-II (HISTOGRAMS) of Class 8 book with complete answers and questions
| Class 8 | MATHS |
| Chapter | DATA HANDLING-II (HISTOGRAMS) |
| Mathematics | All Questions |
| Number Of Questions | 14 |
| Academic Year | 2023-24 |
The following table gives the marks scored by 100 students in an entrance examination.

View SolutionThe following is the distribution of weights (in kg) of 50 persons: Marks:, 50-55, 55-60, 60-65, 65-70, 70-75, 75-80, 80-85, 85-90 No. of Person, 12, 8, 5, 4, 5, 7, 6, 3 Draw a histogram for the above data.
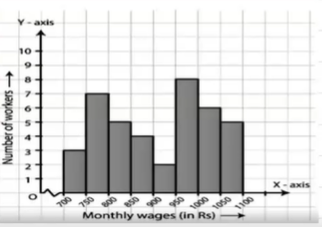
View SolutionThe following histogram shows the monthly wages (in Rs.) of workers in a factory: Figure Find the largest and least number of workers and also their wages in rupees.

View SolutionGiven below is the frequency distribution of the heights of 50 students of a class: Class Interval:, 140-145, 145-150, 150-155, 155-160, 160-165 Frequency:, 8, 12, 18, 10, 5 Draw a histogram representing the above data.
View SolutionDraw a histogram of the following data: Class interval: 10-15 15-20 20-25 25-30 30-35 35-40 Frequency: 30 98 80 58 29 50
View SolutionNumber of workshops organized by a school in different areas during the last five years are as follows: years, No. of workshops 1995-1996 1996-1997 1997-1998 1998-1999 1999-2000, 25 30 42 50 65 Draw a histogram representing the above data.
View SolutionIn a hypothetical sample of 20 people the amounts of money with them were found to be as follows: 114,108,100,98,101,109,117,119,126,131,136,143,156, 169,182,195,207,219,235,118. Draw the histogram of the frequency distribution (taking one of the class intervals as 50-100)
View SolutionConstruct a histogram for the following data: `{:("Monthly school fee (in Rs)", 30-60, 60-90, 90-120, 120-150, 150-180, 180-210, 210-240), ("No. of schools", 5, 12, 14, 18, 10, 9, 4):}`
View SolutionDraw a histogram for the daily earnings of 30 drug stores in the following table: Daily earning (in Rs.), 450-500, 500-550, 550-600, 600-650, 650-700 No. of Stores:, 16, 10, 7, 3, 1
View SolutionDraw a histogram to represent the following data: Monthly salary (in Rs.), Number of teachers 5600-5700 5700-5800 5800-5900 5900-6000 6000-6100 6100-6200 6200-6300 6300-6400, 8 4 3 5 2 3 1 2
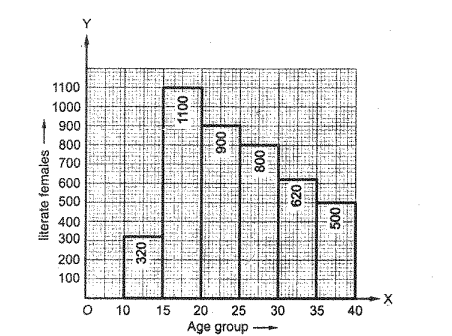
View SolutionThe following histogram shows the number of literate females in the age group of 10 to 40 years in a town:

Figure Write the age group in which the number of literate female is the highest. What is the class width? What is the lowest frequency? What are the class marks of the classes? In which age group literate females are the least?
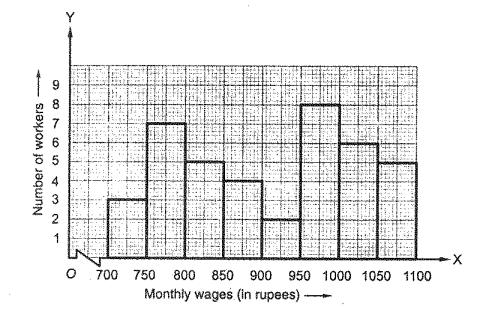
View SolutionThe following histogram shows the monthly wages (in Rs.) of workers in a factory:

(Figure) In which wage-group the largest number of workers are being kept? What is their number? What wages are the least number of workers getting? What is the number of such workers? What is the total number of workers? What is the factory size?
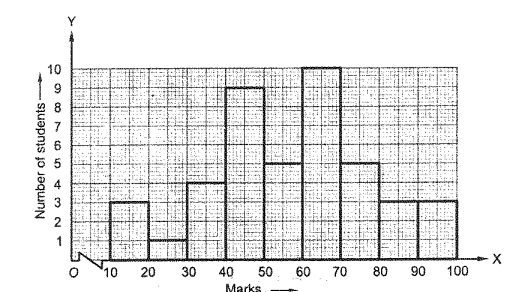
View SolutionBelow is the histogram depicting marks obtained by 43 students of a class: Write the number of students getting the highest marks. What is the class size? Figure:

View SolutionThe weekly wages (in Rs.) of 30 workers in a factory are give: 830,835,890,810,835,836,869,845,898,890, 820,860,832,833,855,845,804,808,812,,840,885,835,835,836,878,840,868,890,806,840 Mark a frequency table with intervals as 800-810, 810-820 and so on, using tally marks.
View Solution
All Questions questions and complete solutions for chapter DATA HANDLING-II (HISTOGRAMS) of RD SHARMA MATHS (HINGLISH) of Class 8