Complete Solutions to Exercise 21C of chapter DATA HANDLING of Class 8 book with complete answers and questions
| Class 8 | MATHS |
| Chapter | DATA HANDLING |
| RS AGGARWAL | Exercise 21C |
| Number Of Questions | 11 |
| Academic Year | 2023-24 |
The top speeds of 30 different land animals have been organised into a frequency table given below:

Draw a histogram for the given data.
View SolutionThe ages (in years) of 360 patients treated in a hospital on a particular day are given below:

Draw a histogram for the given data.
View SolutionDraw a histogram for the frequency distribution of the following data:

View SolutionDraw a histogram for the frequency distribution of the following data:

View SolutionDraw a histogram for the following data:

View SolutionThe following table shows the number of illitrate persons in the age group (10-58 Years) in a town. Represents the given data by means of a histogram.

View SolutionThe marks obtained (out of 20) by 30 students ofa class in a test are given below:
7,10,8,16,13,14,15,11,18,11,15,10,7,14,20,19,15,16,14,20,10,11,14,17,13,12,15,14,16,17.Prepare a frequency distribution table for the above data using class intervals of equal width in which one class interval is 3 - 8 (excluding 8 and including 4).From the freequency distribution table so obtained draw a histogram
View SolutionThe weights (in kg) of 30 students of a class are
39,43,32,37,29,26,31,45, 46,31,37,38,30,39,36,41,35,34,41,46,39,38,36,38,40,42,33,43,44,33.
Prepare a frequency distribution table using one class interval as 30-35 in which 30 is included and 35 excluded. using the above data, draw a histogram.
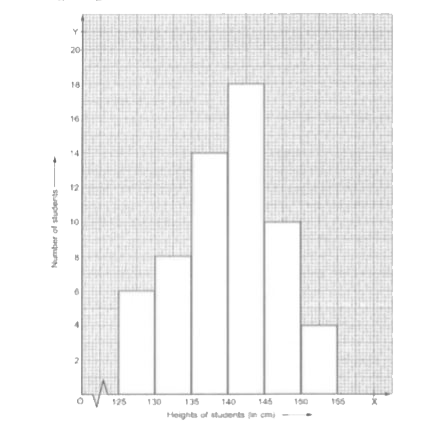
View SolutionLook at the histogram given below and answer the questions that follow:

Which class interval has the least number of students ?
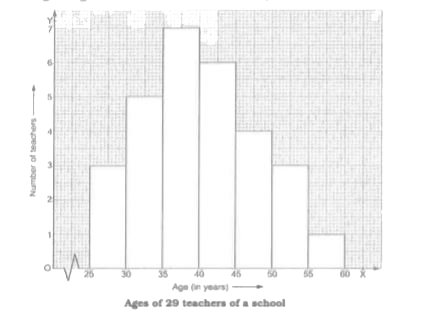
View SolutionLook at the histogram given below answer the question that follow:

(i) What information in being given by the histogram?
(ii) How many teachers are of age less than 45 years?
(iii) How many teachers are of age 40 years or more but less than 55 years?
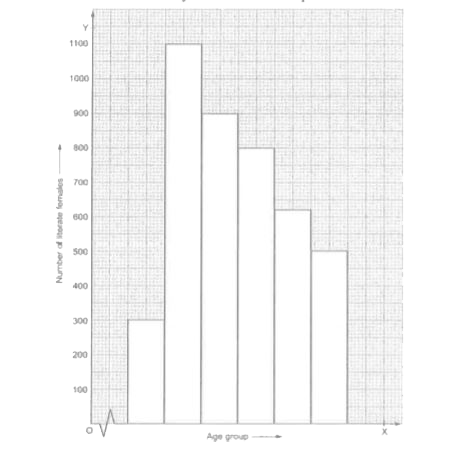
View SolutionThe histogram given below shows the number of literate females iin the age group of 10 to 40 years. Study the histogram carefully and answer the questions that follow.

(i) Write the classes, assuming that all the classes are of equal width.
(ii) What is the class width?
(iii) In which age group are the literate females the least?
(iv) In which age group is the number of literate females the highest?
View Solution
Exercise 21C questions and complete solutions for chapter DATA HANDLING of RS AGGARWAL MATHS (HINGLISH) of Class 8