Complete Solutions to EXAMPLE of chapter BAR GRAPH, HISTOGRAM AND FREQUENCY POLYGON of Class 9 book with complete answers and questions
| Class 9 | MATHS |
| Chapter | BAR GRAPH, HISTOGRAM AND FREQUENCY POLYGON |
| RS AGGARWAL | EXAMPLE |
| Number Of Questions | 11 |
| Academic Year | 2023-24 |
Represent the following frequency distribution by means of a histogram:

View SolutionDraw a histogram of the following distribution:

View SolutionDepict the following frequency distribution by a histogram:

View SolutionThe following table shows the number of literate females in the age group (10-57 years) in a village:

Draw a histogram to represent the above data.
View SolutionThe lengths of 62 leaves of a plant are measured in millimetres and the data is represented in the following table:

Draw a histogram to represent the above given data.
View SolutionFollowing is the frequency distribution of the total marks obtained by the students of all sections of a class in an examination:

Draw a histogram for the above given distribution.
View SolutionA random survey of the number of children of various age groups playing in a park was found as follows:

Draw a histogram to represent the above given data.
View SolutionFollowing table shows a frequency distribution for the speeds of cars passing througha particular spot on a highway:

Draw a histogram and frequency polygon representing the above data.
View SolutionThe daily pocket expenses of `150` students in a school are given below:

Construct a frequency polygon representing the above data.
View SolutionDraw the frequency polygon representing the following frequency distribution:

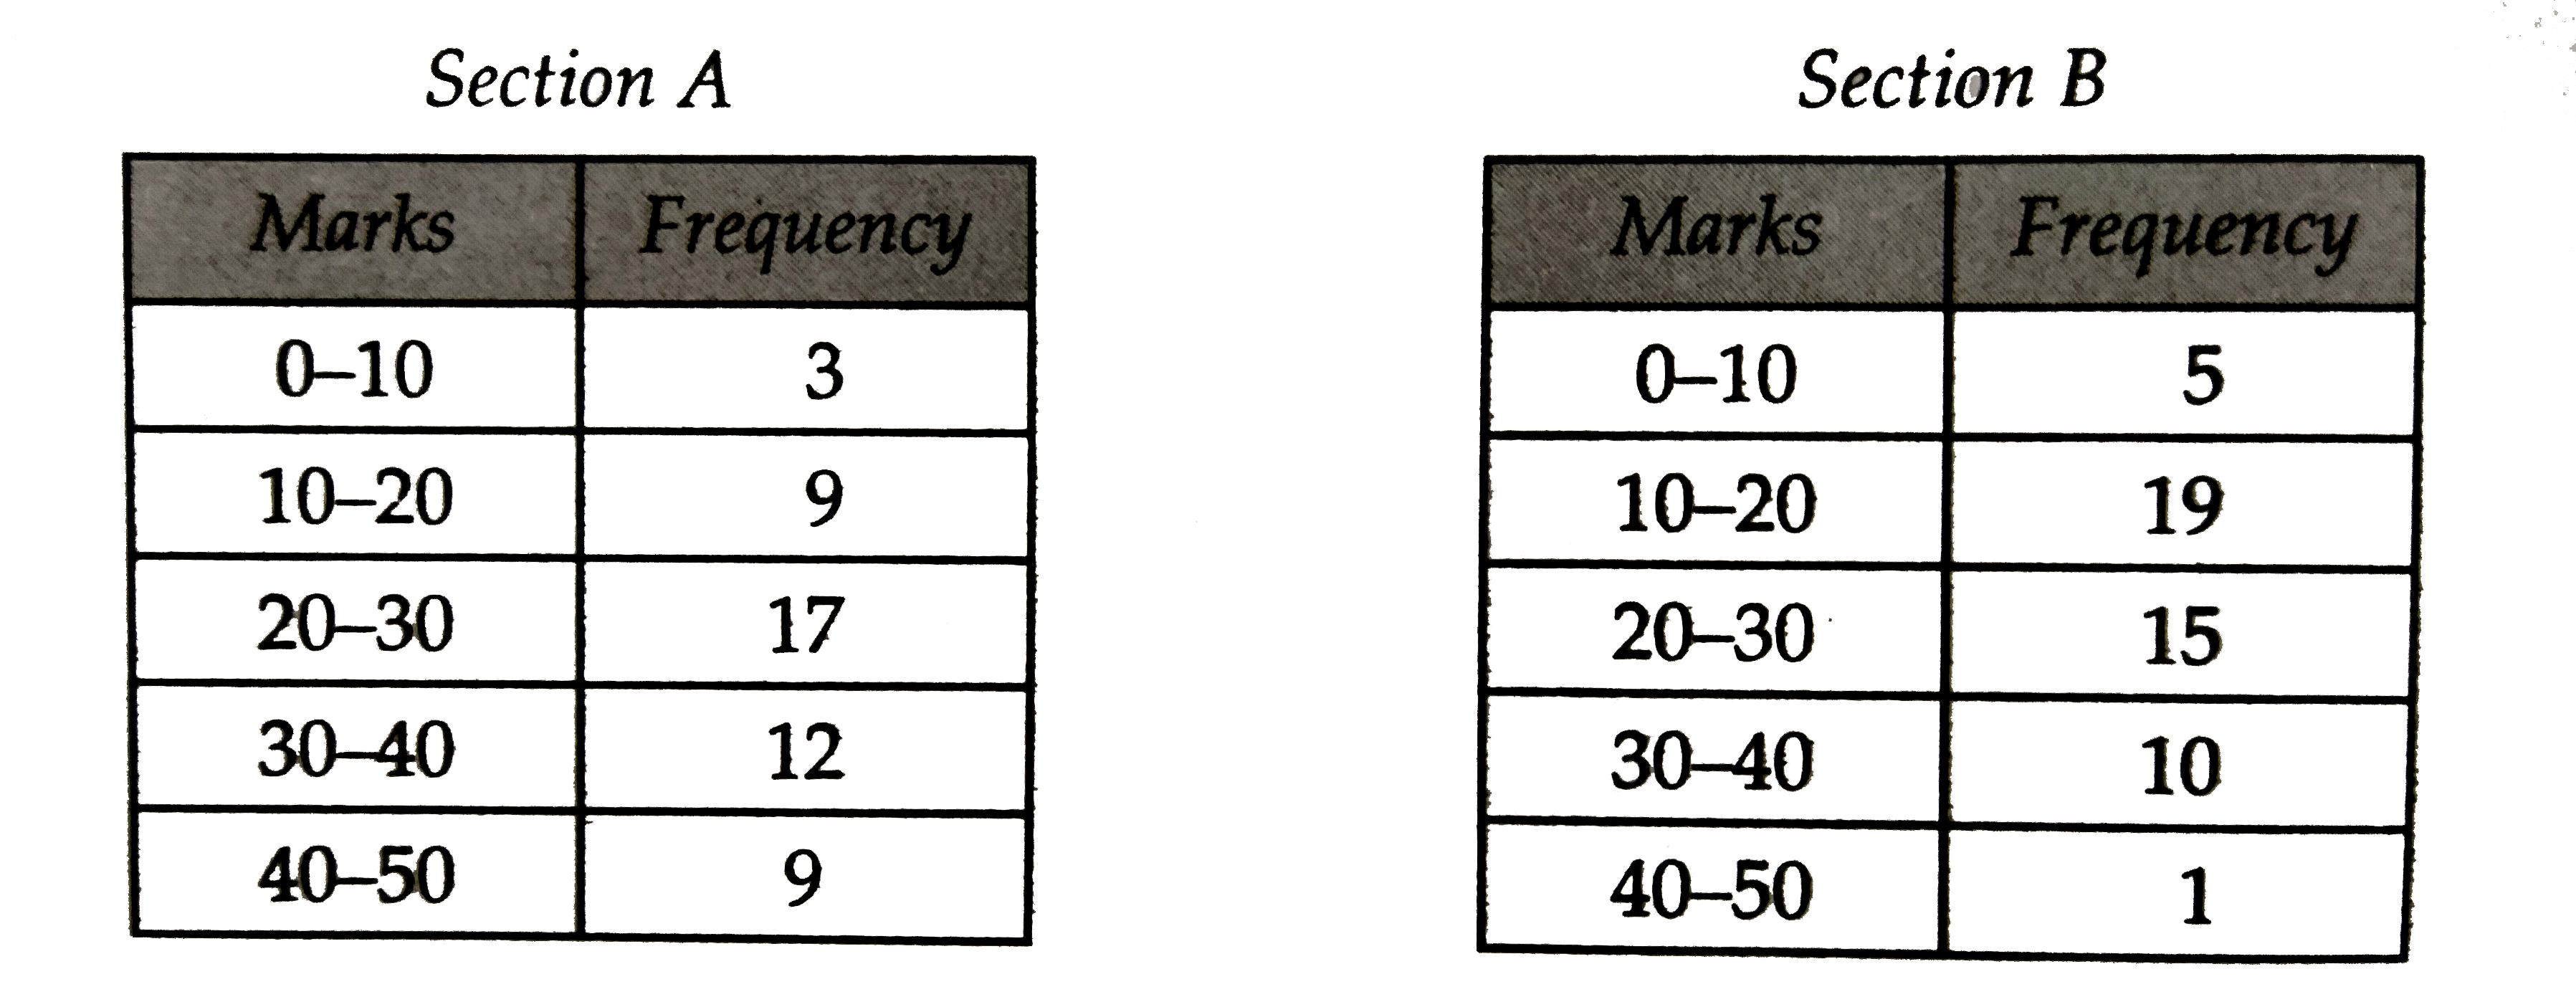
View SolutionThe following two tables give the distribution of students of two sections according to the marks obtained by them:

Represent the marks of both the sections on the same graph by two frequency polygons.
View Solution
EXAMPLE questions and complete solutions for chapter BAR GRAPH, HISTOGRAM AND FREQUENCY POLYGON of RS AGGARWAL MATHS (HINGLISH) of Class 9