The following table shows the number of literate females in the age group (10-57 years) in a village:

Draw a histogram to represent the above data.
The given frequency distribution is in inclusive form. So, first we convert it into exclusive form, as shown below.
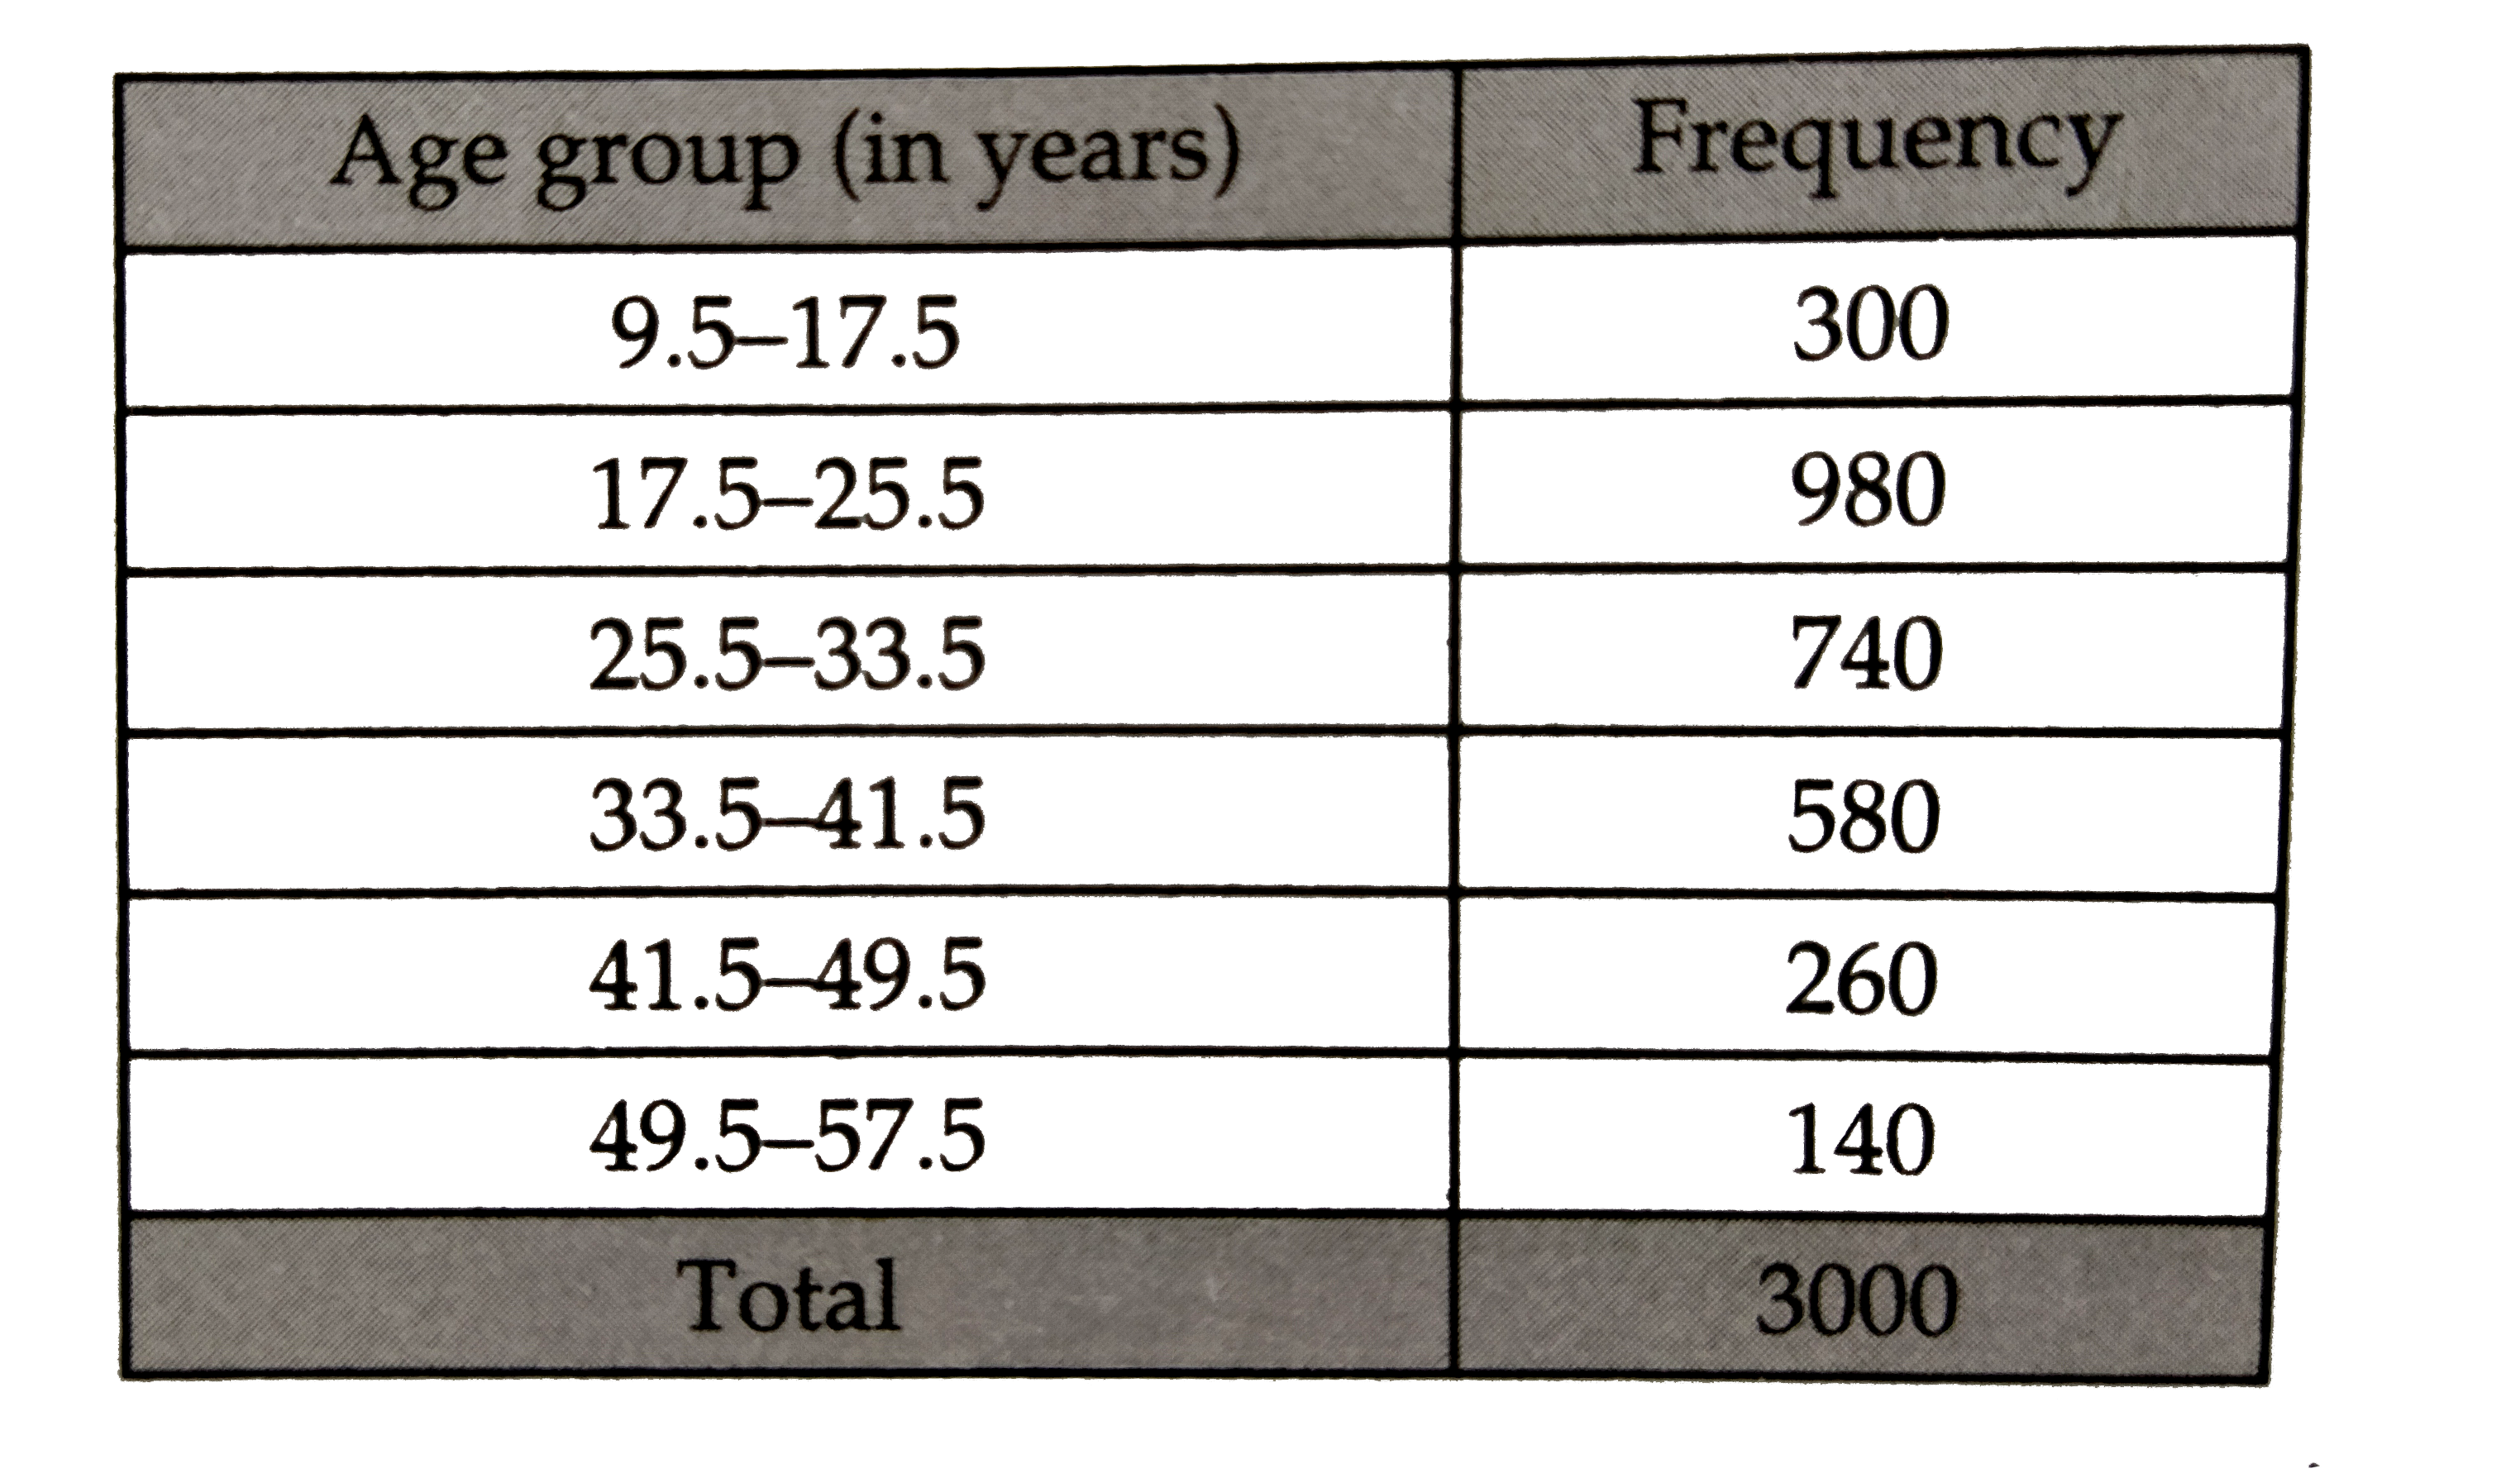
We represent the class intervals along the x-axis on a suitable scale and mark frequencies along the y-axis on another suitable scale.
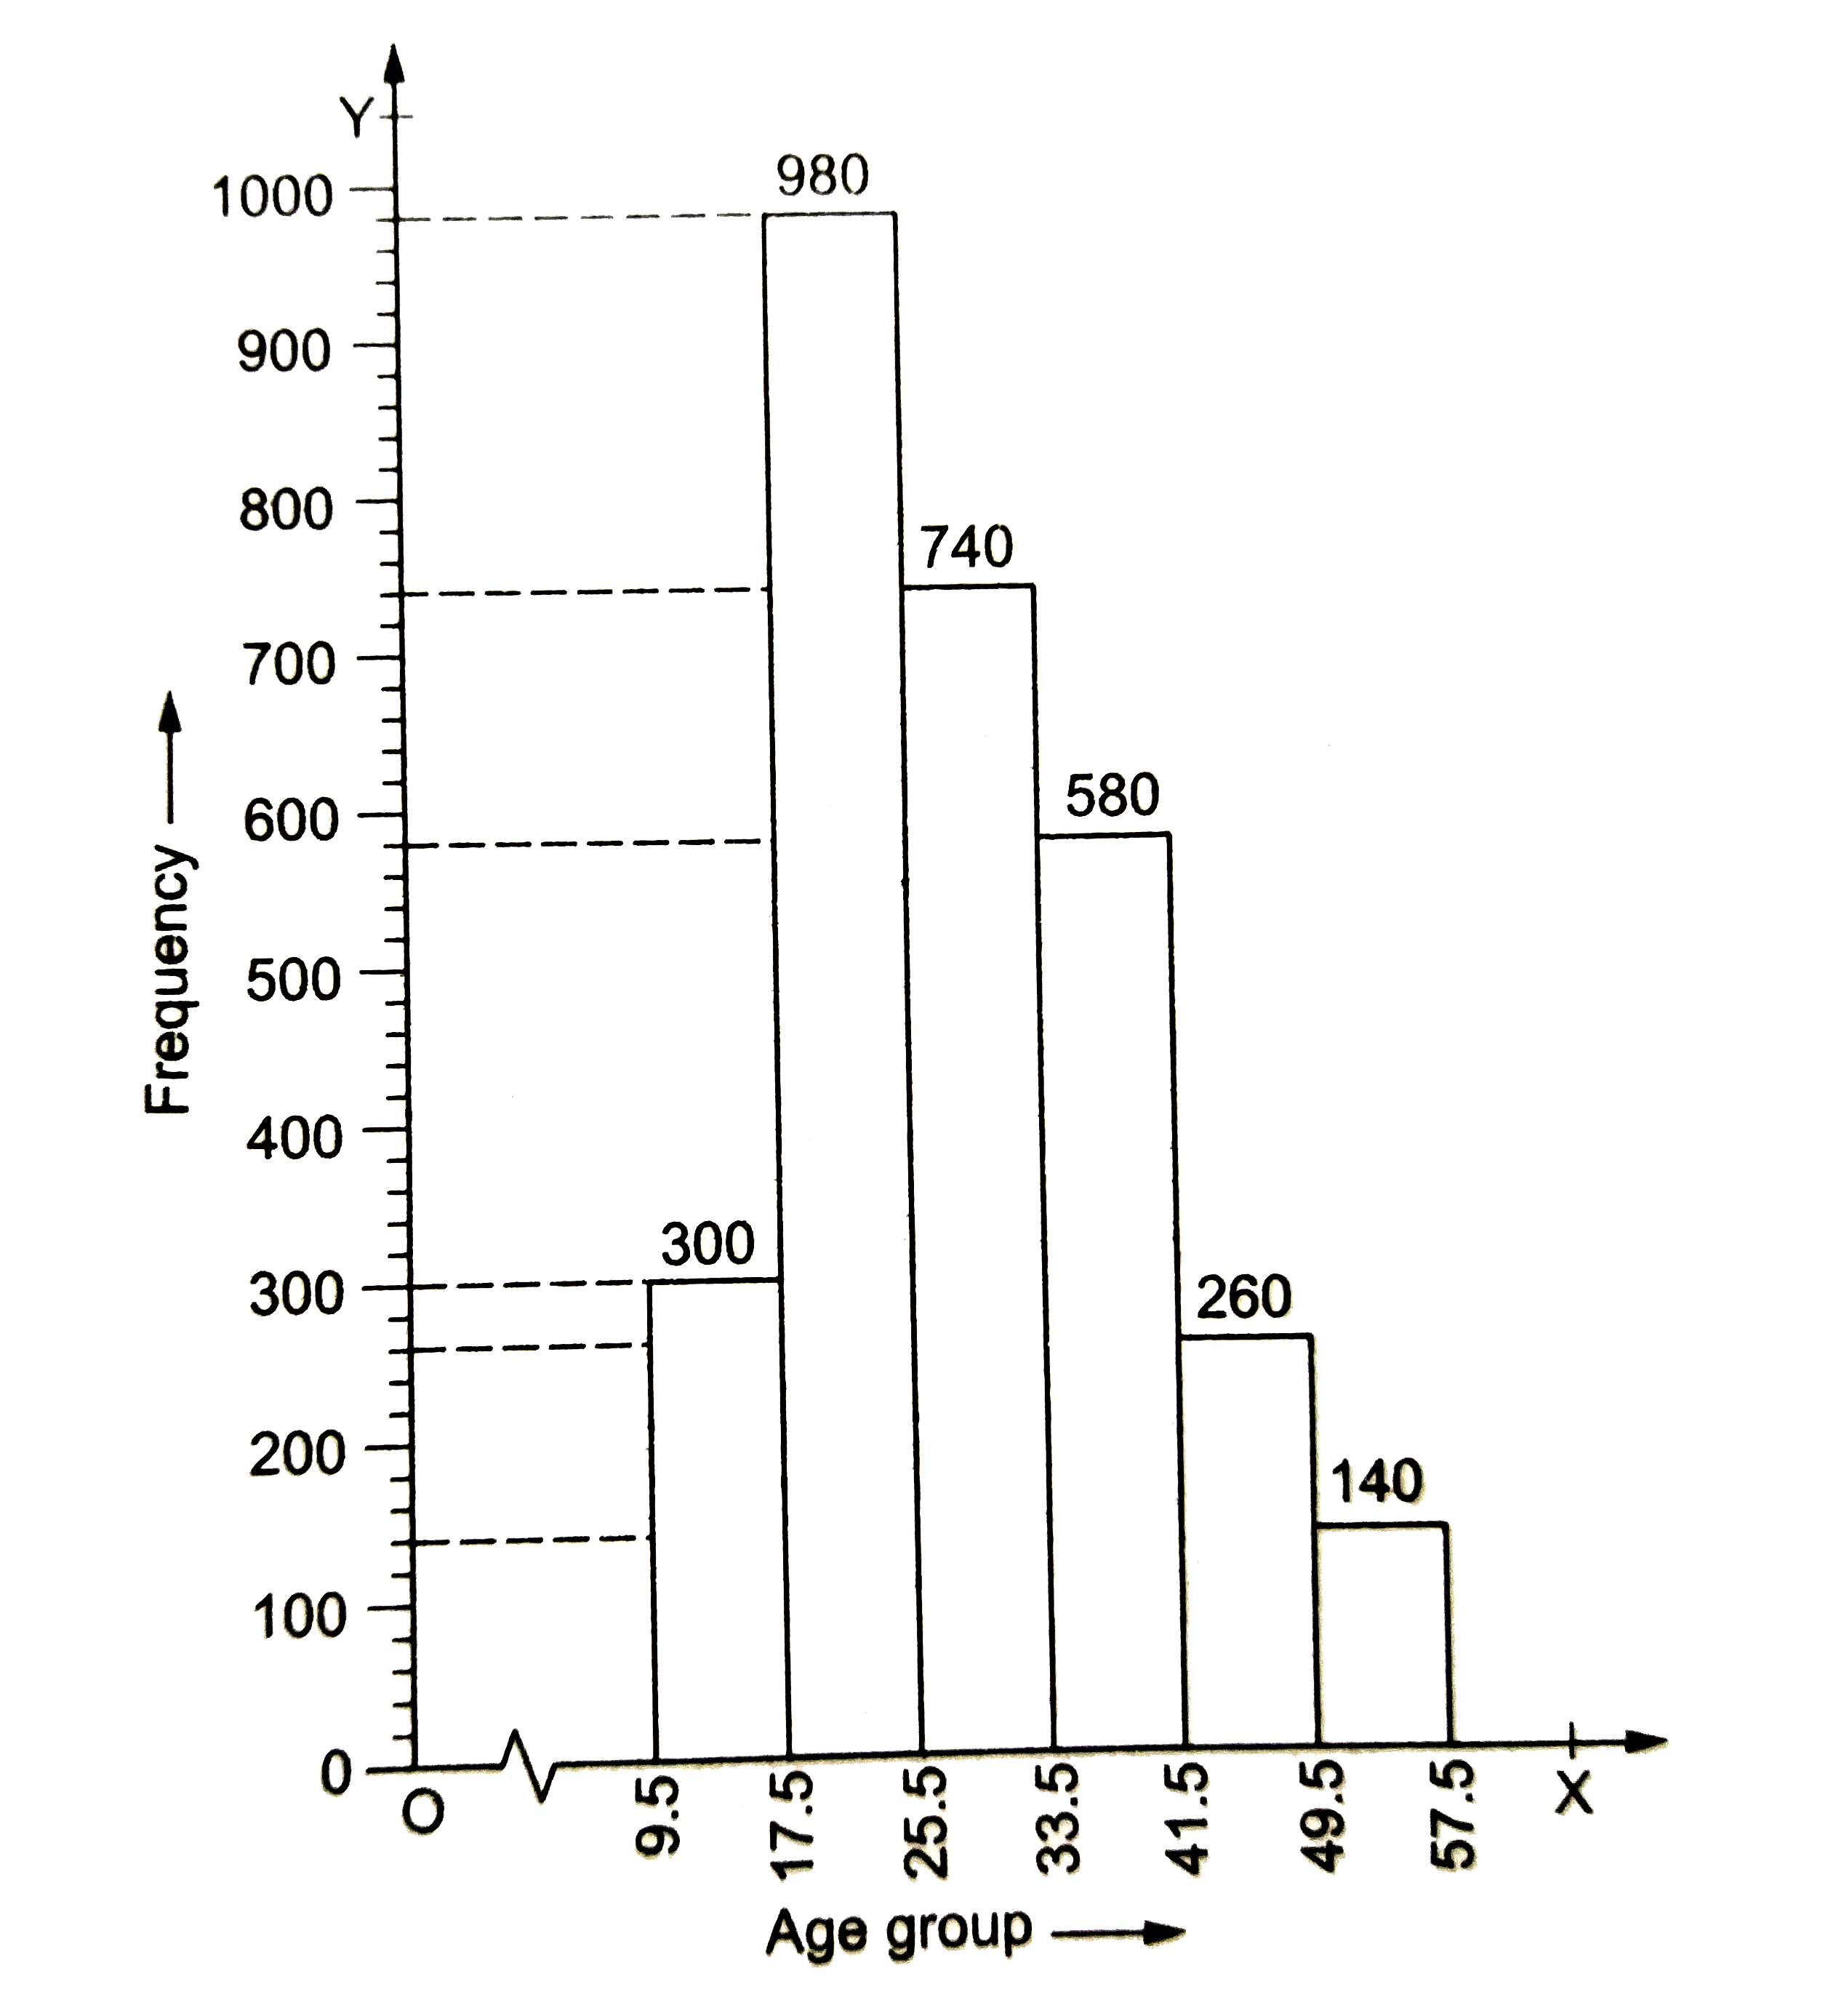
Since reading along the x-axis do not start with 0, we use a kink 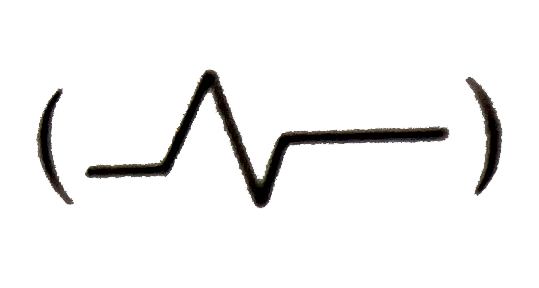 at the origin.
We construct rectangles with class intervals as bases and the corresponding frequencies as heights. Thus, we obtain the histogram as shown just above.
Topper's Solved these Questions
- BOOK - RS AGGARWALCHAPTER - BAR GRAPH, HISTOGRAM AND FREQUENCY POLYGONEXERCISE - EXERCISE 17A12videos
BAR GRAPH, HISTOGRAM AND FREQUENCY POLYGON
- BOOK - RS AGGARWALCHAPTER - BAR GRAPH, HISTOGRAM AND FREQUENCY POLYGONEXERCISE - EXERCISE 17B16videos
BAR GRAPH, HISTOGRAM AND FREQUENCY POLYGON
- BOOK - RS AGGARWALCHAPTER - BAR GRAPH, HISTOGRAM AND FREQUENCY POLYGONEXERCISE - EXERCISE 17B16videos
BAR GRAPH, HISTOGRAM AND FREQUENCY POLYGON
- BOOK - RS AGGARWALCHAPTER - AREAS OF TRIANGLES AND QUADRILATERALSEXERCISE - Multiple Choice Questions (Mcq)16videos
AREAS OF TRIANGLES AND QUADRILATERALS
- BOOK - RS AGGARWALCHAPTER - CIRCLES EXERCISE - MULTIPLE CHOICE QUESTION(MCQ)37videos
CIRCLES
Similar Questions
Draw a histogram to represent the following data.
 View Solution
The given table presents the number of illiterate males in the age group (10-34) in a town.

Draw a histogram to represent the above data.View SolutionDraw the histogram to represent the following data.
 View Solution
The following table shows the number of illitrate persons in the age group (10-58 Years) in a town. Represents the given data by means of a histogram.
 View Solution
The below histogram shows the number of literate females in the age group of 10 to 40 years in a town.
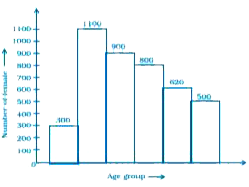
In which age group are literate females the least?View SolutionThe below histogram shows the number of literate females in the age group of 10 to 40 years in a town.
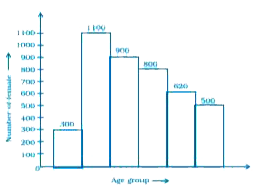
What is the classes width?View SolutionThe following table shows the number of students in different classes of a high school. Draw a histogram to represent the given data.
ClassesVIVIIVIIIIXXNumber of students3742355048View SolutionThe below histogram shows the number of literate females in the age group of 10 to 40 years in a town.
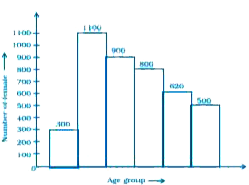
In which age group is the number of literate females the highest?View SolutionThe histogram given below shows the number of literate females iin the age group of 10 to 40 years. Study the histogram carefully and answer the questions that follow.
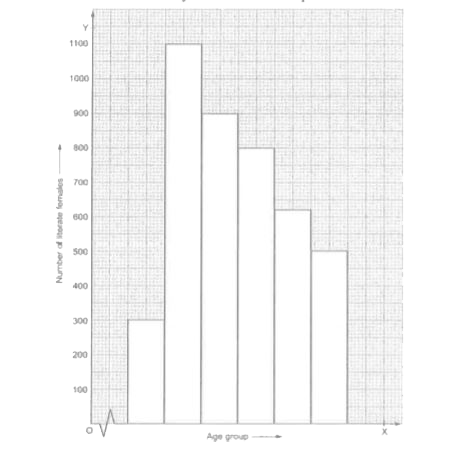
(i) Write the classes, assuming that all the classes are of equal width.
(ii) What is the class width?
(iii) In which age group are the literate females the least?
(iv) In which age group is the number of literate females the highest?View SolutionThe following table shows the marks secored by a student in annual examination in various subjects. Draw a histogram to represent the given data.
SubjectTeluguHindiEnglishMathsScienceSocial StudiesMarks807482949088View Solution

