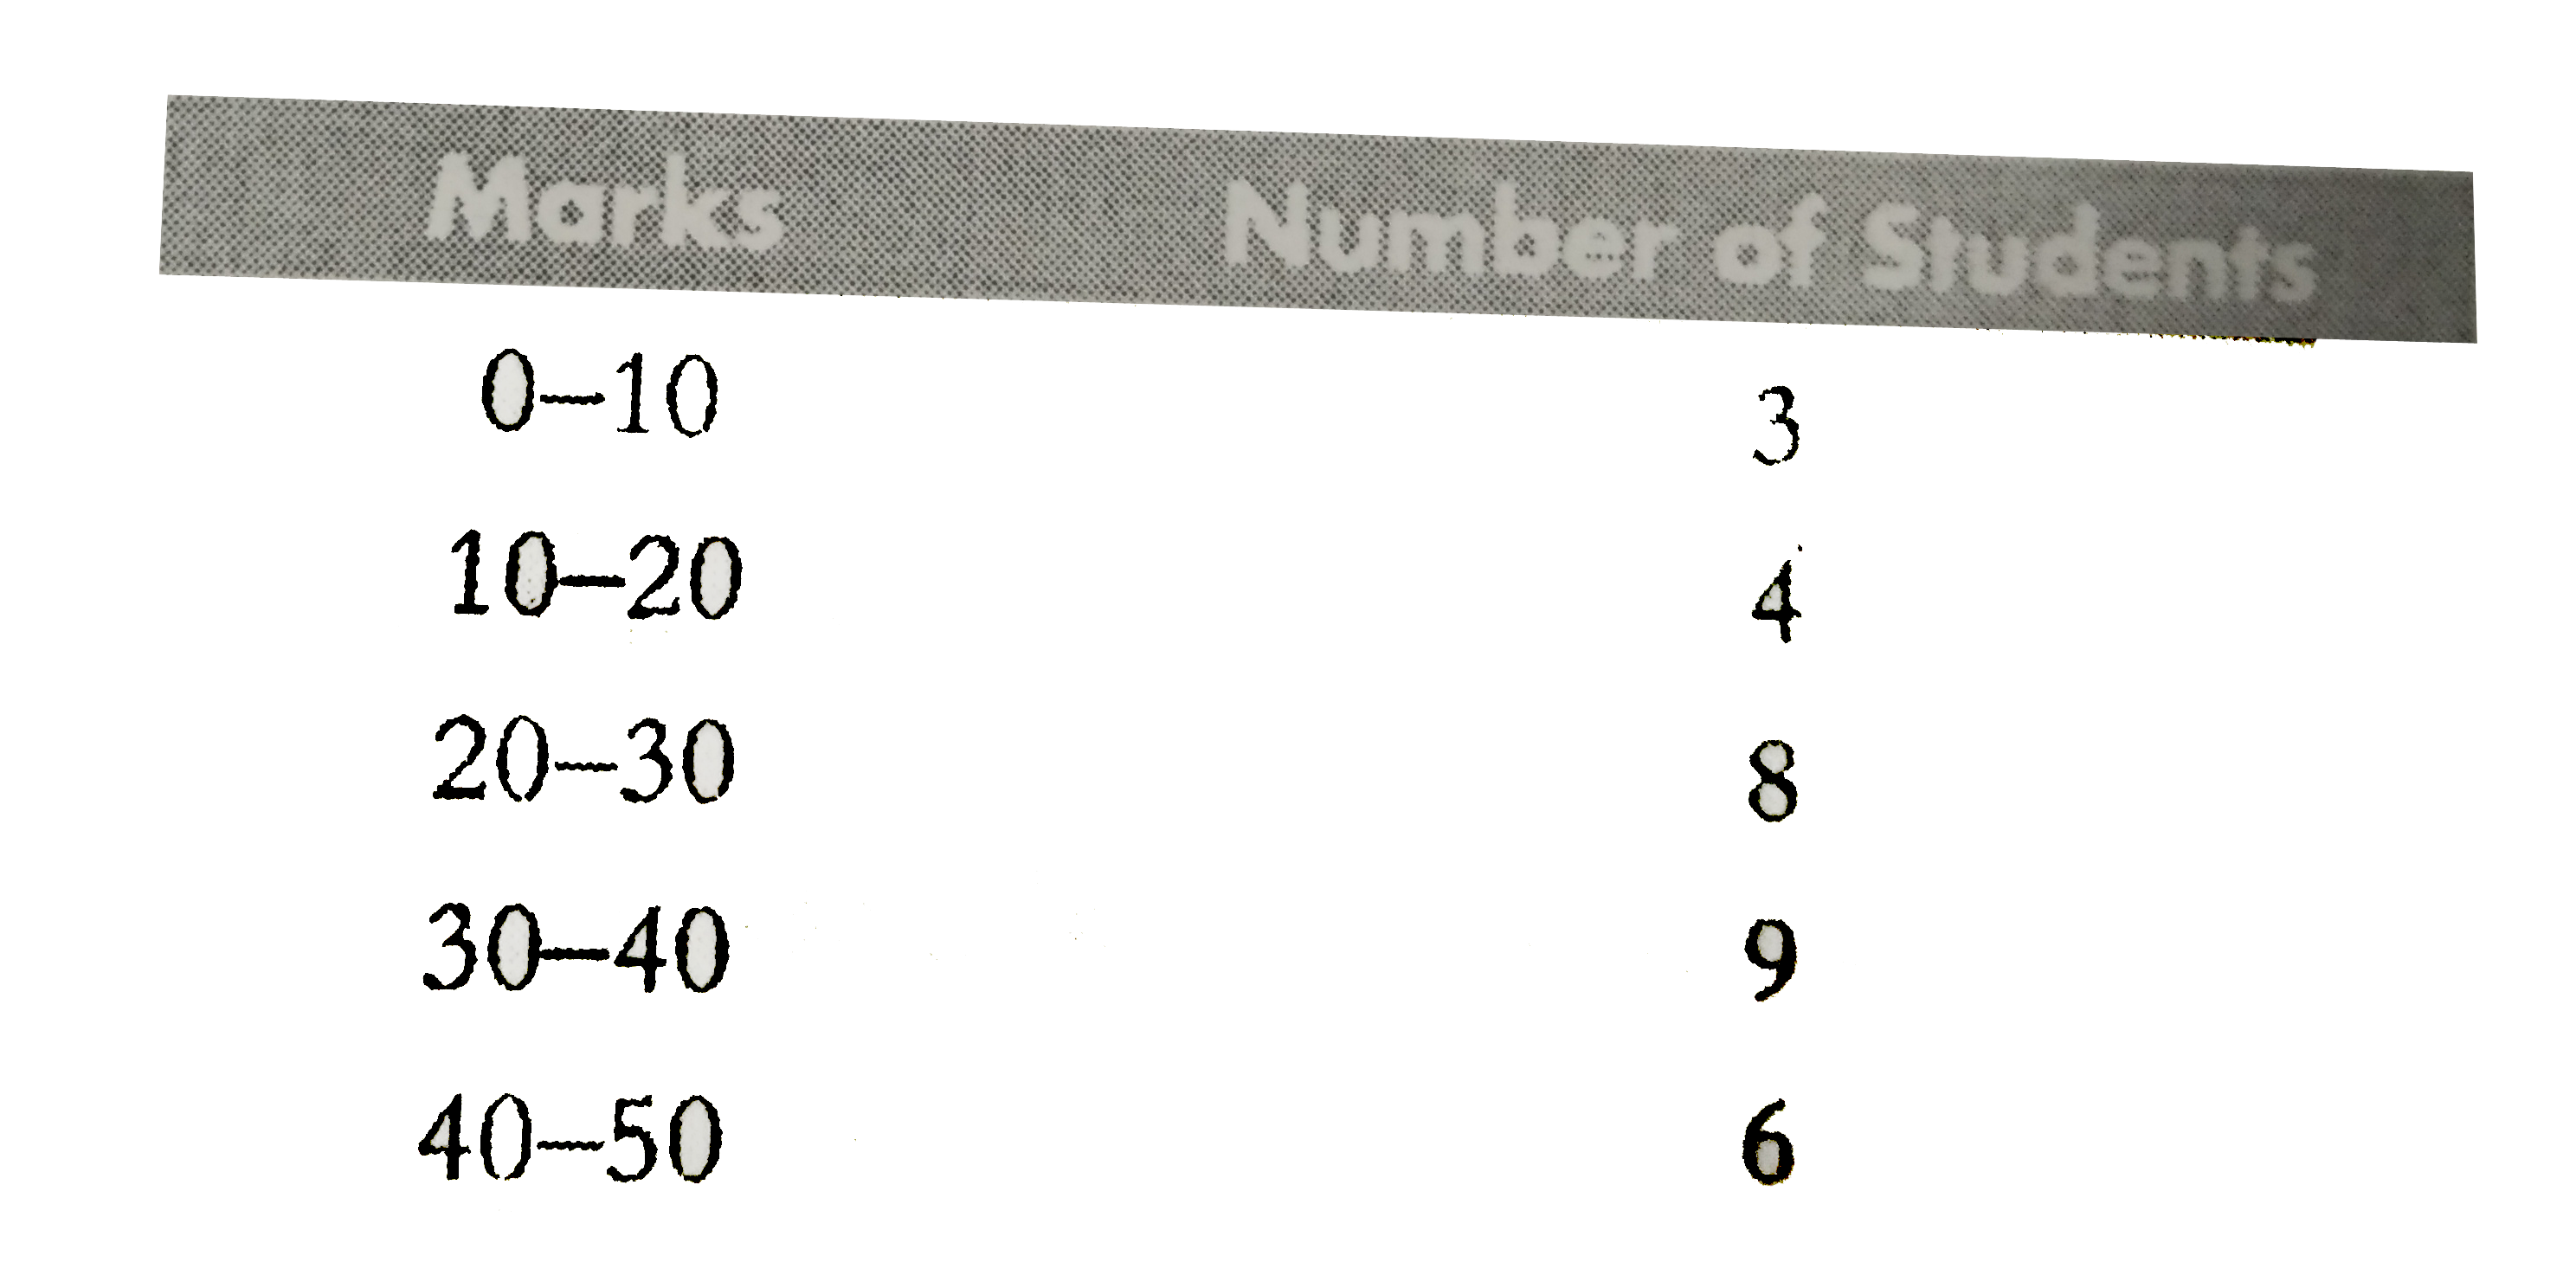
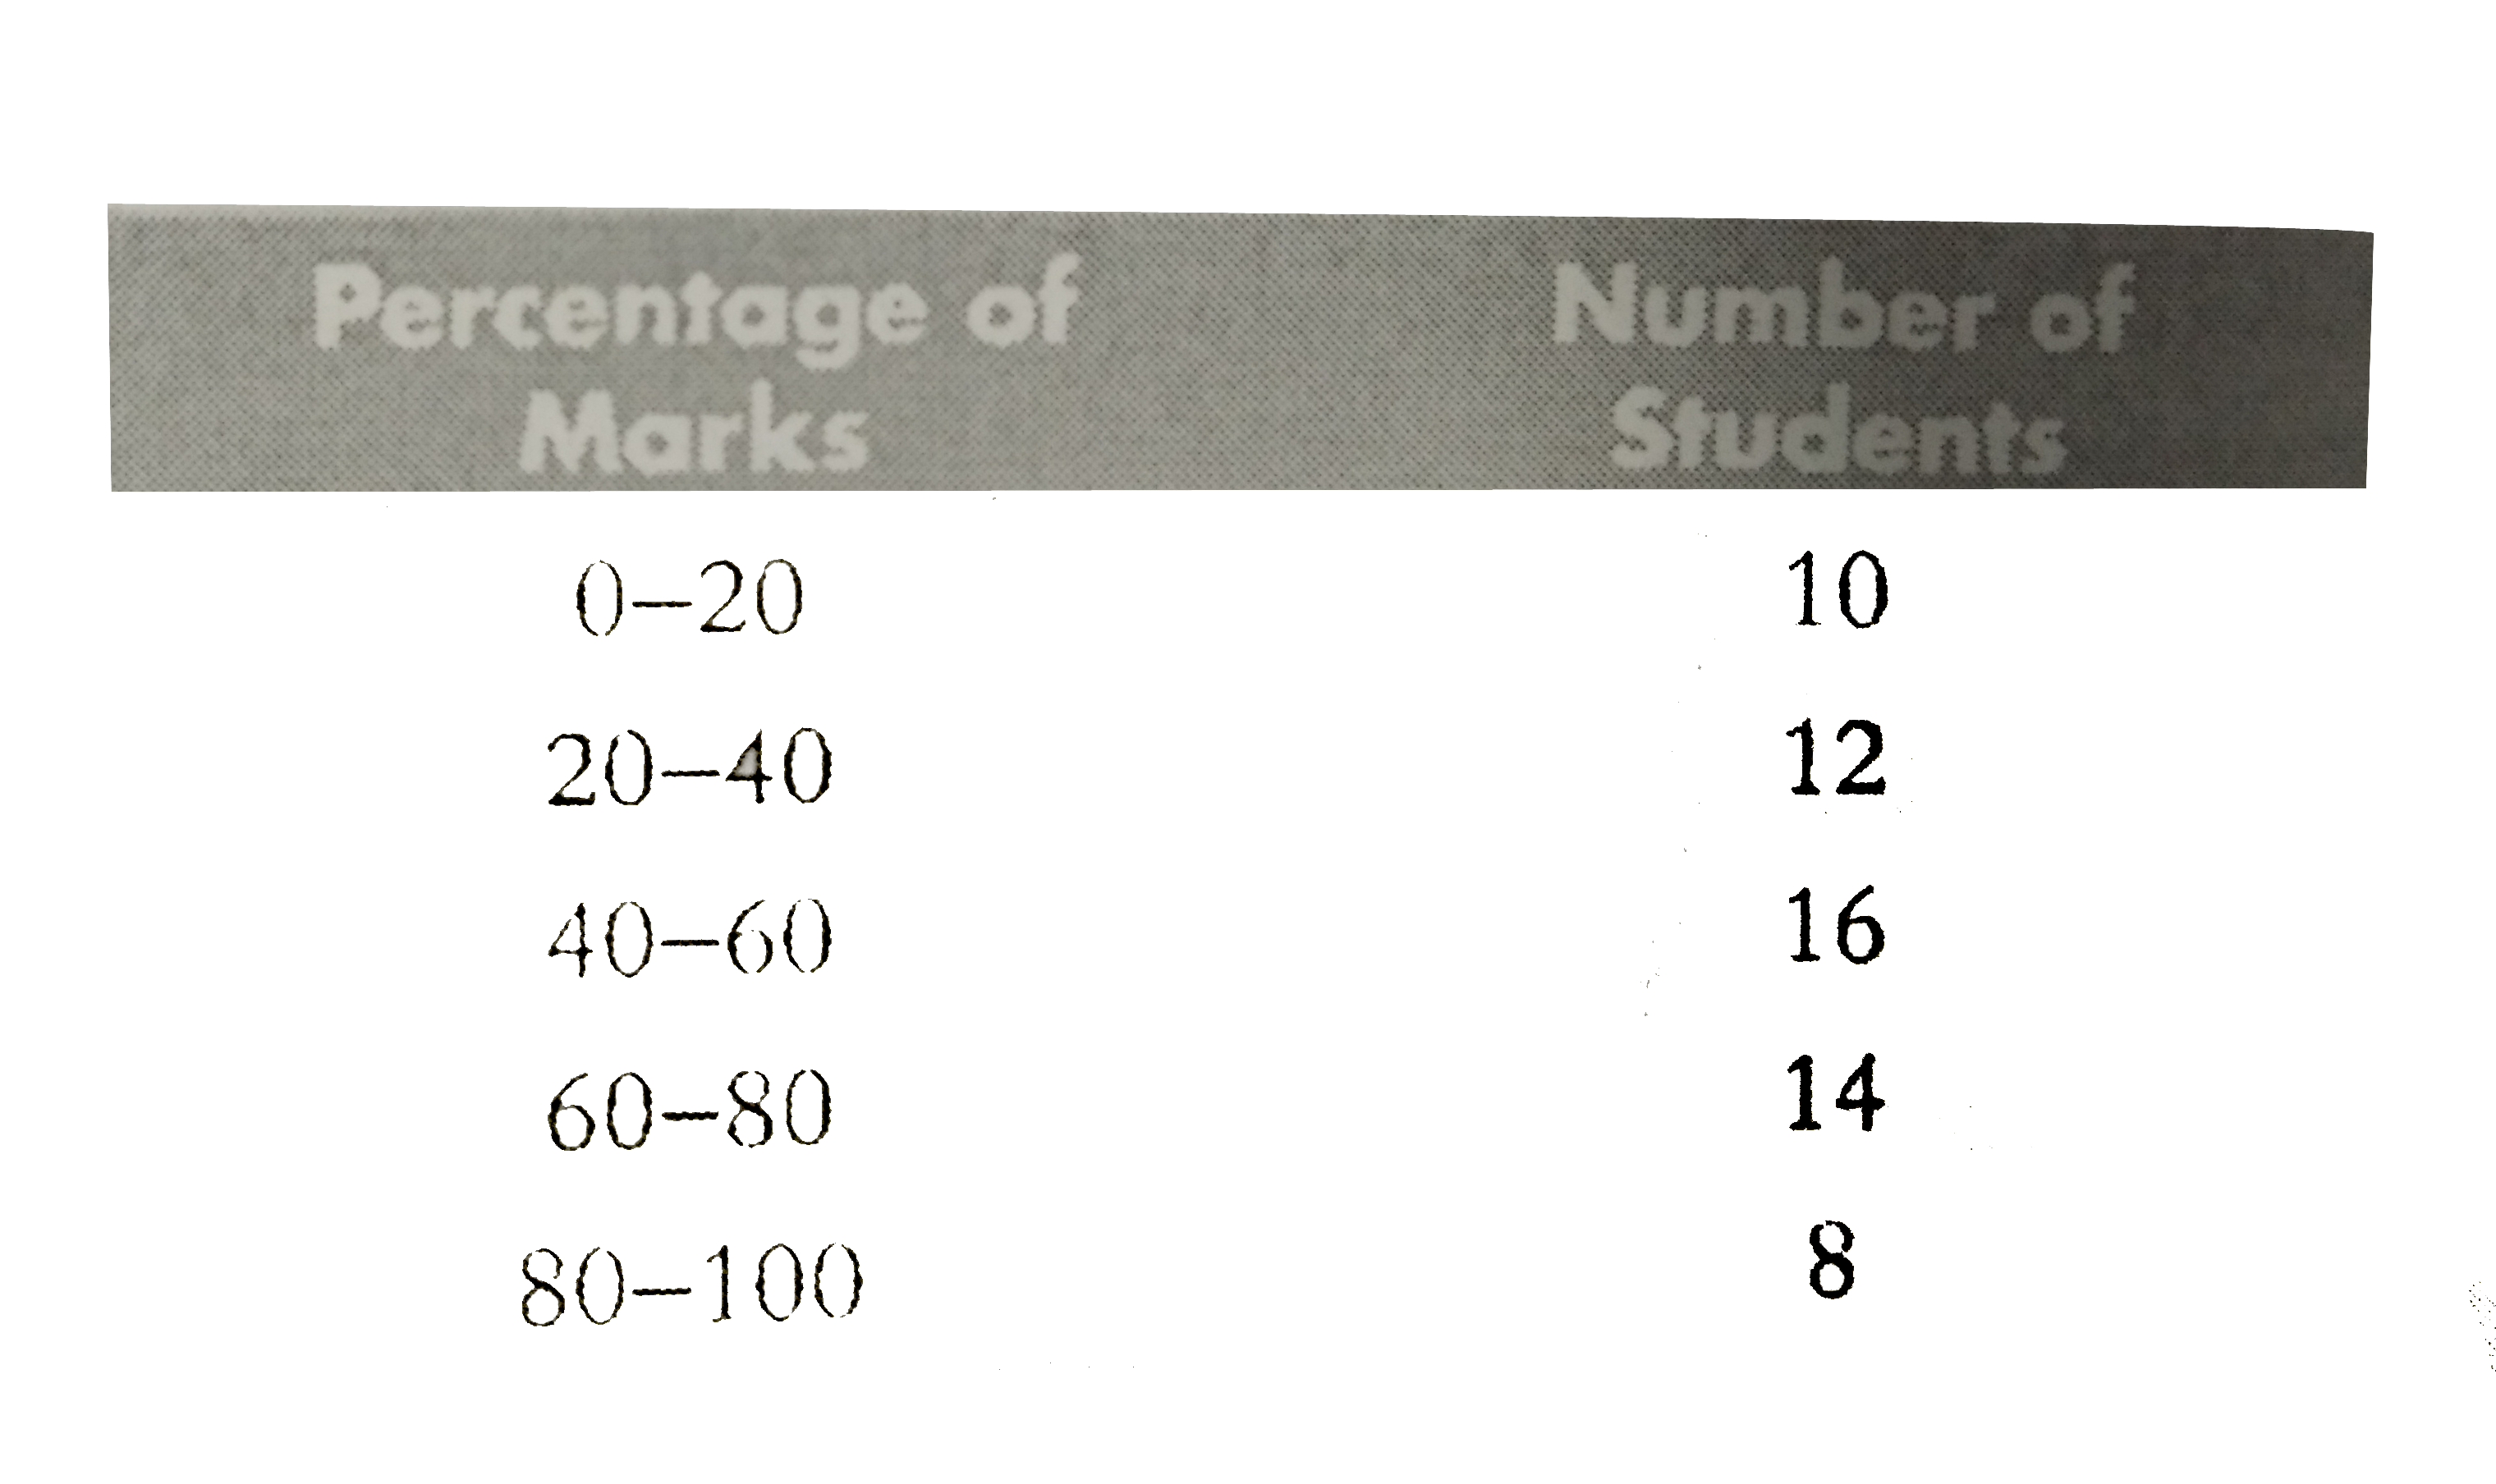
Draw a histogram of the following distribution:

Video Solution
Text Solution
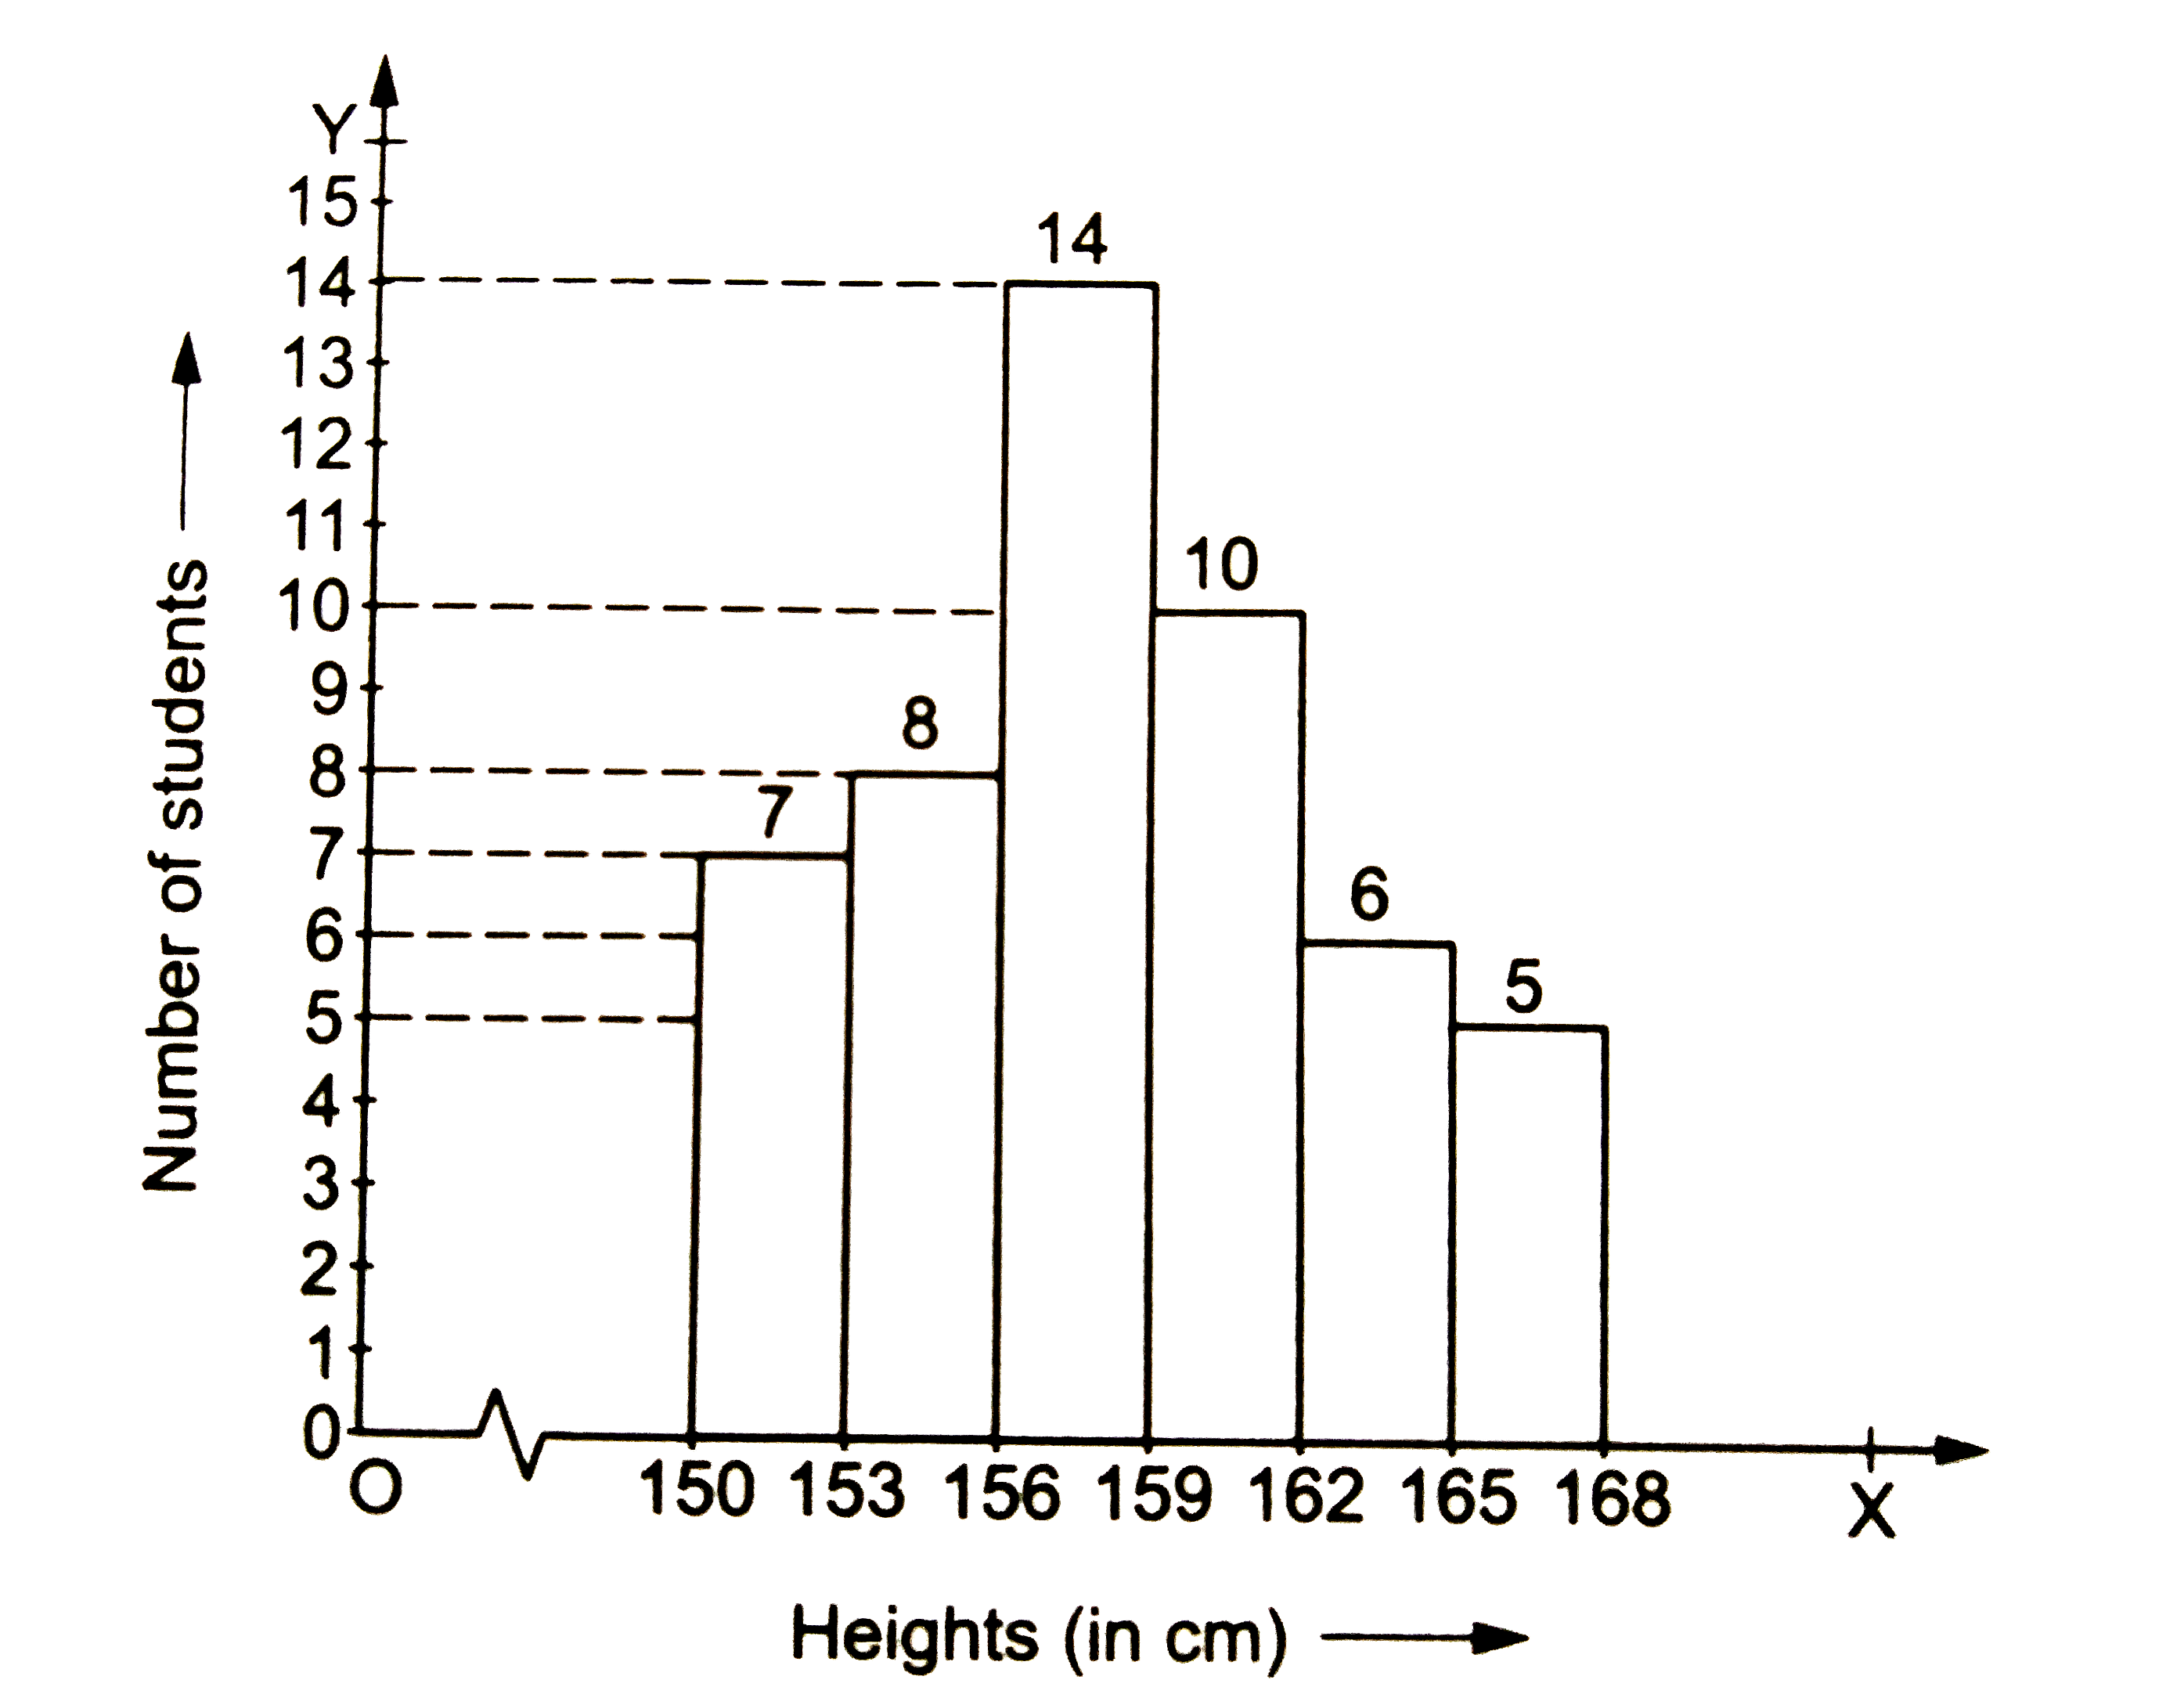
Clearly, the given frequency distribution is in exclusive form. We represent the class intervals (showing heights in cm) along the x-axis on a suitable scale and the corresponding frequencies (showing the number of students) along the y-axis on another suitable scale.
We construct rectangles with class intervals as bases and the corresponding frequencies as heights. Thus, we obtain a histogram, as shown below.

|
Updated on:21/07/2023
Topper's Solved these Questions
- BOOK - RS AGGARWALCHAPTER - BAR GRAPH, HISTOGRAM AND FREQUENCY POLYGONEXERCISE - EXERCISE 17A12videos
BAR GRAPH, HISTOGRAM AND FREQUENCY POLYGON
- BOOK - RS AGGARWALCHAPTER - BAR GRAPH, HISTOGRAM AND FREQUENCY POLYGONEXERCISE - EXERCISE 17B16videos
BAR GRAPH, HISTOGRAM AND FREQUENCY POLYGON
- BOOK - RS AGGARWALCHAPTER - BAR GRAPH, HISTOGRAM AND FREQUENCY POLYGONEXERCISE - EXERCISE 17B16videos
BAR GRAPH, HISTOGRAM AND FREQUENCY POLYGON
- BOOK - RS AGGARWALCHAPTER - AREAS OF TRIANGLES AND QUADRILATERALSEXERCISE - Multiple Choice Questions (Mcq)16videos
AREAS OF TRIANGLES AND QUADRILATERALS
- BOOK - RS AGGARWALCHAPTER - CIRCLES EXERCISE - MULTIPLE CHOICE QUESTION(MCQ)37videos
CIRCLES
Similar Questions
Draw a histogram of the following data
 View Solution
Draw a histogram of the following data.
 View Solution
Draw the histogram for the following distribution :
 View Solution
Draw a histogram of the following data :
 View Solution
Construct a histogram for the following distribution:
 View Solution
Draw a histogram for the following data:
 View Solution
Draw a histogram for the following data.
 View Solution
Draw a histogram from the following data:
 View Solution
Draw a histogram of the following data on a graph paper and estimate the mode .
 View Solution
Draw a histogram of the following frequency distribution and use it to calculate the mode
View Solution

